6 - Major Ecological Communities
 Call Kai
 Learn
 Practice Test
 Spaced Repetition
 Match
 Flashcards
 Knowt Play
1/18

There's no tags or description
Looks like no tags are added yet.
19 Terms
what r the 2 types of communities?


whats this explaining
This slide introduces the Intertidal Zone, which serves as the specific ecosystem context for the keystone species examples you've been reviewing (such as the Pisaster starfish and whelks from the previous graph).
The Photo (Top Left): Shows a real-world view of an intertidal zone ecosystem during low tide. You can clearly see rocky tide pools containing orange starfish (Pisaster) and whelks/mussels, directly connecting this physical location to your previous keystone species lessons.

whats this explaining
what do animals need to have
This graph explains the Spring/Neap Tidal Cycle, showing how water levels dynamically change over time to create the harsh environmental conditions of the Intertidal Zone.
Key Concepts Taught by the Graph
Spring Tides (Left Side - July 20–24):
What happens: The highest high tides and the lowest low tides (maximum tidal range).
Why it matters: This is when organisms in the intertidal zone face the most extreme stress, as they are exposed to air, sun, and temperature changes for the longest duration during the ultra-low tides.
Neap Tides (Right Side - July 28–31):
What happens: Moderate high tides and moderate low tides (minimum tidal range, a much flatter wave).
The Four Tidal Benchmarks (Right Margin):
M.H.W.S / M.L.W.S: Mean High/Low Water Spring (the extreme water levels reached during spring tides).
M.H.W.N / M.L.W.N: Mean High/Low Water Neap (the milder water levels reached during neap tides).
Organisms living in the intertidal zone (like the starfish and mussels from your previous slides) must have specialized adaptations to survive these regular patterns of being completely submerged in ocean water and completely exposed to dry air.what does this explain


what does this explain?
is slide explains Vertical Zonation, showing how the physical stress of the tides creates distinct horizontal bands of life on rocky shores.
It connects the tidal benchmarks from your previous graph to an Emersion Curve to explain why organisms organize themselves in specific vertical layers.
Vertical zonation is the spatial arrangement of plants and animals into distinct bands based on their ability to survive environmental stress (like drying out at the top) vs. biological pressure (like competition and predation at the bottom).
The Graph: Emersion Curve (Out of Water)
X-Axis (Percentage Exposure to Air): Tracks how much time a specific height on the shore spends exposed to dry air instead of submerged in water (0% = always underwater; 100% = always in the air).
Y-Axis (Height in Feet): The vertical position on the rocky shoreline, mapped against the familiar tidal markers (M.H.W.S, M.L.W.S, etc.).
The Takeaway: The higher up the rock you go, the exposure to air increases drastically. Organisms at 16 feet spend nearly 90-100% of their lives exposed to the harsh sun and wind, while organisms at 2 feet spend less than 20% of their time out of water.
The Photo: Real-World Vertical Zonation
The photo on the right shows a rocky cliff face exhibiting clear, colored bands ("stripes") of distinct marine life:
Upper Zone (Top white band): Only organisms highly resistant to drying out (like barnacles) can survive here because it is exposed to air most of the day.
Middle Zone (Brownish-dark band): Home to species like mussels and rockweed that require a balance of air exposure and underwater feeding time.
Lower Zone (Greenish band near water): Home to delicate organisms (like seaweeds and sea stars) that can only tolerate being exposed to air for very brief moments during the lowest tides.
talk about the subtidal kelp bed communities
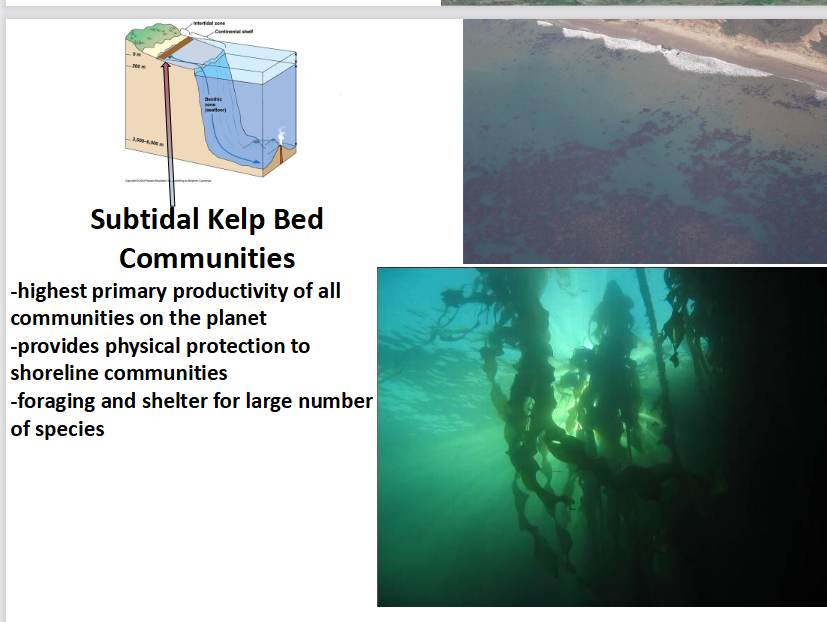
This slide shifts focus from the intertidal zone to the Subtidal Kelp Bed Communities, which are located deeper down, just past the low-tide mark.
This ecosystem serves as the specific home for the Dominant species (Kelp) and the Keystone species (Sea Otters) that you looked at in your earlier slides.
3 Key Characteristics of Kelp Beds
Highest primary productivity on the planet: Kelp grows incredibly fast by capturing sunlight and nutrients, producing massive amounts of energy that fuels the entire marine food web.
Physical protection to shoreline communities: The dense, underwater forests of kelp act as a natural breakwater. They absorb wave energy and slow down coastal erosion, protecting the nearby intertidal zones.
Foraging and shelter for a large number of species: Kelp functions as a biological habitat creator. It provides physical structure, hiding spots, and feeding grounds for hundreds of species, including fish, sea urchins, and sea otters.
This slide explicitly shows why kelp is a Dominant Species (high impact due to its massive biomass) and sets up the structural environment that sea otters protect by keeping kelp-eating urchins in check.

explain
what r the 4 typesof classification
This diagram maps out the complete classification of ocean zones, detailing how marine environments are divided based on distance from the shore, water depth, and light penetration.
It expands on your previous slides by zooming out to show where the intertidal and subtidal zones fit within the entire global ocean structure.
🌊 1. Horizontal Classification (Distance from Shore)
Intertidal Zone: The shoreline area between high and low tides.
Continental Shelf: The shallow, sloping underwater edge of a continent.
Oceanic Zone (Pelagic Zone): The vast, open ocean waters beyond the continental shelf.
☀ 2. Classification by Light Availability
Photic Zone: The sunlit upper layer (roughly top 200m) where sunlight penetrates and photosynthesis can happen.
Aphotic Zone: The deep, pitch-black water layers where sunlight cannot reach.
📉 3. Vertical Classification by Depth (Pelagic Layers)
Epipelagic (0–200m): The sunlit surface layer; contains most marine life (like the tuna and whales pictured).
Mesopelagic (200–1000m): The twilight zone; dim light, no photosynthesis.
Bathypelagic (1000–4000m): The midnight zone; completely dark and cold.
Hadal (4000–6000m): The deepest trenches of the ocean.
⚓ 4. The Seafloor (Benthic Zone)
Benthic Zone: Refers to the actual ocean floor itself, running from the shallow shoreline all the way down to the deepest abyssal plains. Organisms living here are called "benthos."

explain
This slide explains Shallow Coral Reefs, detailing their global geographic distribution and the three developmental stages of how they form around volcanic islands.
This slide highlights Coral as a Dominant Species. Like the kelp forests you looked at previously, corals create the massive physical structure and biomass of this ecosystem, providing high primary productivity and habitat for thousands of other marine species.
Coral Reef Development
Tropical Restriction: Confirmed to warm, shallow tropical waters near the equator due to sunlight-dependent symbiotic algae.
Darwin’s Subsidence Theory: Reefs evolve in three stages as a volcanic island slowly sinks:
Fringing Reef: Coral grows tightly along the island's edge.
Barrier Reef: The island shrinks, leaving a wide lagoon between the shore and the reef.
Atoll: The island sinks completely, leaving only a circular ring of coral around a central lagoon.

explain
🧬 The Core Symbiosis: Zooxanthellae
The Partnership: Clear coral animals host microscopic, single-celled algae called Zooxanthellae inside their tissues.
Algae Role: Perform photosynthesis to supply the coral with vital sugars, oxygen, and nutrients to build its skeleton.
Coral Role: Provide the algae with carbon dioxide, waste nutrients, and a safe, protected home.
🗺 Environmental Constraints
Tropical Restriction: Confirmed strictly to clear, shallow, warm waters near the equator.
The Reason: The Zooxanthellae depend entirely on intense, direct sunlight to drive their photosynthesis.
🌿 Core Ecological Traits
Biodiversity Hotspot: Support the greatest species diversity of vertebrates on the planet (acting as marine rainforests).
Vibrant Coloration: The "kaleidoscope of colors" on a healthy reef is produced directly by pigments inside the Zooxanthellae.
Nutrient Recycling: Excel at a highly efficient recycling of nutrients, allowing massive reefs to thrive in nutrient-poor tropical waters.
Global Vulnerability: Currently under major global threat; environmental stress disrupts this fragile symbiosis, triggering devastating coral bleaching.
explain this
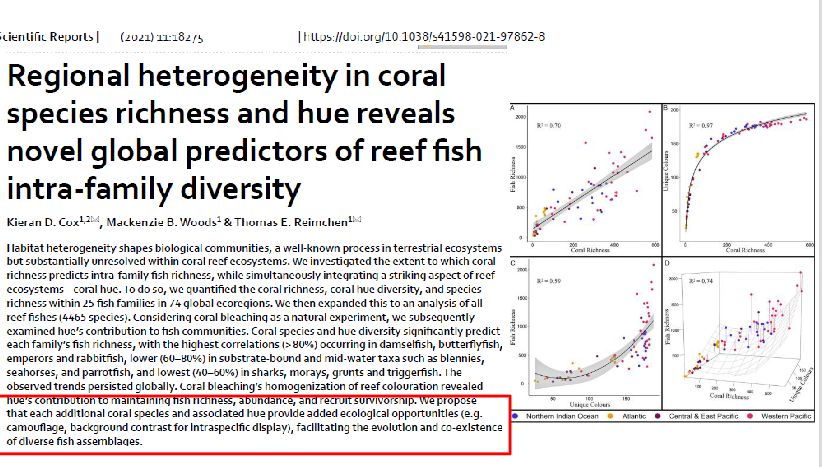
This slide shows a real scientific research paper that provides empirical proof for the phrase "kaleidoscope of colors" and high biodiversity mentioned on your previous slide.
It demonstrates that the physical variety of coral species (richness) and the diversity of coral colors (hue) directly dictate how many different types of fish can live on a reef.
The Big Takeaway (The Red Boxed Text)
The text highlighted at the bottom explains the why behind these mathematical graphs:
Ecological Opportunities: Each additional coral species and its specific hue creates unique micro-habitats and visual environments.
Camouflage: Diverse colors allow a wider variety of specialized fish to blend into their backgrounds and hide from predators.
Background Contrast: Distinct hues give fish a visual backdrop to perform intraspecific displays (mating signals or territorial warnings to members of their own species).
Co-existence: Ultimately, having a visually complex, multi-colored habitat allows thousands of different species to evolve, fit into specialized niches, and co-exist without outcompeting one another.
The paper warns that when coral bleaching happens, it strips away these vibrant hues, homogenizing (flattening) the reef's appearance. When a reef loses its color complexity, the fish lose their camouflage and communication backdrops, causing fish populations and diversity to plummet.
what are the 2 polar regions?

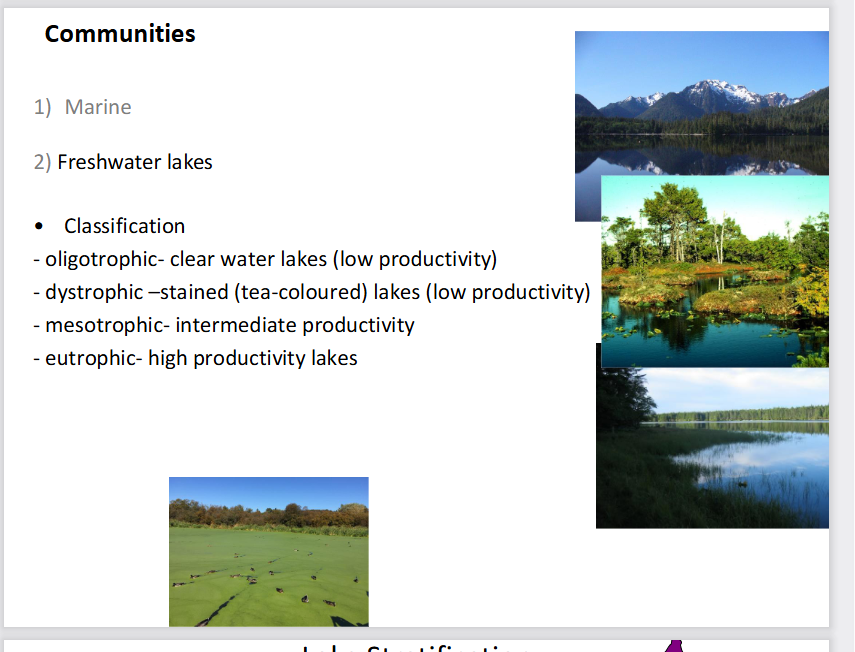
what is the classification of Freshwater lakes? (4)

explain this
This slide explains Lake Stratification and Seasonal Turnover, showing how temperature and oxygen levels change vertically throughout the water column during different seasons of the year.
1. Summer Stratification (Top Section)
During the summer, solar radiation heats the surface water, creating three distinct, unmixed layers based on temperature and density:
Epilimnion (Top Layer): The warm, well-lit surface layer. Wind mixes this water, keeping it highly oxygenated (as shown by the high oxygen red line on the right graph).
Thermocline (Middle Layer): A narrow transition zone where temperature drops rapidly with depth, acting as a physical barrier that prevents top and bottom waters from mixing.
Hypolimnion (Bottom Layer): Deep, cold, dense water. Because it is completely cut off from the atmosphere and sunlight, its oxygen levels plunge drastically over the summer as decomposers consume it (the red oxygen line drops close to zero at the bottom).
🍂 2. Fall Turnover (Bottom-Left Section)
What happens: As autumn approaches, air temperatures drop, cooling the warm surface layer (Epilimnion).
The Physics: When water cools to \(4^{\circ }\text{C}\), it reaches its maximum density. This heavy, dense surface water sinks to the bottom, forcing the deep water up.
The Result: Driven by autumn winds, the entire lake completely mixes (Turnover). As shown by the straight vertical lines in the graph, temperature and oxygen become completely uniform from top to bottom. This delivers vital oxygen to the deep lake floor.
❄ 3. Winter Stratification (Bottom-Right Section)
Inverse Stratification: In winter, an ice sheet forms at the surface (\(0^{\circ }\text{C}\)). Because water is unique and actually becomes less dense as it freezes into ice, the coldest water (\(0^{\circ }\text{C}\)) floats on top of the slightly warmer, denser water (\(4^{\circ }\text{C}\)) at the bottom.
Oxygen Trap: The ice sheets seal the lake from atmospheric oxygen. While fish can survive in the \(4^{\circ }\text{C}\) bottom water, oxygen levels slowly deplete near the lake bed due to ongoing winter decomposition.
what is the third type of community? (1)
Terrestrial communities!

list all the types of terrestrial territories (7)
Tundra
Temperate coniferous forest
Prairie
Temperate decidious forest
Savanna
Dessert and semi-desert
Tropical forest
talk about the terrestrial territory Tundra

talk about the terrestrial territory Temperate rainforest
1. Temperate Coniferous Forests (Taiga or Boreal Forest)
Dominant Flora: Conifers (e.g., spruce, hemlock, fir, cedar, pine).
Vegetation Layers: Few shrubs, with a distinct ground layer of ferns and mosses.
Growth Form: Trees exhibit monopodial growth (growing upward with a single main central trunk).
Ecosystem Strata: Divided into 4 distinct layers (Trees, Shrubs, Ground, Soil).
Climate & Decomposition: Characterized by short summers and long, cold winters, which leads to slow decomposition rates in the soil.
Fauna Adaptations: Features seasonal animal migrants alongside resident species that utilize occasional hibernation or torpor to survive the cold.
🪵 2. Temperate Rainforests (West Coast of North and South America)
Structural Characteristics:
Home to ancient trees (up to 1,000 years old, reaching 4 meters in diameter).
Divided into 4 layers, creating high 3D structural complexity.
Features exceptionally species-rich riparian zones (habitats along riverbanks).
Biodiversity Hotspot: Supports an immense diversity of fungi, mosses, angiosperms (flowering plants), and insects.
Disturbance & Recovery: Requires 1,000 years for seral stage recovery to rebuild its complex community structure after clear-cutting.
Global Record: Boasts the greatest biomass per hectare (biomass/ha) of all terrestrial ecosystems on the planet.

talk about the terrestrial territory Tropical forests
This slide explains the 6 Strata (Vertical Layers) of a Tropical Rainforest, showing how intense competition for sunlight drives extreme structural complexity and high biodiversity.
🌳 The 6 Vertical Layers (A to F)
A - Emergent Trees (Over 60 m): The tallest giants poking out above the canopy.
Growth Form: They feature discontinuous, sympodial growth (forked, wide-spreading branching patterns) rather than the straight, single-trunk monopodial growth seen in conifers.
B - Upper Canopy (Up to 20 m): A discontinuous layer of tall trees below the emergents.
C - Lowest Trees: A continuous canopy layer that creates a dense ceiling, blocking out up to 99% of sunlight from reaching the forest floor.
D - Shrub Layer: Composed of shrubs, tall herbs, and ferns adapted to low-light conditions.
E - Ground Layer: Composed of small herbaceous plants and seedlings waiting for a canopy gap to grow.
F - Root/Soil Layer: Interestingly, the soil is shallow and poorly developed because nutrients are locked in the living biomass rather than stored in the dirt.
🌿 Key Ecological Traits
Lianas: Woody vines that physically connect layer A to layer F, climbing up the giant trees to reach sunlight at the top.
Epiphytes: Air plants (like orchids and bromeliads) that grow directly on branches high up in the trees to access light, completely bypassing the dark forest floor.
Extreme Biodiversity: Features high species diversity across almost all taxonomic groups.
High Biological Turnover: Dead matter decomposes almost instantly due to the warm, wet climate, leading to rapid recycling of nutrients back into living plants rather than accumulating in the soil.


whats the big takeaway
This slide explains
Nutrient Distribution (specifically Nitrogen) across different global biomes, demonstrating how temperature and climate dictate where ecosystems store their nutrients.
Each pie chart tracks how nitrogen is divided among three compartments: Above ground (living stems/leaves), Roots, and Soil.
🥶 1. Arctic & Boreal Biomes (Tundra, Taiga)
The Pattern: The vast majority of nitrogen is trapped in the Soil. Almost none is found in the living above-ground biomass.
The Reason: Because of the freezing, long winters, decomposition is incredibly slow. Dead leaves and organic matter accumulate on the ground without breaking down, locking nutrients away in the cold dirt where plants can't easily use them.
🍂 2. Temperate Biomes (Grassland, Deciduous Forest)
The Pattern: Nitrogen is much more evenly distributed between the soil, roots, and above-ground plant tissues.
The Reason: Moderate temperatures and distinct seasonal cycles allow for balanced decomposition and steady nutrient uptake by plants.
☀ 3. Tropical Biomes (Savannah, Equatorial/Rainforest)
The Pattern: The vast majority of nitrogen is held Above ground in the living vegetation. The Soil holds almost no nutrients.
The Reason: This connects directly to the "high biological turnover" from your previous rainforest slide. The warm, humid tropical climate causes dead organic matter to decompose almost instantly. Plants immediately absorb those freed-up nutrients back into their living tissues, leaving the soil nutrient-poor and shallow.
The Big Takeaway for the Exam
As you move from the cold poles to the warm equator, the major nutrient bank of an ecosystem flips completely: from being locked away in the soil (Arctic) to being stored inside living plants (Tropical).

This slide explains Global Atmospheric Circulation Cells, showing how giant loops of moving air create the planet's distinct climate zones and dictate where major biomes form.
🌬 The Three Circulation Cells
Hadley Cell (\(0^{\circ }\) to \(30^{\circ }\)): Fuels tropical rainforests at the equator and creates deserts at \(30^{\circ }\).
Ferrel Cell (\(30^{\circ }\) to \(60^{\circ }\)): Drives mid-latitude weather, supporting temperate forests and grasslands.
Polar Cell (\(60^{\circ }\) to \(90^{\circ }\)): Creates high-latitude precipitation for taiga forests and leaves the poles frozen and dry.
🌧 Climate & Biome Mechanisms
Equator (\(0^{\circ }\)): Hot, moist air rises, cools, and dumps heavy rain, creating Tropical Rainforests.
Subsidence Zones (\(30^{\circ }\)): High, dry air sinks and compresses, warming up and absorbing moisture to create Deserts.
High Latitudes (\(60^{\circ }\)): Rising moist air drives the growth of Evergreen Coniferous Forests (Taiga).
Poles (\(90^{\circ }\)): Cold, dry air falls, locking the Arctic Tundra and polar caps in a freezing, low-precipitation zone.
Wind Belts: Surface air rushing back toward the equator creates the Northeast and Southeast Trade Winds.