Ch. 4 Analysis of Financial Statements
 Call Kai
 Learn
Learn Practice Test
 Spaced Repetition
 Match
Match Flashcards
 Knowt Play
1/33

There's no tags or description
Looks like no tags are added yet.
Name | Mastery | Learn | Test | Matching | Spaced | Call with Kai | Chat |
|---|
No analytics yet
Send a link to your students to track their progress
34 Terms
We divide ratios into 5 categories
Liquidity ratios, which give an idea of the firm’s ability to pay off debts that are maturing within a year.
Asset management ratios, which give an idea of how efficiently the firm is using its assets.
Debt management ratios, which give an idea of how the firm has financed its assets as well as the firm’s ability to repay its long-term debt.
Profitability ratios, which give an idea of how profitably the firm is operating and utilizing its assets.
Market value ratios, which give an idea of what investors think about the firm and its future prospects.
Liquid Asset
An asset that can be converted to cash quickly without having to reduce the assets price very much.
Liquidity Ratios
Ratios that show the relationship of a firm’s cash and other current assets to its current liabilities.
Current Ratio
This ratio is calculated by dividing current assets by current liabilities.
It indicates the extent to which current liabilities are covered by those assets expected to be converted to cash in the near future.

Assets
Cash
Marketable securities
accounts receivable
inventories
Liabilities
Accounts payable
accrued wages and taxes
short term notes payable
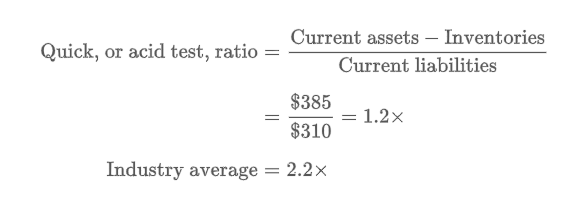
Quick/Acid test ratio
Second liquidity ratio.
This ratio is calculated by deducting inventories from current assets and then dividing the remainder by current liabilities.
Asset Management Ratios
A set of ratios that measure how effective a firm is managing its assets.
These ratios answer this question: Does the amount of each type of asset seem reasonable, too high, or too low in view of current and projected sales?
Inventory Turnover Ratio
This ratio is calculated by dividing cost of goods sold by inventories. It indicates how many times inventory is turned over during the year.

Days Sales Outstanding (DOS) Ratio or Average Collection Period (ACP)
This ratio is calculated by dividing account receivable by average sales per day.
It indicates the average length of time the firm must wait after making a sale before it receives cash.

Fixed Asset Turnover Ratio
The ratio of sales to net fixed assets. It measures how effectively the firm uses its plant and equipment.

Total Assets Turnover Ratio
This ratio is calculated by dividing sales by total assets. It measures how effectively the firm uses it total assets.

Debt Management Ratios
A set of ratios that measure how effectively a firm manages its debt.
Determining a firms debt
(1)They check the balance sheet to determine the proportion of total funds represented by debt.
(2)They review the income statement to see the extent to which interest is covered by operating profits.
Total Debt to Total Capital
Measures the percentage of the firm’s capital provided by debtholders.

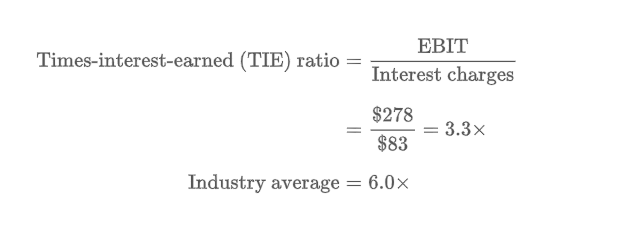
Times Interest Earned (TIE) Ratio
The ratio of earnings before interest and taxes (EBIT) to interest charges; a measure of the firm’s ability to meet its annual interest payments.
Measures the extent to which operating income can decline before the firm is unable to meet its annual interest costs.
Profitability Ratios
A group of ratios that show the combined effects of liquidity, assets, management, and debt on operating results.
Operating Margin
This ratio measures operating income, or EBIT, per dollar of sales; it is calculated by dividing operating income by sales.

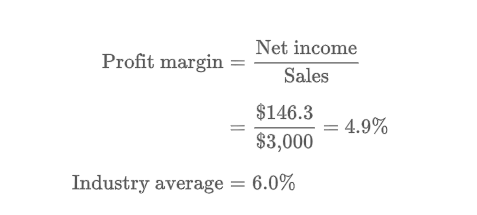
Profit Margin
This ratio measures net income per dollar of sales and is calculate by dividing net income by sales.
Return on Total Assets (ROA)
The ratio of net income to total assets; it measures the rate of return on the firm’s assets.

Return on Common Equity (ROE)
The ratio of net income to common equity; it measures the rate of return on common stockholder’s investments.

Return on Invested Capital (ROIC)
The ratio of after-tax operating income to total invested capital; it measures the total return that the company has provided for its investors.

Basic Earning Power (BEP) Ratio
This ratio indicates the ability of the firm’s assets to generate operating income; it is calculated by dividing EBIT by total assets.

Market Value Ratios
Ratios that relate the firm’s stock price to its earnings and book value per share.
The market value ratios are used in three primary ways:
(1)by investors when they are deciding to buy or sell a stock,
(2)by investment bankers when they are setting the share price for a new stock issue (an IPO), and
(3)by firms when they are deciding how much to offer for another firm in a potential merger.
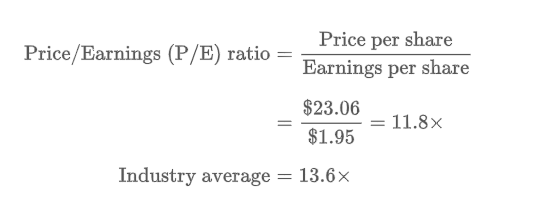
Price/earnings (P/E) Ratio
Shows how much investors are willing to pay per dollar of reported profits.
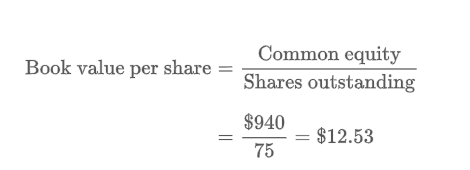
Book Value Per Share
Market/Book (M/B) Ratio
The ratio of a stock’s market price to its book value.

Enterprise Value/ EBITDA (EV/EBITDA) Ratio
The ratio of a firm’s enterprise value relative to its EBITDA.

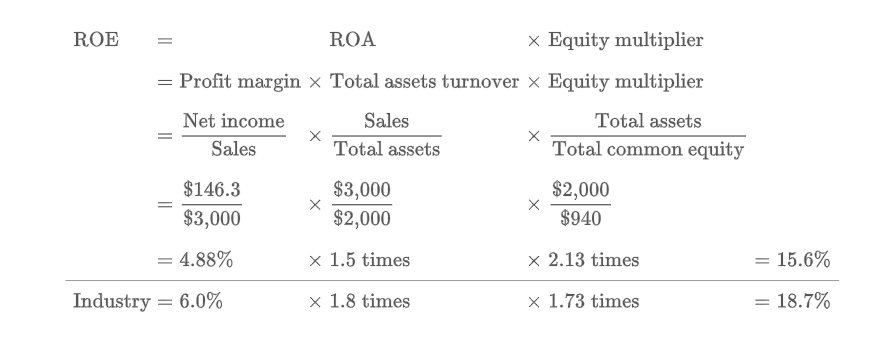
DuPont Equation
A formula which shows that the rate of return on equity can be found as the product of profit margin, total assets, turnover, and the equity multiplier.
It shows the relationship among asset management, and profitability ratios.
Profit Margin= how much the firm earns on its sales. How well operations are going.
Total asset turnover= tells us how many times the profit margin is earned each year. Volume of sales.
Equity Multiplier= is the adjustment factor. Debt the company is taking on.
ROE and Shareholders

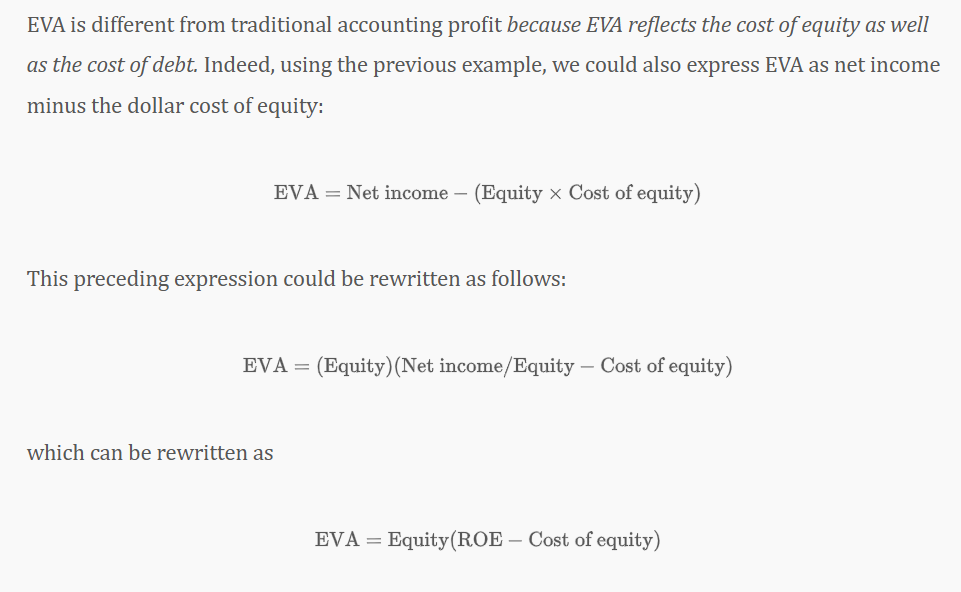
EVA and ROA
Benchmarking
The process of comparing a particular company with a subset of top competitors in its industry.
Trend Analysis
An analysis of a firm’s financial ratios over time; used to estimate the likelihood of improvement or deterioration in its financial condition.
Window Dressing Techniques
Techniques employed by firms to make their financial statements look better than they really are.