APES Unit 3 Quiz 1: Population Growth Models
 Call Kai
 Learn
 Practice Test
 Spaced Repetition
 Match
 Flashcards
 Knowt Play
1/56

Earn XP
Description and Tags
Shoutout Cap for not telling us there was a quiz lmao
57 Terms
Population
The individuals that belong to the same species and live in a given area at a particular time.
Community
All of the populations of organisms within a given area.
Population ecology
The study of factors that cause populations to increase or decrease.
Population size (N)
The total number of individuals within a defined area at a given time.
Population density
The number of individuals per unit area at a given time.
Population distribution
A description of how individuals are distributed with respect to one another.
Sex ratio
The ratio of males to females in a population.
Age structure
A description of how many individuals fit into particular age categories in a population.
Species Niche
Every species has an optimal environment in which it performs particularly well.

Range of tolerance.
All species have an ideal range of abiotic conditions, such as temperature, under which their members can survive, grow, and reproduce. Under more extreme conditions, their ability to perform these essential functions declines.
Niche Generalist
A species that can live under a wide range of abiotic or biotic conditions. Examples include: racoons, coyotes, and cockroaches.
Niche Specialist
A species that is specialized to live in a specific habitat or to feed on a small group of species. Examples include canada lynx, giant pandas, and everglades snail kites
Keystone species
A species that plays a far more important in its community than its relative abundance might suggest. Without it, the ecosystem can dramatically change or collapse. Examples include grey wolves, sea otters, and sea stars.

Ecosystem engineer
A keystone species that creates or maintains habitat for other species. Examples include beavers, african elephants, and prairie dogs.

K-selected species
A species with a low intrinsic growth rate that causes the population to increase slowly until it reaches carrying capacity. Low number of offspring and high levels of parental care. Examples include: elephants, humans, and whales.

Endangered species
a species at high risk of extinction, often due to habitat loss, poaching, and climate change. The Endangered Species Act (ESA) is a U.S. law that protects species deemed at risk.
r-selected species
A species that has a high intrinsic growth rate, which often leads to population overshoots and die-offs. Examples include: insects, arachnids, plants, weeds, amphibians & fish, and small rodents.

Survivorship curve
A graph that represents the distinct patterns of species survival as a function of age.
Type I survivorship curve
A pattern of survival over time in which there is high survival throughout most of the life span, but then individuals start to die in large numbers as they approach old age.

Type II survivorship curve
A pattern of survival over time in which there is a relatively constant decline in survivorship throughout most of the life span.
Type III survivorship curve
A pattern of survival over time in which there is low survivorship early in life with few individuals reaching adulthood.
Population growth models
Mathematical equations that can be used to predict population size at any moment in time.
Population growth rate
The number of offspring an individual can produce in a given time period, minus the deaths of the individual or its offspring during the same period.
Intrinsic growth rate (r)
The maximum potential for growth of a population under ideal conditions with unlimited resources.
Exponential growth model (Nt = N0ert) or J-shaped growth curve
A growth model that estimates a population’s future size (Nt ) after a period of time (t), based on the intrinsic growth rate (r) and the number of reproducing individuals currently in the population (N0). When populations are not limited by resources, their growth can be very rapid. More births occur with each step in time, creating a J-shaped growth curve.

Logistic growth model (s-shaped curve)
A growth model that describes a population whose growth is initially exponential, but slows as the population approaches the carrying capacity and resource limit of the environment. S-shaped when graphed.

Overshoot and die-off model
If food becomes scarce or other conditions change, a population can experience fluctuations between overshooting and dying off (mostly applies to r-selected species).

Density-dependent factor
A factor that influences an individual’s probability of survival and reproduction in a manner that depends on the size of the population. Examples include nutrient availability, disease transmission, and space.
Density-independent factor
A factor that has the same effect on an individual’s probability of survival and the amount of reproduction at any population size. Examples include major storms, droughts, heat waves, and fires
Demography
The study of human populations and population trends.
Demographer
A scientist in the field of demography.
Age structure diagram
A visual representation of the number of individuals within specific age groups for a country, typically expressed for males and females.The horizontal axis of the age structure diagram shows the population size in millions for males and females in each 5-year age group shown on the vertical axis.
Population pyramid
An age structure diagram that is widest at the bottom and smallest at the top, typical of developing countries.

Population momentum
Continued population growth after growth reduction measures have been implemented.
Total fertility rate (TFR)
An estimate of the average number of children that each woman in a population will bear throughout her childbearing years.
Replacement-level fertility
The total fertility rate required to offset the average number of deaths in a population in order to maintain the current population size (2.1children per woman). Replacement level fertility tends to be higher in developing countries because mortality among young people tends to be higher.
Life expectancy
The average number of years that an infant born in a particular year in a particular country can be expected to live, given the current average life span and death rate in that country.
Infant mortality
The number of deaths of children under 1 year of age per 1,000 live births.
Child mortality
The number of deaths of children under age 5 per 1,000 live births.
Immigration
The movement of people into a country or region, from another country or region.
Emigration
The movement of people out of a country or region.
Crude birth rate (CBR)
The number of births per 1,000 individuals per year.
Crude death rate (CDR)
The number of deaths per 1,000 individuals per year.
Net migration rate
The difference between immigration and emigration in a given year per 1,000 people in a country.
Doubling time
The number of years it takes a population to double.
Malthusian theory
Theory human population grows much faster than our ability to produce food. Proposed by Thomas Malthus in 1798, the theory warns that if population growth is left unchecked, we will eventually run out of food, leading to widespread famine, war, and disease.
Family planning
The practice of regulating the number or spacing of offspring through the use of birth control.
IPAT equation
An equation used to estimate the impact of the human lifestyle on the environment: Impact = population × affluence × technology.
Urban area
An area that contains more than 385 people per square kilometer (1,000 people per square mile).
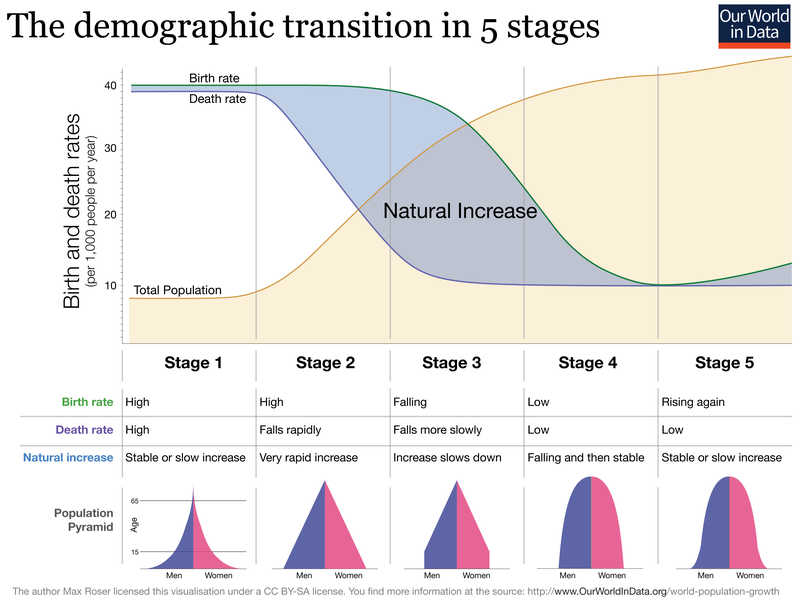
Theory of demographic transition
The theory that as a country moves from a subsistence economy to industrialization and increased affluence it undergoes a predictable shift in population growth.
Developed country
A country with relatively high levels of industrialization and income.
Developing country
A country with relatively low levels of industrialization and income.
Affluence
The state of having plentiful wealth including the possession of money, goods, or property.
Phase 1: Pre-Industrial
Slow population growth because high birth rates and high death rates which offset each other.
Phase 2: Transitional
Rapid population growth because birth rates remain high but death rates decline because of better sanitation, clean drinking water, availability of food and health care.
Phase 3: Industrial
Stable population growth as the economy and educational system improves and people have fewer children.
Phase 4: Post-Industrial
Declining population growth because the relatively high level of affluence and economic develop encourage women to delay having children.