8 - Island Biogeography
 Call Kai
 Learn
 Practice Test
 Spaced Repetition
 Match
 Flashcards
 Knowt Play
1/20

There's no tags or description
Looks like no tags are added yet.
21 Terms

explain
This slide illustrates the Species-Area Relationship (SAR), a foundational concept in biogeography that shows how the number of species increases as the size of a geographic area grows.
Specifically, it demonstrates how true oceanic islands have a much steeper rate of species accumulation (\(z\)-slope) than patches of mainland.
The \(z\)-slope is a measure of isolation. The more isolated an ecosystem is (like the Galapagos or West Indies), the steeper its \(z\)-slope will be because small areas cannot maintain populations without continuous immigration from a mainland.

explain
how is thi applying the SAR concept
This graph applies the Species-Area Relationship specifically to a classic ecological study of ant species in New Guinea, contrasting how biodiversity scales within a continuous mainland versus scattered offshore islands.
Because both axes are on a logarithmic scale, the standard curved power law relationship appears as straight lines.
📉 The Two Lines Explained
1. The Mainland Line (Top Line: "Cumulative Fauna")
This line tracks the number of ant species found when sampling increasingly larger, connected plots of land inside the main island of New Guinea.
The Trend: The line has a gentler slope.
The Reason: Continuous landmasses benefit from high connectivity. Even a small plot of mainland jungle is constantly visited by "transient" ant species wandering in from neighboring areas. Because of this continuous immigration (the rescue effect), you find a high baseline number of species even in smaller areas, causing the line to start high and rise slowly.
2. The Islands Line (Bottom Line: "Insular Fauna")
Each dot represents a distinct, isolated offshore island surrounding New Guinea, plotted by its total size and total ant species count.
The Trend: The line has a steeper slope.
The Reason: Isolated islands suffer from a lack of immigration. If a population of ants dies out on a remote island, there are no neighboring populations to automatically replace them. This pushes the baseline species counts down dramatically, especially for smaller islands.
🛑 The Red Arrows & The "8%" Gap
The vertical red arrows highlight the island diversity deficit—the massive gap in species richness between an island and a piece of mainland of the exact same size:
The 8% Rule: The notation at the bottom-left shows that a small, isolated island holds only about 8% of the species that you would find in an identically sized plot of land on the continuous mainland.
Divergence: As the area increases (moving to the right), the gap between the two lines narrows slightly because larger islands have lower extinction rates and more habitat varieties, but they still remain consistently lower in diversity than the connected mainland.
💡 The Big Takeaway
An acre of land on an island is not ecologically equal to an acre of land on a continent. Isolation acts as a severe filter on biodiversity, meaning fragmented or isolated habitats will always hold far fewer species than continuous, unbroken ecosystems.

explain
whydo islands hold more species at a bigger area
This graph shows the Species-Area Relationship (SAR) for island bird communities, demonstrating a clear, positive linear trend when plotted on a log-log scale.
📊 Breaking Down the Graph
The Horizontal Axis (X-axis): Represents the land area of the island in square kilometers (\(km^{2}\)), scaling logarithmically from tiny islands (\(5\text{ km}^2\)) to massive islands (\(1,000,000\text{ km}^2\)).
The Vertical Axis (Y-axis): Represents the number of unique bird species found on each island, ranging from fewer than 5 to over 500 species.
The Red Line: The linear regression line showing that as island area increases, bird species richness increases predictably.
💡 Why This Pattern Occurs
According to the Theory of Island Biogeography, larger islands hold more species due to two main forces:
Lower Extinction Rates: Larger islands can support much larger population sizes for each species. Larger populations are more stable and far less likely to be accidentally wiped out by a single bad storm, disease, or food shortage.
Higher Habitat Heterogeneity: A tiny island might only have a beach and a few shrubs. A massive island can have mountains, rivers, valleys, and dense forests. This physical complexity creates a wide array of distinct micro-niches for different bird species to fill.
🗺 The Role of Distance ("<300km from mainland")
The legend specifies that all these data points are islands located relatively close to a continent (less than 300 km away).
In island biogeography, islands close to the mainland have high immigration rates because birds can easily fly across the short water barrier. This high stream of new arrivals keeps the overall species numbers across all these islands elevated compared to extremely isolated, remote islands in the deep ocean.


what r the differences between island and mainland communities, list 2
ecological disharmony
higher extinction on islands

explain ecological disharmony
they suffer from ecological disharmony because they have non-representative proportions of species
Rule 1 (Arrival): Colonization favors species with good dispersal (easy travelers like birds or wind-blown seeds).
Rule 2 (Predators): Predators are usually absent on small islands.
Rule 3 (The Blank/Missing Point): If you are trying to fill in the
?????, a common companion concept in island biogeography is that niche spaces remain empty, or islands have a lack of competition.The Result: A higher extinction rate due to small population sizes.
Usually predators are missing from small islands
The Big Predators: Notice that Wolves dominate the top half of the list (Jasper, Wisconsin, Isle Royale, Algonquin, Arctic).
The Densest Predator Zone: Ngorongoro Crater, Tanzania (Hyenas) has the highest density of predators by far (440 individuals per 100 square miles).
The Ratios:
Look at the Predator-Prey Biomass Ratio column on the far right.
Notice that the ratios range from 1:45 (Ngorongoro Crater) to 1:900 (California Mountain Lions).
This shows that a huge mass of prey is required to support a small mass of top predators (the classic ecological pyramid).

explains
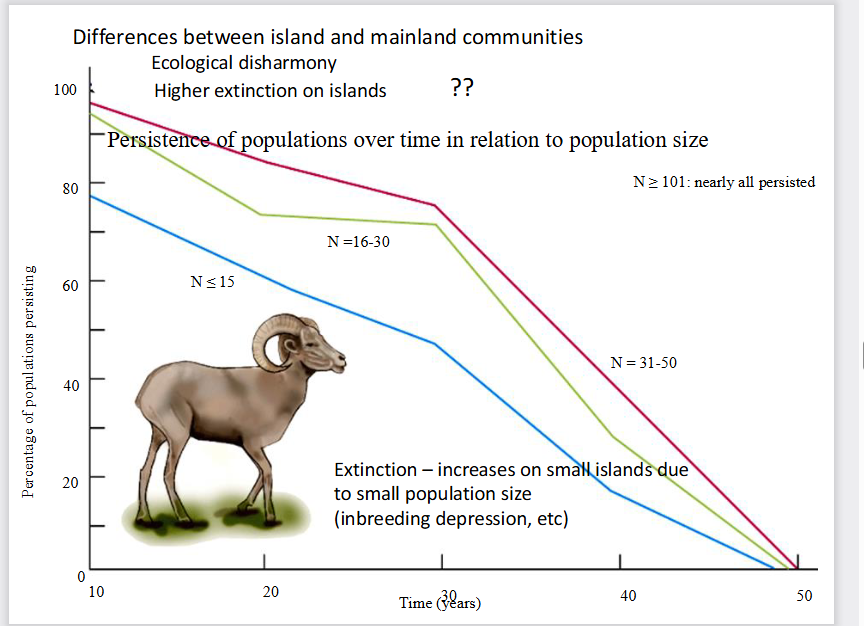
prove that smaller populations die out much faster over time.
Why do small populations on islands go extinct so fast?
The Cause: Small population size leads to biological vulnerabilities.
The Keyword: Inbreeding depression. (When a population is tiny, animals mate with close relatives, causing genetic defects and weakening the species over generations).
explain
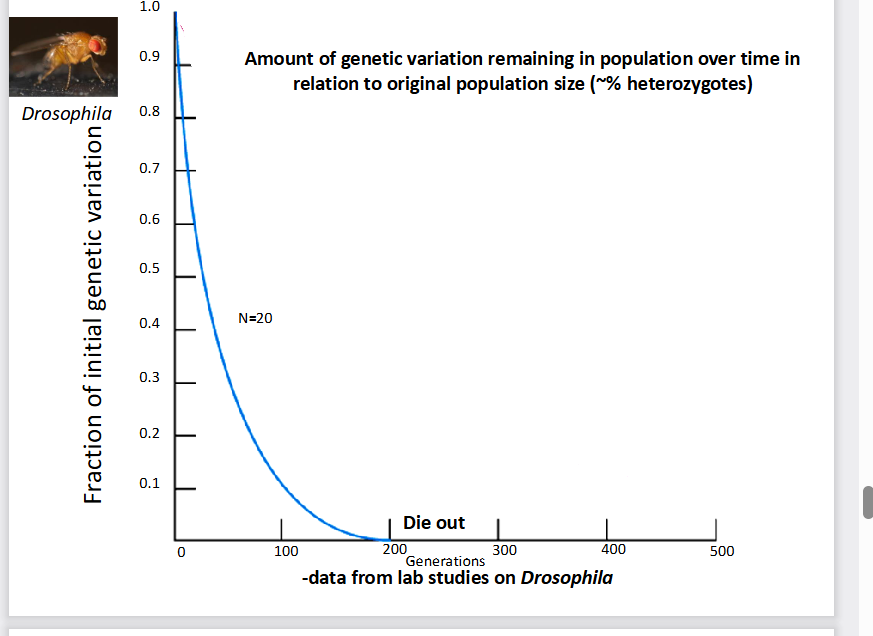
This slide provides the genetic proof for why small populations die out. It shows that when a population is small, it rapidly loses its genetic diversity over generations, leading to total collapse.
The Main Metric: The graph measures heterozygosity (the fraction of initial genetic variation). Having high genetic variation is an animal's armor against disease and changing environments.
The Finding: In a small population of just 20 fruit flies (\(N=20\)), genetic variation doesn't just decline—it plummets exponentially. By generation 200, variation hits 0, and the population completely dies out.
This experiment with Drosophila (fruit flies) illustrates two key conservation concepts:
Genetic Drift: In a tiny population (\(N=20\)), alleles (genes) are lost purely by random chance because fewer individuals are passing them down.
The Inbreeding Loop: As genetic variation drops to \(0\), individuals become genetically identical clones of one another. This locks in harmful mutations, resulting in the population crash labeled "Die out".

explain
whats the Theory of Island Biogeogrpahy
formula
This image illustrates the core principles of the Theory of Island Biogeography, which explains how an island's distance from the mainland and its physical size determine how many species can live there.
1. Panel 1: The Distance Effect (On Colonization)
The Rule: Islands closer to the mainland get more species.
Why: Travel is hard. Animals and seeds traveling from the mainland are much more likely to randomly hit and successfully settle on a nearby island than a far-away one.
Visual clue: The close island has three incoming arrows (high immigration), while the distant island only gets one.
2. Panel 2: The Area Effect (On Colonization)
The Rule: Larger islands get more species.
Why (The "Target" Analogy): A giant island acts like a huge bullseye in the ocean. It is physically easier for migrating birds, floating seeds, or storm-blown insects to accidentally hit it compared to a tiny speck of land.
Visual clue: The massive island acts as a big shield capturing four incoming species arrows, while the tiny island only catches one.
3. Panel 3: The Area Effect (On Extinction)
The Rule: Smaller islands suffer higher rates of extinction.
Why (Tying it back to your previous slides): Large islands offer more food, more varied habitats, and can hold large populations. Small islands have limited resources, resulting in tiny populations that quickly succumb to inbreeding depression and random disasters.
Visual clue: On the small island, half the species went extinct (the purple bird is crossed out). On the large island, only a small fraction went extinct (only the green bird is crossed out).
🧠 The Ultimate Summary Formula
Immigration (Who arrives): Controlled by Distance (Close = High) and Size (Large = High).
Extinction (Who dies out): Controlled by Size (Small = High Extinction).

whats this
what does each line represent
what does the yellow point represent
what does P represent
its the MacArthur and Wilson´s Equilibrium Model of Island Biogeography
It shows how an island reaches a dynamic balance (equilibrium) where the number of species becomes stable because new species arrive at the exact same rate that old species go extinct.
The Blue Line (Colonization Rate): Slopes Downward
When an island is empty (0 on the X-axis), any arriving species is new, so the colonization rate is at its highest.
As more species pack onto the island, the chance that an arriving creature is a new species drops.
Once the island has every single species from the mainland pool (P on the X-axis), the rate of new colonization drops to 0.
The Pink Line (Extinction Rate): Slopes Upward
When there are no species on the island, extinction is 0.
As more species fill up the island, competition for food and space intensifies, population sizes get smaller, and inbreeding depression kicks in.
Therefore, the more species present, the faster they die out.
2. The Golden Intersection: Equilibrium (\(\^{S}\))
The Takeaway: The yellow circle (\(\^{S}\)) is the equilibrium point.
The Balance: At this exact point, Colonization Rate = Extinction Rate.
Dynamic Stability: The specific species on the island will constantly change over time (called "turnover"), but the total number of species will stay steadily locked right at \(\^{S}\).
3. The Boundary Point (\(P\))
The Maximum Limit: P represents the total number of species living on the mainland source pool.
An island can never naturally have more species than P because there are no other species left to migrate over.

what does the rate at which new species arrive depend on?
what does the rate at which species die out depend on?
what are the 4 types of islands?
1. Immigration Curves (Red Lines = Distance Effect)
The rate at which new species arrive depends entirely on how isolated the island is from the mainland source pool:
Near islands: Located at the top red lines. Proximity makes travel easy, resulting in high immigration rates.
Far islands: Located at the bottom red lines. Extreme isolation acts as a barrier, resulting in low immigration rates.
2. Extinction Curves (Blue Lines = Size Effect)
The rate at which species die out depends on the area and resources available on the island:
Small islands: Located at the highest blue curves. Tiny habitats lead to small population sizes, resource depletion, and inbreeding, causing extinction rates to spike.
Large islands: Located at the lowest blue curves. Ample space and diverse resources support robust populations that easily resist extinction.
3. The 4-Tier Biodiversity Ranking
By looking at where the red lines intersect the blue lines, you can rank the four types of islands by how many species they can hold (from most to least):
Near + Large: Highest species diversity. Many species arrive and very few die out. The equilibrium point sits on the far right of the graph.
Near + Small: Intermediate diversity (high arrival but high extinction).
Far + Large: Intermediate diversity (low arrival but low extinction).
Far + Small: Lowest species diversity. Hard to reach and impossible to sustain life long-term. The equilibrium point sits on the far left.

explain
whats the equlibrium theory?
what can it and cant predict
whats Sfs and Snl
This slide highlights the three essential features of Equilibrium Theory overlaying the complete MacArthur-Wilson graph. It details exactly what happens once an island stabilizes and what this theory can (and cannot) predict.
he Rule: The total number of species on any given island naturally moves toward a steady balance point (equilibrium).
The Driving Variables: This specific balance point is strictly determined by a combination of two things: island area (size) and distance from the mainland.
The island experiences a high species turnover rate. Old species are continuously going extinct at the exact same rate that completely new species arrive and colonize.
What it CAN predict: The mathematical model can accurately forecast the total number of species (\(S\)) that can live on the island.
What it CANNOT predict: The model cannot tell you the exact species composition. It cannot predict which specific species (e.g., whether it will be a blue jay or a cardinal) will make up that number.
The graph highlights the two absolute extremes of the model on the X-axis:
\(\^{S}_{fs}\) = Far + Small Island: The intersection of the lowest immigration line (Far) and the highest extinction curve (Small). This produces the lowest total number of species.
\(\^{S}_{nl}\) = Near + Large Island: The intersection of the highest immigration line (Near) and the lowest extinction curve (Large). This produces the highest total number of species.

whats this
This image represents the famous real-world field experiment that tested and proved the MacArthur-Wilson Theory of Island Biogeography. [1]
It shows the pioneering mangrove island experiment conducted in the Florida Keys by ecologists Daniel Simberloff and Edward O. Wilson. [1, 2]
What is happening in the images?
The Top Picture: Shows a natural, untouched red mangrove islet. These small, isolated clumps of trees act as miniature "islands" in shallow water, completely cut off from the mainland. [1, 2, 3]
The Bottom Picture: Shows the active experiment. The scientists built heavy construction scaffolding and wrapped giant plastic tents completely around several of these individual mangrove islands. [1, 2]
The Goal of the Experiment
Count the Bugs: First, the researchers thoroughly surveyed each island to record every single species of insect, spider, and arthropod living there. [1]
The "Defaunation" (Wiping the slate clean): After tenting the islands, they fumigated them using methyl bromide gas. This killed all the insects on the island without harming the mangrove trees. [1]
Watch Life Return: They removed the tents and watched how new insects from the mainland immigrated back over time. [1, 2]
This experiment proved that the theory works. Within less than a year, the insects recolonized the empty islands and reached a stable dynamic equilibrium. [1, 2]
Crucially, it proved the distance effect: the mangrove islands that were located closest to the mainland filled back up with species much faster than the ones far away. [1, 2]

explain WORK ON THIS
This graph shows the actual data from Simberloff and Wilson’s mangrove experiment, proving that islands return to their original species equilibrium at rates dictated by their distance from the mainland.

whats the tripartite model
This slide introduces the Tripartite Model of Island Biogeography, an expansion of MacArthur and Wilson's classic model that incorporates evolutionary processes over geological time.
While the classic model only looks at immigration and extinction, this 3D model adds speciation (evolution) as a third core process.
1. Bivariate (Classic) vs. Tripartite (Expanded)
Bivariate Model (Top Left): Operates on an ecological timescale. It focuses strictly on how island Area and Distance balance Immigration and Extinction.
Tripartite Model (Center): Operates on a geological timescale. It incorporates a third dimension: Speciation / Endemism (the vertical Z-axis). It illustrates that on very remote islands, the creation of unique, native species becomes more important than simple immigration.
2. Decoding the 3D Landscape (The 4 Quadrants)
The shape of the shaded 3D canopy shows where unique species are most likely to evolve based on the island's characteristics:
NS (Near + Small): Flat. High extinction rates due to small size, and high immigration due to proximity, meaning species don't stay isolated long enough to evolve into new forms.
NL (Near + Large): Low Plateau. While the large area protects species from going extinct, the island is too close to the mainland. A constant flood of new arrivals from the mainland floods the gene pool (called genetic swamping), preventing local speciation.
FS (Far + Small): Flat. Immigration is extremely low because it is far away. However, because the island is tiny, populations go extinct too quickly to ever have time to evolve.
FL (Far + Large): The Massive Peak. This is the zone of evolutionary radiation. Because the island is large, extinction rates are low enough for populations to survive for millions of years. Because it is highly isolated (Far), mainland species rarely arrive to disrupt them. This allows a single arriving ancestor to adaptively radiate into dozens of unique, endemic species (like Darwin's finches on the Galápagos).
Speciation and unique endemism do not happen equally everywhere. They reach a massive peak only on islands that are both highly isolated (Far) and physically large (Large), where populations are protected from both extinction and mainland genetic swamping over millions of years.

what should you know about this
Professors love pulling specific numbers from reading primers for multiple-choice questions. Memorize these two percentages:
3.5%: Islands make up a tiny 3.5% of global landmass.
15–20%: Despite being so small, islands harbor a massive 15–20% of all global terrestrial species on Earth.
High Endemism: Because islands are isolated, they contain large numbers of endemic forms (species native to that specific island and found absolutely nowhere else on Earth).
Cultural Parallel (Human Languages): Interestingly, the isolation that drives animal evolution also applies to human culture. More than 25% of all human languages are found on islands.
Threat of Extinction: Just as island languages are highly threatened, island ecosystems are exceptionally fragile. The text notes that the paper concludes with how anthropogenic (human-driven) environmental changes are rapidly driving unique island species to extinction.

a) both species feed on the same prey
b) d/w < 1
c) predators are absent from the habitat
d) d/w > 3
e) w/d > 1
d) d/w > 3

a) stochastic events are mos timportant during early seral stages
b) facilitation is a major process in early seral stages
c) successive seral stages last longer than the previous stages
d) inhibitation by established species can prolong a seral stage
e) the shoot to root ratio is highest in late seral stages
e) the shoot to root ratio is highest in late seral stages

a) 0.2
b) 0.5
c) 0.7
d) 0.9
e) 1,3


a) oxygen levels increase with depth due to the lower water temperatures which hold more oxygen
b) oxygen levels are highest in warm surface waters during summer daylight
c) the lowest oxygen levels occur in early winter immediately beneath the ice
d) eutrophic lakes have the highest oxygen levels during night-time
e) low oxygen levels are due to the absence of photosynthesis
b
The greatest species diversity of amphibians per sq km would most likely occur:
a) in forests with high temperatures and high rainfall
b) on islands with high spatial heterogeneity
c) on tropical offshore islands close to the mainland
d) in habitats with no seasonal differences in temperature
e) at the equator
A
what r the formulas for midterm 2
