Economic Issues, Demand and Supply
 Call Kai
 Learn
 Practice Test
 Spaced Repetition
 Match
 Flashcards
 Knowt Play
1/18

Earn XP
Description and Tags
ECON127 L1
19 Terms
What type of choice do customers make?
Rational - the most satisfactory option among alternatives based on preferences.
How do you make choices in economics?
Making choices involves evaluating available options based on preferences, COSTS, and BENEFITS to maximize satisfaction or utility. Also, trying to make the best use of limited resources.
What is opportunity cost?
What you give up for choosing something. The cost of one good measured in the terms of what we must sacrifice to consume.
What is the most efficient in an economy?
Maximising profit whilst minimising cost.
What is microeconomics?
Microeconomics is the branch of economics that studies the behaviour and decision-making of individuals, households, and firms in allocating scarce resources.
What is macroeconomics?
Studies the behaviour and performance of the economy as a whole. The collectives outcomes of individual interactions.
What is DEMAND and the LAW of DEMAND?
The relationship between quantity demanded and price.
The law of demand: negative relationship between the quantity demanded and price. Higher price = Lower demand.
Two effects that explains this law of demand
Income effect - The change in price affects consumers’ real income. (as prices rise then the real income would be smaller)
Substitution effect - price change affects the relative price of alternatives. (people are more likely to choose the cheaper alternatives if price is too high so therefore demand is lower)
Real vs Nominal Income
Nominal income - the income (£5 etc)
Real income - the goods and services you can buy with your nominal income (5 bottles of water)
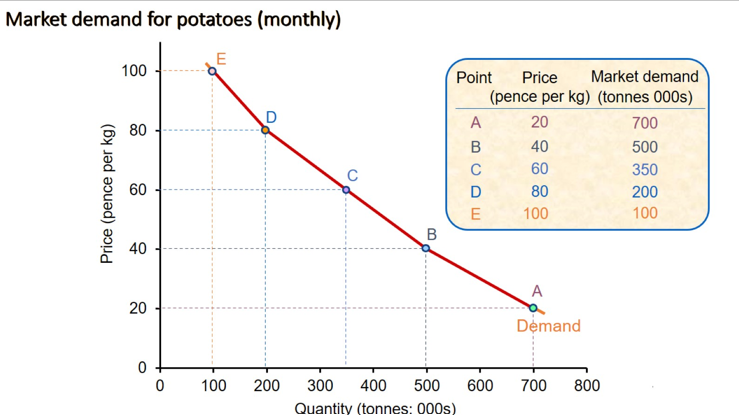
What does the demand graph/curve show and look like?
The axes - demand (x) and price (y)
How much is demanded at each price per item.
Other reasons for a higher/lower demand
tastes
number and price of substitute goods
number and price of complementary goods
income
distribution of income
expectations
The movements along and shifts in the demand curve
ALONG the curve - change in price ( up or down )
SHIFT in curve - change in any other determinants (increase in demand (right), decrease in demand (left))

What is SUPPLY?
the relationship between supply quantity and price.
as selling price rises, firms supply more as it is worth getting more units, develop a business, switch to better quality, more firms entering the market.
What does the supply graph/curve show and look like?
the axes - supply (x), price (y)
positive relationship
how much would be supplied at each selling price

Other reasons for a higher/lower supply
costs of production
profitability of alternative products
profitability of goods in joint supply
nature and other random shocks
expectations of producers
The movements along and shifts in the supply curve
ALONG the curve - change in price ( up or down )
SHIFT in curve - change in any other determinants (increase in supply (right), decrease in supply (left))

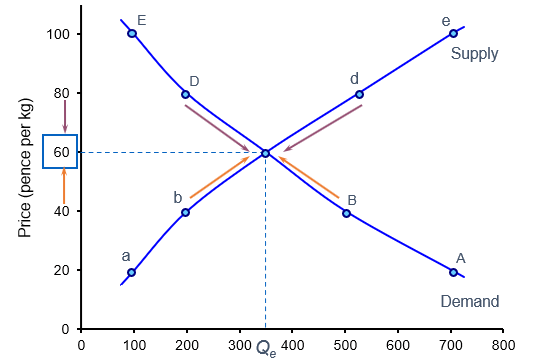
Determining the price of goods
At equilibrium of supply and demand - no surplus/ shortage (intersection of both curves)
When above equilibrium - surplus so price falls
When below equilibrium - shortage so price rises
The effects of shifts in the DEMAND curve
the movement along the SUPPLY curve creates a new DEMAND curve
rise in demand (right) - price rises
fall in demand (left) - price falls

The effects of shifts in the SUPPLY curve
the movement along the DEMAND curve creates a new SUPPLY curve
rise in supply (right) - price falls
fall in supply (left) - price rises
