IB 150 Content 1.1-1.8 (Unit 1 study guide)
 Call Kai
 Learn
Learn Practice Test
 Spaced Repetition
 Match
Match Flashcards
 Knowt Play
1/82

There's no tags or description
Looks like no tags are added yet.
Name | Mastery | Learn | Test | Matching | Spaced | Call with Kai | Chat |
|---|
No analytics yet
Send a link to your students to track their progress
83 Terms
Gibbs free energy
measures whether a chemical or physical process is thermodynamically nonspontaneous (endergonic) or spontaneous (exergonic)


Delta G: change in gibbs free energy
G>0 (positive G) external energy is required for reaction to occur (exergonic)
G<0 (negative G) no external energy is required for reaction to occur
Endergonic
Nonspontaneous: no external energy input is required
Exergonic
Spontaneous: an input of external energy is required (input of free energy)
Delta H
Represents change in enthalpy of a system/ change in total energy within a system
Enthalpy
total energy within a system
Exothermic
Delta H<0 (delta H is negative) system releases heat to it’s surroundings
Endothermic
Delta H>0 system absorbs heat from its surroundings when delta H is positive
T (of Gibb’s free energy equation)
represents temperature in kelvin
Delta S (of gibb’s free energy equation)
measures change in entropy of a system. measures change of disorder within a system Delta S is positive more disorder Delta S is negative means less disorder
H as a variable (related to delta H)
H measures positional energy related to charges (measures potential energy) ask yourself how strong are the bonds
How can you determine potential energy by looking at molecular compounds
How strong are the bonds of the molecules (what bonds will release the most energy)
Energy
The capacity to induce change
1st law of thermodynamics
Energy cannot be created nor destroyed only transferred
Second law of thermodynamics
total entropy/disorder of an isolated system will always increase over time due to spontaneous processes (remember there is only endergonic and exergonic and endergonic will not change entropy)
Entropy
Measures degree of disorder
What processes are more energetically favorable and why?
Exergonic processes because they require an input of external energy which helps the universe move towards greater disorder which is why they are favorable (because they are spontaneous)
Exergonic (spontaneous) graph
releases free energy and delta G is negative when exergonuc
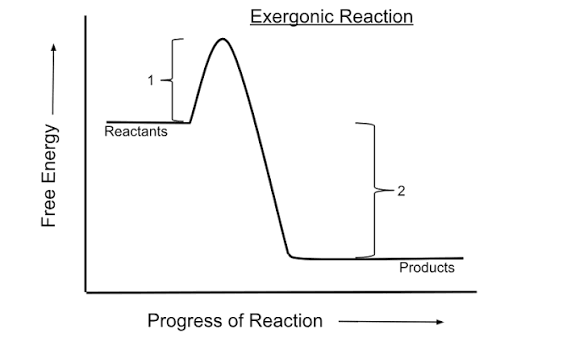
Endergonic reaction graph
Energy is absorbed and delta G is positve

Exponential growth population model
delta N(1-0)/delta t= r(N0) Calculates rate of change over time
Exponential equation variables: Delta N(1-0)/Delta t
calculates the rate of population change over time
Exponential equation variables: r
r: growth rate per capita/individual growth rate
Exponential equation variables: N0
N0: initial population
what does r represent in the exponential growth model
r=b-d (rate of population change= births-deaths)
how is r calculated
r= delta N(1-0)/N0 (change in population/initial population)
what occurs when the r variable is constant
exponential growth will continue to occur over time
logistic growth population model
delta N(1-0)/delta t= N0(r-max)((K-N)/K)
How does the logistic growth model differ from the exponential growth model?
The portion of (K-N)/(K) accounts for carrying capacity limitations on the rate of growth
r-max
the maximum growth rate when carrying capacity is accounted for
K
carrying capacity
N
Population
K-N/K
when the graph begins to decrease and have a horizontal asymptote it is reaching its limit by the carrying capacity
carrying capacity
maximum amount of individuals that can be supported by limited resources
ecology
the study of living organisms and their interactions with their abiotic environment
how does energy flow in the ecosystem
sun, plants, herbivores, carnivores (loss of energy should be accounted for) also detritivores exist in this system
size of different energy pools
1) plants 2)herbivores 3) carnivores (energy pools become increasingly smaller because of energy loss
10% rule
from one trophic level to the next only 10% of energy is withheld and the other 90% is lost which is why the energy pools shrink
10% rule applied to energy pools
sun 100% plants 10% herbivores 1% carnivores 0.1%
thermoregulation strategies
how do animals maintain a certain body temperature required for survival
homeotherms: maintain a constant body temperature'
poikilotherms: have varied body heat
endotherms
produce their own body heat through chemical reactions (endotherms have a faster metabollism because they need to generate their own body heat.
ectotherms
rely on heat in their surroundings to maintain their body temperatures
receive heat from radiation and conduction
how do energy expenditure of ectotherms and endotherms vary?
endotherms:
1) majority of energy is used for cellular respiration to maintain body heat (~75%)
2) ~8% of energy is used biomass egestion and excretion
ectotherms
1) only around ~50% of energy is utilized for cellular respiration
2) the other 50% is used for biomass excretion and egestion
biomass
renewable energy that comes from plants and animals
excretion
the ways in which organisms eliminate metabollic waste (getting rid of the byproducts of chemical reaction)
egestion
elimination of indegistable compounds
exothermic trophic levels
exothermic trophic levels have less energy loss because they do not perform as much cellular respiration (exotherms have a higher ecological efficiency) therefore there is more energy available at each of the trophic levels
r- strategists
maximize amounts of birth by using energy expenditures
K- strategists
lower birth rate lower death rate they use energy to provide stability to reduce death rate
r-strategists vs K-strategist

r-strategist graph
higher tendency to overshoot K (carrying capacity)

K strategist graph
less likely to overshoot carrying capacity because of lower birth rate

why are all species not K-strategists
when predation is a contributing factor higher reproduction rate of r-strategists allow the species to exist in a larger population
when can K-strategists overshoot their carrying capacity
environmental degradation that limits resources
when does the overshooting of the carrying capacity occur
carrying capacity decreases
very high r-max due to high birth rates
exploitative competition
when resources are limited and species are in indirect competition by utilizing resources through consumption
interference competitition
active mechanisms to acquire and defend resources
ecological niche
the role a species inhabits in the environment and what it can and cannot tolerate (food size, environment temp)
niche graphs
shows optimum range of tolerance of environmental variables expressed as what K (carrying capacity can be achieved at different values of an environmental variable
niche graphs with the same optimum but one has a lower K
graph with higher K will always outcompete the species that has a lower K because they are more energetically efficient within their ecological niche
how do competing species coexist
1) their niches do not completely overlap
2) the environment they exist within is variable enough to the point where they can outcompete eachother of certain ranges
fundamental niche
the actual range of tolerance of a species not taking into account how competition alters this
realized niche
the contraction of a niche based on competition and where they actually exist
niche differentiation
reduction of overlap between competition due to intense competion for resources
predation and competitive exclusion
predation decreases competition between herbivorous species by putting them below their carrying capacity making resources more available to the species that are surviving within the population
pronounced predator prey cycles (rare)
as prey decreases predators increase and vice-versa
predator prey cycles
predators remain stable while prey populations fluctuate but multiple prey are taken into account
Predators…
do not get as much prey when the prey are hiding
population growth is diminished due to predation cycles
predation can prevent competitive exclusion
top down trophic cycle
predators influence the amount of energy available at different levels due to consumption
bottom up trophic levels
energy levels based on loss and energy available determines the amount of energy at different levels
how does predation support biodiversity
predation supports biodiversity by decreasing competition allowing more populations to live below their carrying capacity in their environment
commensalism (+/0)
one species benefits from this type of interaction and the other species is not impacted in any way
competition (-/-)
both species do not benefit from this interaction and population decreases because of this
consumption (+/-)
one species eats another
mutualism (+/+)
when both species interact in a way that they are both benefitted
what is the difference between non-living and living matter
living matter requires and input of energy
7 properties all living organisms have
cells
grow and reproduce
genetic information processing'
energy
evolution
maintaining homeostasis
adapting to their environment
what is the purpose of energy
to supply reactions with fuel to maintain homeostasis
density dependent
factors occurring within a population that impact the growth/ population size
examples: disease, predation, competition, buildup of waste in crowded communities
density independent factors
factors that limit the population regardless of how crowded or sparse the population is
example: natural disasters / environmental change (typically abiotic)
how does diffusion relate to the second law of thermodynamics
the particles move from higher order to more disorder and total enthalpy of system delta h is equal to zero
what happens when molecules within a system are distributed evenly
equillibrium is reached and molecules will continue to diffuse at equal rates and net flow=0
ranked medium categories
gas
liquid
living cells
dead cells