PA - Infrastructure (SPDH, Ch 8)
 Call Kai
 Learn
 Practice Test
 Spaced Repetition
 Match
 Flashcards
 Knowt Play
1/102

There's no tags or description
Looks like no tags are added yet.
103 Terms
Low-Impact Design
<Storm water & Sewage disposal>
collecting the storm water or sewage, concentrating the various flows, and removing them from the site in the most expedient and cost-effective way possible.
a move toward green infrastructure is well under way. The combined strategies being employed are referred to as low-impact design or green infrastructure.
water is considered a resource rather than a problem.
interaction with the environment is carefully weighed to maximize total benefits and minimize costs.
Strategies include:
design of vegetated swales
infiltration structures
rain gardens
green roofs.
Green infrastructure integrates natural services such as
infiltration
microbiotic activity in soils
the diversity of stable ecosystems
the implications of site development to create a win-win situation.
Benefits of a green infrastructure:
increased infiltration and groundwater recharge
decreased pollution loads on surface water
increased biodiversity,
reduction in the heat island effects of development
improved air quality
particular emotional benefits ranging from a better learning environment to a heightened sense of personal happiness.
green infrastructure designs
minimize the disturbed area and maximize retention of native plant communities.
Lawn areas are minimized if they are used at all, and landscape areas employ means for capturing storm water to increase infiltration and groundwater recharge. Use of native plants reduces the need for irrigation and toxic landscape supplements.
Source: SPDH, p. 263
Storm Water Management
<Storm water & Sewage Disposal>
As site work progresses and the natural characteristics and irregularities of the site are graded and removed, the volume and velocity of storm water runoff is increased.
In the recent past the solution for this change in runoff has been to concentrate the runoff into pipes and convey it to the most convenient point of discharge.
Habitat quality in streams drops significantly once a watershed reaches 10 to 15 percent imperviousness, and stream habitat is consistently found to be poor.
As the impacts of site development are better understood, the methods and practices of design and construction must evolve to address these impacts. Storm water management is a critical element in this evolution toward a sustainable site design practice.
storm water is an important resource, not a problem.
nonpoint source pollutants (NPS)
Pollutants from such sites include nutrients, sediment, bacteria, oil and grease, heavy metals, chemicals, and pesticides are washed into the system and ultimately into the stream.
Construction sites over an acre in size must address discharge from a site, and large developments and municipalities must acquire an NPDES permit to discharge storm water. For the most part these regulations are enforced by the individual states.
Source: SPDH, p.263-264

Storm water runoff from Parkin Lots and treets
<Stormwater & Sewage Disposal>
pollution from storm water runoff from parking lots and streets is much greater than the pollution from factories and sewage treatment plants (Table 8.1).
Storm water that is directed across paved surfaces and collected into gutters and pipes convey runoff at a velocity that scours the surface and washes the pollutants along in the runoff.
If the amount of paving and roof surface is reduced, the amount of runoff increase can be reduced. However, without paving and roof, and if retaining all of the storm water was required, there probably would be no project.
Development and environmental protection can coexist. Sites designs must use more effective and sustainable strategies. Instead of addressing storm water as a problem, designers must see it as a resource. Many effective strategies are familiar and cost effective (Table 8.2).
Source: SPDH, p.264-265

Dry wells vs Dry swales
Dry wells:
Dry wells provide very limited water purification.
While they physically filter out coarse sediments and debris trapped at the inlet, they lack biological or chemical treatment mechanisms. Water-soluble pollutants (such as salts, dissolved nutrients, and pesticides) pass directly through the gravel and soil matrix, posing a minor contamination risk to the local groundwater table .
Efficient only for draining small tributary areas (e.g., a single residential roof plan).
They are entirely dependent on the permeability/porosity of the immediate in-situ soils. In tight clay soils or during extended wet weather, the dry well can easily fail or back up because the receiving soils become saturated and cannot drain the storage cavity between rain events.
It is designed to receive concentrated point-source runoff delivered vertically and directly via a pipe—most commonly a roof downspout, leader, or foundation drain.
Water enters the top of the well and immediately fills the void spaces between the aggregates, where it is stored temporarily before slowly percolating outward into the surrounding soil.
Dry Swale:
categorized as highly effective Best Management Practices (BMPs) with excellent pollution removal capabilities (typically removing 91% of total suspended solids, 67% of lead, and up to 92% of total nitrogen).
Pollutant Fate: Runoff is purified through a combination of physical filtration, chemical absorption, and biological action. The vegetation slows the water velocity, allowing suspended solids to settle. Soil microbes degrade hydrocarbons, and metals are actively bound to organic materials within the topsoil and planting media.
Designed to handle larger site zones, such as entire parking lot modules or roadways.
Since dry swales can be connected to downstream storm sewer outfalls or retention basins via surface flow, they can still function as vegetated conveyance systems even if the local soils have low permeability.
It is designed to receive shallow, unconcentrated sheet flow from adjacent impervious surfaces (like roads, sidewalks, or parking lots).
Water moves horizontally down the gently sloped sides of the swale. It is designed both to infiltrate low-flow frequent storms and to safely convey the high-volume flows of large, infrequent storms down its length. Swales are calculated with at least 20% "freeboard" to prevent overtopping during these major events.
Source: Notebook LM

Effective and Cost effective strategies for storm water management
<Site drainage / infrastructure>
Source: SPDH, p. 265

The Rational method estimating Peak Runoff
<Site drainage / infrastructure>
The rational method uses the area of the basin, a runoff coefficient, and the intensity of a selected design storm to determine peak discharge:
Q = CiA
where:
Q = peak discharge in cfs
C = runoff coefficient (a ratio of the amount of surface runoff to rainfall)
i = rainfall intensity for a storm duration equal to the time of concentration (TC)
A = area of the basin (or subshed)
Runoff coefficients (C) are selected from charts like the one shown for the rational method in Table 8.4 and are based on the conditions found at the site. Composite or weighted C values are calculated by multiplying the area of each type of ground cover by the appropriate C factor, adding the results, and dividing the sum by the total land area (A).
Source: SPDH, p. 265, 266, 268

Time of Concentration (TC)
<Site drainage / Infrastructure>
TC is the length of time required for a drop of water to travel from the furthest hydrologic point through a completely saturated drainage area to a point of discharge.
is a function of the slope of the land, surface roughness, and type of flow (sheet or concentrated).
Find the longest hydrologic flow path—if appropriate, subdivide the path into sections of different conditions (forest, paved surfaces, lawns, etc.)—and calculate the velocity along the path using this formula:
where t = travel time
L = length of the flow path
v = velocity from Manning’s formula or from a prepared chart
Source: SPDH, p. 266
Travel time for sheet flow
<Site drainage / Infrastructure>
t = 0.007(nL)0.8/(P)0.5s0.4
where t = travel time, hours
n = Manning’s coefficient of roughness
L = flow length, feet
P = design storm 24-hour rainfall, in inches
s = average slope of surface
Source: SPDH, p. 266
Rainfall Charts
<Site drainage / Infrastructure>
always best to use recent local rainfall charts. Agencies may provide rainfall intensity charts as well.
It should be noted that rainfall intensity charts are not the same as total precipitation or duration charts.
Rainfall intensity specifically refers to a storm with duration equal to the rational method time of concentration.
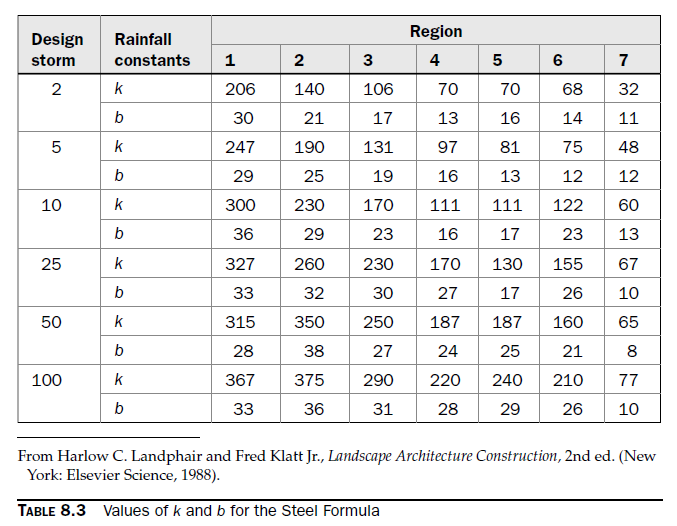
Rainfall intensity is at least a regional calculation determined using the Steel formula:
= k/(t + b)
where i = rainfall intensity
k = rainfall coefficient
b = rainfall coefficient
t = travel time
The rainfall coefficients k and b are statistical constants developed for regions for storms of different frequencies (Table 8.3). In recent years the Steel formula rainfall coefficients have been shown to be somewhat less reliable in western states (Fig. 8.1).


Steel formula for calculating Rainfall Intensity
<Site drainage / infrastructure>
i = k/(t + b)
where:
i = rainfall intensity
k = rainfall coefficient
b = rainfall coefficient
t = travel time
The rainfall coefficients k and b are statistical constants developed for regions for storms of different frequencies (Table 8.3). In recent years the Steel formula rainfall coefficients have been shown to be somewhat less reliable in western states (Fig. 8.1).
Source: SPDH, p. 268
Design of open channels and pipes
<Site drainage / infrastructure>
the design of open channels and pipes are similar in that both may be determined using Manning’s formula:
Q = [(1.49/n)(a/p)2/3(s)1/2]/a
Source: SPDH, p. 268
Strategies in Arid Areas for storm water management
<Site drainage / infrastructure>
Even though rainfall depths are much less, arid (less than 15 in. of rain) and semiarid (15 to 35 in. of rain) areas have a much greater pollutant load for each storm event and may experience substantially greater sediment loads due to the lack of stabilizing vegetation. The drier areas also are more concerned with groundwater quality due to the high pollution loads and permeability of some western soils. Pollution prevention is a critical part of storm water strategies in these areas, and street sweeping and drain cleaning are important activities.
wet ponds are desirable in areas with surplus moisture but are impractical in drier climates. However, sand filters, filter strips, and bioretention are still important tools. Key elements in storm water design in these areas minimize ground water pollution, channel erosion, and encourage infiltration (Fig. 8.4).
Source: SPDH, p. 268


Swales
<Site drainage / infrastructure>
Vegetated swales are important tools in implementing a sustainable storm water strategy.
Vegetated swales encourage infiltration, filter water by providing many surfaces for deposition, and reduce the velocity of water.
The swale infiltration system increases the capacity of the typical swale to allow infiltration of low flow, frequent storm events.
It can also convey the flow of large infrequent storms, which could not be easily infiltrated through the soil.
The design of channels is accomplished using Manning’s formula (Table 8.6).
The choice of the coefficient of roughness is the critical step in using the equation (Table 8.7).
Source: SPDH, p. 270


Cost of Swales
<Site drainage / infrastructure>
Swales remain the choice of conveyance systems because of their many positive aspects over pipes (Table 8.5). By using grass-lined swales instead of pipes, site costs can be reduced by as much as $12.00 a linear foot.
Adding the swale infiltration trap increases the cost by about $2.30 a linear foot, but because downstream piping and swale systems are smaller, a net savings is possible.
Swales are generally calculated to function with at least 20 percent of the depth as freeboard (Fig. 8.5). This allows for some retardance in the design flow due to vegetation or debris.
Generally a freeboard of at least 20 percent of the design depth, or 6 in. (15 cm), is used to protect against underestimates of the n value and roughening of the channel by vegetative growth and incidental obstruction or debris.
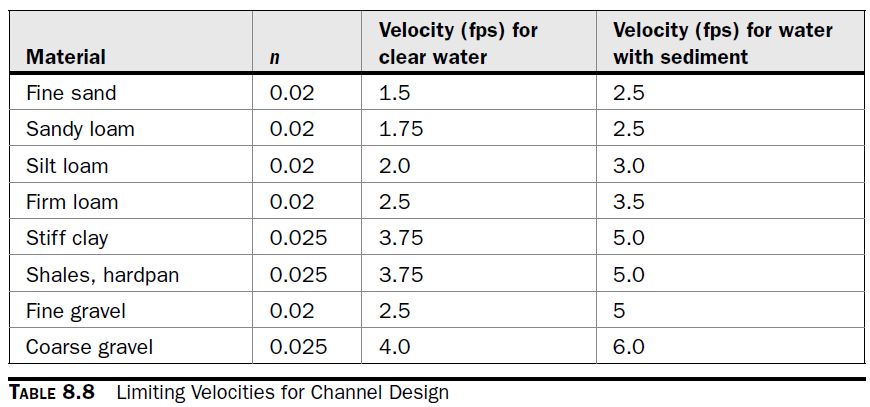
Designs for unlined channels are usually limited by either the velocity a channel will allow without suffering damage or the tractive force (Table 8.8). Trials of channel design should be tested using the formula V = Q/a, where velocity is a function of the quantity in cubic feet per second over the wetted area.
Source: SPDH, p. 270

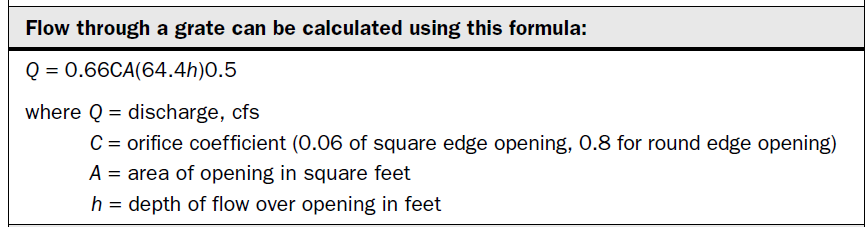
Flow through a grate - formula
<Site drainage / infrastructure>
Source: SPDH, p. 271
Geotextile fabric
<Site drainage / infrastructure>
In cases where velocity may exceed the recommended rate, it may be necessary to reinforce the channel using geotextile fabric.
Permanent fabrics designed to reinforce vegetated channels extend the designers’ choices significantly.
Some geotextiles can maintain the channel integrity and hold the vegetation in place even at velocities as great as 13 fps.
should be selected on the basis of their ability to resist the flow of moving water, to protect the channel surface, and to hold the vegetation in place.
Some geotextiles are designed to act as “armor”; that is, they cover the channel surface and protect it from the erosive force of flowing water much in the same way a concrete lining might be used (Fig. 8.6).
Other materials are three dimensional and are incorporated into the soil to act in concert with the roots of plants to mechanically resist erosion.
The permanence of the geotextile material is very important. Some materials are designed to bio- or photodegrade; others are intended to remain in place permanently.
In most cases swales must be installed to be in service immediately, even before the vegetation is established. This may require the use of temporary geotextiles until the vegetation can stabilize the channel.
Many failures of installed swales occur because the geotextile was not installed properly.
Source: SPDH, p. 273
Shape & Sinuosity
<Site drainage / infrastructure>
are critical factors in the hydraulic and environmental functions of a channel.
Shape refers to the cross-sectional configuration of the channel, and sinuosity refers to the length of a channel over a given distance.
Increasing the length of a channel within a given distance requires increasing the number and amplitude of curves within the distance. This increase in length allows a flatter slope over the same distance, which in turn results in slower velocities, less erosive capacity, and more infiltration. The channel can be designed to contain more water in high flow conditions and incorporate special high flow channels that operate in flood conditions.
The natural capacity for retention and treatment of water-borne contaminants can be increased by incorporating vegetation and pools in the channels. Careful selection of channel bottom media and plants will further enhance the environmental functions of storm water channels. Figures 8.7 and 8.8 show two types of infiltrators.
Source: SPDH, p. 273
Dry Swale (bioswale) vs Standard Grass Swale
Source: Notebook LM


Volume of flow in a channel
<Site drainage / infrastructure>
Source: SPDH, p. 271
Emergency spillway
<Site drainage / infrastructure>
Source: SPDH, p. 271

Rate of travel through the media - formula
<Site drainage / infrastructure>
Source: SPDH, p. 271


Swale infiltrator (traps)
<Site drainage / infrastructure>
not the same as bioswale
A swale infiltrator is a structural drainage enhancement built beneath a swale channel to facilitate groundwater recharge.
It consists of an excavated trench directly under the swale flow line that is lined with filter fabric and backfilled with coarse crushed stone or gravel aggregate .
Its main purpose is water quantity and recharge. It is designed to capture and temporarily store runoff from frequent, low-flow storm events underground so it can slowly percolate into the soil, keeping the surface of the swale dry and preventing standing water .
While it provides some biological treatment (bacteria and microorganisms can attach to the gravel media and act as a biofilter as water passes through), it does not have an engineered soil or plant root zone.
In cases where velcocity may exceed the recommeded rate, it may be necessary to reinforce the channel using goetextile fabric.
Some geotextiles can maintain the channel integrity and hold the vegetation in place even at velocities as great as 13 fps. ASTM has developed standards for testing geotextiles to provide users with a greater degree of certainty when specifying materials.
geotextiles cover the channel surface and protect it from the erosive force of flowing water much in the same way a concrete lining might be used (Fig. 8.6). Other materials are three dimensional and are incorporated into the soil to act in concert with the roots of plants to mechanically resist erosion.
The permanence of the geotextile material is very important. Some materials are designed to bio- or photodegrade; others are intended to remain in place permanently.
Source: SPDH, p. 273

Shape and sinuosity of a channel
<Site drainage / infrastructure>
Shape refers to the cross-sectional configuration of the channel
sinuosity refers to the length of a channel over a given distance.
Increasing the length of a channel within a given distance requires increasing the number and amplitude of curves within the distance.
This increase in length allows a flatter slope over the same distance, which in turn results in slower velocities, less erosive capacity, and more infiltration. The channel can be designed to contain more water in high flow conditions and incorporate special high flow channels that operate in flood conditions.
The natural capacity for retention and treatment of water-borne contaminants can be increased by incorporating vegetation and pools in the channels.
The swale infiltrator may be used to introduce a biological treatment to the storm water when this is desirable. The media for the swale may serve as a surface for bacteria and other microorganisms to attach to and may act as a biofilter for the storm water as it passes through.
The velocity of water through the media must be controlled to ensure sufficient contact time between the biological agents and the water. The actual time required is a function of the toxins and the ability of the specific biological agents to consume or act on them.
Determination of this will require some bench testing by a microbiologist. Once provided with the requirements, the site designer can design the swale accordingly.
Source: SPDH, p. 273 - 275

Groundwater Recharge
<Recharge>
The preferred method of storm water quality management is to reintroduce the runoff into the soil as quickly as possible to provide the opportunity for groundwater recharge.
Infiltration can be used for pollutant removal, but infiltration systems provide only limited cleansing.
When water soluble pollutants are a particular risk, the design must provide for a biological treatment such as algae in wet ponds or microorganisms in wetlands or in bioretention beds or rain gardens.
one of the reasons to consider infiltration is the loss of ground water recharge that accompanies a typical detention basin development.
By using infiltration systems where it is possible, the loss from storm water runoff can be significantly reduced. About 70 percent of the homes in the United States use groundwater, so protecting and managing our groundwater resources are important and necessary undertakings.
using soils as a filter medium, for example, in ground sewage disposal systems.
The Environmental Protection Agency (EPA) recommends a 2-to 4-ft vertical separation from the bottom of the infiltration facility to the seasonal top of the water table or bedrock.
Source: SPDH, p. 275
Four-point test to determine feasibility of infiltration
<Infiltration>
The soil texture is in a class with an infiltration rate that permits adequate percolation of collected water through the soil.
Soils with an infiltration rate of 0.17 in/h or less, or with a clay content of 30 percent
or more, may be unsuitable for infiltration (Table 8.9)
Ponding or dewatering time is at least three but no more than seven days.
allowable ponding time (Tp) or storage time (Ts).
Ponding and storage times should be kept to a reasonable minimum: 72 hours is a reasonable period to drain an infiltration structure.
A minimum vertical depth of 2 to 4 ft is available between the infiltration bed and bedrock or the seasonal high water table.
depth of an infiltration structure
d = f Tpwhere d = maximum allowable design depth
f = minimum infiltration rate
Tp = maximum allowable ponding time (surface storage)
maximum depth of an infiltration trench or dry well in which the storage is within a porous media such as stone ballast can be calculated as follows:
d = f Ts/Vr
where d = maximum allowable design depth
f = minimum infiltration rate
Ts = maximum allowable storage within subsurface storage
Vr = void ratio of aggregate reservoir
The site topography (slope) and the nature of the soil (fill, stability) will permit the location of foundations, utilities, wells, and similar site features.
The weight and motion of construction vehicles compresses the soil, closing pores and limiting the infiltration capacity of the soil. The infiltration surface must be protected, and heavy equipment should not be driven over the bottom of the system. Once the site is located, the infiltration area should be staked out and identified. Equipment should work from the side of the area while excavating the trench.
Methods adapted for infiltration include dry wells, swale traps, catch basin traps, infiltration trenches and basins, and rain gardens.
Source: SPDH, p. 275 - 276

Dry Wells
<Site drainage / infrastructure>
Dry wells are small excavated pits backfilled with aggregate in the same manner as an infiltration trench. The primary difference between the dry well and an infiltration trench is in how the water is collected into the system. Trenches are located parallel to the contours and extend along a certain point in the site to intercept runoff. The dry well is designed to collect runoff directly from a roof drain or outfall.
collect runoff from small areas
must meet the same tests as the infiltration basin or trench. In most applications the dry well is visible and is near a structure, so the appear-ance of the dry well at the surface is important. A soil filter may be used to make the dry well disappear from view. The soil filter consists of the top 1 ft of the dry well being backfilled with top soil (Fig. 8.9).
In some cases the dry well concept can be incorporated into a catch basin (Fig. 8.10) that provides infiltration for more frequent storms. This may allow the rest of the conveyance system to be sized differently and result in reduced construction costs. For example, if a 1-year storm can be retained and infiltrated, downstream conveyances may be designed for storms less than 1-year storm.
Source: SPDH, p.277

Filter strips
<Infiltration>
Vegetated filter strips remove particulates such as metals and phosphorus by filtration through the surfaces of the vegetation and promote some infiltration because runoff is slowed.
The surfaces of the plants also act as surfaces for the deposition of contaminants that might exist as films in the runoff, such as hydrocarbons.
The presence of a healthy soil medium and plant community provides some inherent microbial action on the contaminants present in the runoff. The microbial action will continue even after the surge of storm water has passed.
particulate trapping efficiency of up to 95 percent
Contact time—the time the water is in contact with the vegetation—should be maximized by slowing the velocity of the runoff and by designing the strip to be as wide as possible. Velocities should be no more than 1 foot per second (fps) (0.3 m).
should be designed with a minimum of 2% slope and should not exceed 4%.
If the slope of the filter strip is less than 2%, an infiltration underdrain may be required.
The vegetation selected for filter strips is usually grass, and sod 草皮 may be required to give the strip an opportunity to secure and establish itself.
The filter should be a minimum of 15 ft (4.4 m) wide.
Native sod forming grasses are recommended; tall fescue, western wheatgrass, ryegrass, and Kentucky bluegrass are all recommended for filter strips.
The filter strip should be designed to receive a perpendicular sheet of runoff (Fig. 8.11); a concentrated flow will limit the effectiveness of the filter strip and may damage it.
Source: SPDH, p.278

Sand filters
<Infiltration>
an effective method for removing suspended solids, but it has no designed biological treatment capacity and cannot remove soluble pollutants.
In general, at least 1.5 ft deep and should be used in conjunction with other media or systems to address soluble contaminants.
Sand filters have been designed using a layer of peat to increase the efficiency to 90 percent of suspended solids, 70 percent of total phosphorus, 50 percent of total nitrogen, and 80 percent of trace metals .
The peat and sand filter is usually planted with a cover of grass to increase the removal of nutrients and provide filter surfaces for the deposition of films. The combination of peat and sand is a very effective filter; effectiveness can be increased still further when the filter is used in conjunction with a presettling facility.
Filters of peat or composted materials are a relatively new technology and have much greater removal efficiency than sand alone: up to 90 percent removal of soluble metals, 95 percent of suspended solids, and 87 percent hydrocarbon capture, as well as high rates of removal for other materials. The peat compost filter has only moderate rates of nutrient removal: 40 percent of total phosphorus and 56 percent of Kjeldahl nitrogen (Scheuler, 2000). Using peat alone is an effective filter material but releases an effluent with a greater turbidity. The compost used in such filters should be of deciduous leaves. The peat compost filter requires maintenance and a change of filter material approximately once every 2 years, depending on loading.
Source: SPDH, p. 278-279

Principles of Sand filter applied to parking lots
<Infiltration>
The quality of infiltrating runoff can be improved by designing parking lot edges with a sand filter (Fig. 8.13).
Source: SPDH, p. 279


Infiltration Trench
<Infiltration>
another method of capturing water and allowing for recharge (Fig. 8.14).
generally 2 to 10 ft deep (0.6 to 3 m). The depth is constrained by the same criteria as for the basin (i.e., depth to bedrock or the seasonal high water table).
The trench is lined with filter fabric and filled with stone. The spaces between the stones provide the storage area for the runoff.
The void space of backfill is assumed to be in the range of 30 to 40 percent for aggregate of 1.5 to 3 in. (4 to 8 cm).
Void space refers to the spaces between the solid particles of the fill. Although an emerging spillway is usually not designed for an infiltration trench, the design and construction should consider and address the circumstance of an overflow.
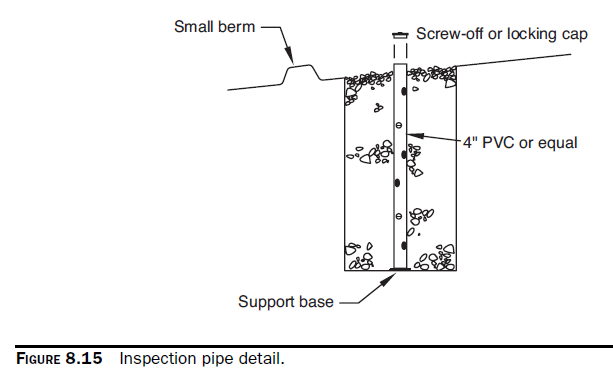
An observation well (Fig. 8.15) should be installed in the infiltration trench to monitor the sediment level in the trench and the dewatering time.
The amount of void space, referred to in most standards as the percentage of voids, is variable by the type of material. The National Stone Foundation suggests that 35 percent voids is a good rule of thumb, and trenches following this rule have functioned well within expected performance guidelines.
The dry density of a particular stone is usually available from the quarry where the stone is graded to specifications (Table 8.10). If more specific data are not available, the mean specific gravity of 2.6 is used.
Source: SPDH, p. 282
Infiltration Basin
<Infiltration>
the infiltration basin serves the same function as the detention basin; that is, it offsets the increase in runoff from the developed site.
The infiltration basin outlets through the pore space in the soil rather than through a surface outlet structure. This allows for some recharge of the aquifer and minimizes the pollutant impact on the receiving surface water.
have a large surface area to provide the maximum possible soil surface contact for the collected runoff; the greater the surface area, the faster the volume can infiltrate into the soil.
oil and grease, floating organic material, and fast settling solids need to be filtered from the infiltration basin. This may be accomplished through the use of a vegetative filter strip, which acts as a filter by slowing surface runoff velocity and providing many surfaces that act as filters for the deposition of grease and oil.
Construction inspection should pay particular attention to the level of the infiltration system. It is important that water enters the infiltration system as a sheet flow. Concentrated flows should be spread out using a level spreader or other device. It is also important that sediment-laden runoff be diverted away from the infiltration trench during construction.
Source: SPDH, p. 282
Rain Gardens
<Infiltration>
also called bioretention basins, are shallow areas designed to collect storm water (Figs. 8.17 and 8.18). They are usually designed to drain fairly quickly to allow typical landscape plants to be used.
have become common features in landscapes, and their hydrologic role is not usually highlighted.
provide an elegant opportunity for designers to incorporate the aesthetic and functional elements of a landscape into a single feature.
have excellent pollution removal capabilities, removing 60 to 80 percent of nutrients and as much as 99 percent of heavy metals.
designed after natural upland areas. The use of native plants reduces the maintenance costs and the need for supplementary water supplies in most cases.
is sized to the area contributing runoff and is designed to serve drainage areas up to one acre.
Multiple small rain gardens generally operate better than a single very large garden. Larger rain gardens tend to become and remain saturated. Rain gardens are ideal for use in planted islands in parking lots and as planted features within a landscape.
Maximum ponding depth in the rain garden should be limited to about 6 in., and the design should allow the pond to drain away within 3 days to protect the native plants and to discourage insects from breeding.
A minimum of 2 ft of planting medium is required. To assure appropriate permeability, the clay content of the soil should be no greater than 10 percent. Studies have found that a soil pH of between 5.5 and 6.5 is ideal for maximum absorption of pollutants and associated microbial activity.
increase the treatment capability of retention by adding the biological elements of the filter strip to the infiltration trench.
all of these systems are a combination of filtration and biological action by soil/plant communities and infiltration. Effective innovations for the treatment of urban runoff can be adapted to some brownfield sites.
The bioretention swale has received high marks for treatment of the first flush of runoff. The bioswale uses a grass strip as a filter to reduce runoff velocity and to remove particulates. The swale employs a media of sand or other material with a topsoil cover to further filter the runoff and as a media for microbial growth and rooting media for swale plantings.
Hydrocarbons are degraded and metals are bound to organic constituents in the topsoil layer. As a system, the bioswale has very high removal efficiencies: up to 92 percent of total suspended solids, 67 percent of lead, 30 to 80 percent of total phosphorus, and 75 percent of total petroleum hydrocarbons, as well as other materials.
Source: SPDH, p.282-284

Catch basins
<Site drainage / infrastructure>
In some cases the dry well concept can be incorporated into a catch basin (Fig. 8.10) that provides infiltration for more frequent storms. This may allow the rest of the con-veyance system to be sized differently and result in reduced construction costs. For example, if a 1-year storm can be retained and infiltrated, downstream conveyances may be designed for storms less than 1-year storm.
Source: SPDH, p.277

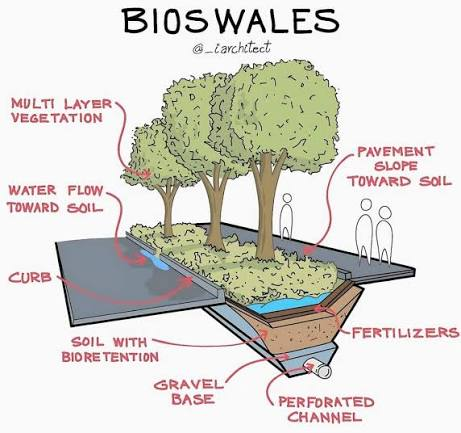
Dry Swale (Bioswale, Bioretention facilities)
<Site drainage / infrastructure>
not the same as dry well
dry swale is a comprehensive, ecologically engineered suraface channel, while a swale infiltrator is a specific subsurface structural enhancement built beneath a channel.
a shallow, linear, vegetated surface channel formed by the intersection of two gently sloping ground planes
It is fully visible on the surface. Underneath the grass layer, it employs a highly engineered profile consisting of a grass filter strip, a sand/soil/peat filtration bed, and an optional gravel reservoir with a perforated underdrain pipe.
The swale employs a media of sand or other material with a topsoil cover to further filter the runoff and as a media for microbial growth and rooting media for swale plantings. Hydrocarbons are degraded and metals are bound to organic constituents in the topsoil layer. As a system, the bioswale has very high removal efficiencies: up to 92 percent of total suspended solids, 67 percent of lead, 30 to 80 percent of total phosphorus, and 75 percent of total petroleum hydrocarbons, as well as other materials.
Source: SPDH, p.284; image from google
Detention basins
<Infiltration>
Although detention basins are designed to mimic the storm water flow that existed before development, they do not account for the many other aspects and functions of the natural drainage basin.
Before development the site provided a buffer for flows, retaining water and detaining runoff, so that flooding was delayed and reduced.
Comprehensive design can identify and imitate some of the characteristics of the natural storm water management system, but the natural system is nearly always superior to the designed system.
The most familiar methods of managing storm water runoff are detention or retention basins.
Detention basins are usually dry basins that only fill with water during a rain. They work by delaying the storm water so that it is released at a rate that mimics the predevelopment flow.
is a function of the drainage area in which it operates and the location of the basin in the watershed.
The lower the basin is in a watershed, the less effective it is in providing a positive or beneficial effect.
It is possible that a properly constructed basin could actually make a downstream flooding problem worse. The basin functions by detaining the water it collects and releasing it at a rate calculated to be equal to the predevelopment rate.
the development of a site results in more runoff, so a rate of discharge equal to the predevelopment rate means it will take longer for the runoff to be discharged.
In a watershed this “lag time” can be hours or days, depending on the size of the drainage area.
In some cases the delay may be long enough to coincide with the “flood,” and the basin may make the flood worse by contributing more water to the peak flow. In such a case, the project and certainly the downstream landowners may be better off without the basin. The impact of a basin can be determined quantitatively but not without some expense.
If a project site is high in the drainage area, it can be difficult to collect enough water in the basin to offset the increase in runoff due to development, and detaining floods nearer the bottom of a watershed may create more problems than it solves. Clearly the best design solution locates the basin so that it serves its purpose within a watershed.
the nature of a basin is to concentrate the flow, usually from a single outlet, and to extend the time of discharge to account for the increased volume from the developed site.
Much consideration should be given to using existing drainage paths. Where increase in flows and velocities will occur, it may be appropriate to enhance existing drainage ways to account for the increase rather than obliterating them in favor of a new path.
The drainage patterns on a site that have developed as part of natural landscape processes can often be converted into effective drainage ways for the new development.
In some cases these drainage pathways, left in place through the site, may double as a greenway and walkway for pedestrians, combining the necessities for drainage and open space.
Changes in the volume and concentration of runoff (due to the project site) will have an impact on streams. Consideration should be given to creating pools and ponding areas to collect and trap water in high flows.
The creation of flat areas to intercept runoff and encourage infiltration might be developed to function as wetlands. The development of wetland pockets could prove to be an important storm water quality feature, as well as adding visual interest and habitat areas.
Watershed authorities have been created in a number of places, most notably in Florida. In principle the storm water authority is able to develop a more efficient and less expensive management approach.
storm water detention basins should provide benefits the simple detention basin does not offer, including recreation or aesthetic qualities, perhaps even wildlife habitat, or a water quality-enhancing design.
Source: SPDH, p.284-286
Retention Basins
<Infiltration>
A retention basin holds the water in a pool. The only outlet is through emergency spillways that allow the basin to overflow in a controlled manner if it should become too full.
loses water through infiltration and evaporation. These basins are often part of a larger plan that incorporates storm water management into water features.
an alternative to detention basin
recreation or aesthetic qualities, perhaps even wildlife habitat, or a water quality-enhancing design.
generally a balancing act between cost, site issues (such as slope or drainage area), appearance, and pond function.
advantages of a wet pond include an effective process for the removal of certain urban pollutants through settling in the permanent pool.
The geometry of the pool is an important aspect of the pond’s capability to remove or reduce pollutants.
Ponds are sized with regard to the flow of water through the pond, pond volume, depth, and the expected particle sizes to be encountered in order to allow for the necessary settling time.
The activity of plants and microorganisms necessary for the reduction of pollutants occurs primarily at the bottom of the basin. The shape of the basin (geometry) must minimize currents and maximize the travel time from the point where storm water enters the pond to any point of outlet or overflow.
should be designed to avoid “dead” storage or areas that do not get mixed into the rest of the pond.
Pond depths will vary according to the purpose. The marsh or littoral zone is usually 6 in. to 2 ft deep and provides the most effective removal of nutrients and some other pollutants.
The basin should include an area equal to 33 percent of the pond surface area that is from 3 to 6 ft deep for fish. An additional 25 percent of the pond should be at least 3 ft deep and within 6 ft of the shore. These shallow and deep areas provide a combination of the effects and uses of the pond.
The minimum drainage area for a wet pond is 10 acres.
The drainage area should be large enough to contribute adequate supplies of water to the pond. The first parameter to consider is the ratio between the drainage area and the pond surface area. The recommended range of the ratio is from 10 to 50. This range could represent a 1-acre pond in a 10-acre watershed or a 10-acre pond in a 500-acre watershed.
The residence time is important because the settlement of pollutants occurs primarily when the water is not moving in the pond. Studies have shown that two-thirds of the incoming sediments settle out in the first 20 hours.
significant phosphorus reduction takes up to 2 weeks. Phosphorus is a pollutant with serious water quality consequences. The volume of water required for storage of 2 weeks is very large. Volumes this large will affect the pond’s ability to function as a detention basin and meet peak discharge control requirements. The combination of purposes— storm water detention and water quality—must be carefully balanced.
the larger the surface area of a pond, the greater its pollution removal efficiency. The smaller the area ratio (larger pond surface), the greater the efficiency of the pond in removing pollutants.
A volume ratio of 2.5 is suggested to achieve 70 percent removal of sediment loads, or a residence time of about 9 days (a middle ground, providing water quality improvements but avoiding the large volume required for the 2-week residence time).
Source: SPDH, p.284-287


Increased permeability of paving surfaces
<Infiltration>
Increased permeability of paving surfaces offers the greatest opportunities. By minimizing runoff, water quality objectives are also usually met.
Concern: these strategies will severely reduce the amount of allowed coverage on a parcel. To zone for such a low density, however, would probably cause development to sprawl even more, increasing the roads and infrastructure necessary and resulting in other undesirable impacts.
best way to reduce the unwanted stream impacts of development are to concentrate development in areas with 80 or even 100 percent impervious coverage.
Using open joint pavers instead of other impermeable paving can provide some infiltration through the joints. Figure 8.20 illustrates the effect of an open joint paver design utilizing quarter-inch joints filled with sharp sand. The 4-in. by 8-in. design with a quarter-inch open joint provides the equivalent of a 60.8 in2 opening in an area of 32 by 24 in.
Examples of reducing impermeable areas:
Reducing cartway widths, smaller paved areas in cul-de-sacs, reducing parking lot size and space size requirements or encouraging shared parking arrangements.
Lawns can be graded to include subtle channels
or collection areas that will delay runoff and increase infiltration.
edges of parking lots or driveways can be designed to collect runoff and encourage infiltration.
relatively high Manning’s coefficient of roughness and delay runoff where swales are used.
increasing the travel distance and decreasing the rate of runoff.
Source: SPDH, p. 287-288

Green roofs
<Runoff reduction>
significantly reduce runoff volumes and in turn reduce development costs
can reduce runoff on a site in a temperate climate by 50 percent, sometimes more
acts as the root zone for the plants as well as the collection media for storm water and the means of conveying excess water from the roof.
must have enough structural support.
Green roofs may be fairly thin soil media or up to a depth of several feet.
The thicker soil layer may require structural support for 50 to 100 lb/ft2, perhaps more in some situations. The thinner layer might only require structural support of 15 to 50 lb.
Approaches
soil medium and vegetation placed directly on the roof —> requires a drainage system and a barrier layer to contain roots.
use containers placed on the roof —> provides for flexibility and limits power costs but may not provide the same advantages of energy conservation and the collection of runoff.
Source: SPDH, p. 289-290

Gray Water Systems
<Wastewater>
wastewater from washing operations but does not include sanitary (toilet) or food wastes.
most wastewater from residences and many commercial enterprises would be classified as gray water. Gray water contains fewer pathogens and nutrients than black water (toilet and food wastes).
The pollutants in gray water tend to decompose more quickly than those in black water.
some local regulations may discourage use of gray water systems whereas others encourage them.
includes the collection of water from showers, sinks, and washing machines.
solids are allowed to settle, floating materials are removed. The water is sent to a sand or soil filter that acts like a traditional leach field to remove and treat pollutants (Fig. 8.23). Since the gray water is much cleaner to begin with, the output is much cleaner as well.
Source: SPDH, p. 290 - 291


Sanitary Sewer
<Wastewater>
The most common sanitary sewer collection systems are gravity flow systems.
Gravity collection systems are designed to use as few pumps as possible by taking advantage of the natural lay of the land and by careful design and construction.
Gravity systems in areas with little topographic relief are limited by the practical depth limits of installation. Infiltration and sedimentation problems associated with low velocity may occur.
In places with very steep topography, high-flow velocities may result in problems of odors (caused by turbulence) or separation of liquids and solids.
Sewer flows are generally calculated using a peak hourly flow rather than an average flow because the distribution of flow is not constant (Table 8.12).
Peak flow times tend to be about 1.5 times greater than the maximum daily flow, or about 3 times the average flow. Peak periods of flow are coincidental, with some lag time, with peak water demand.
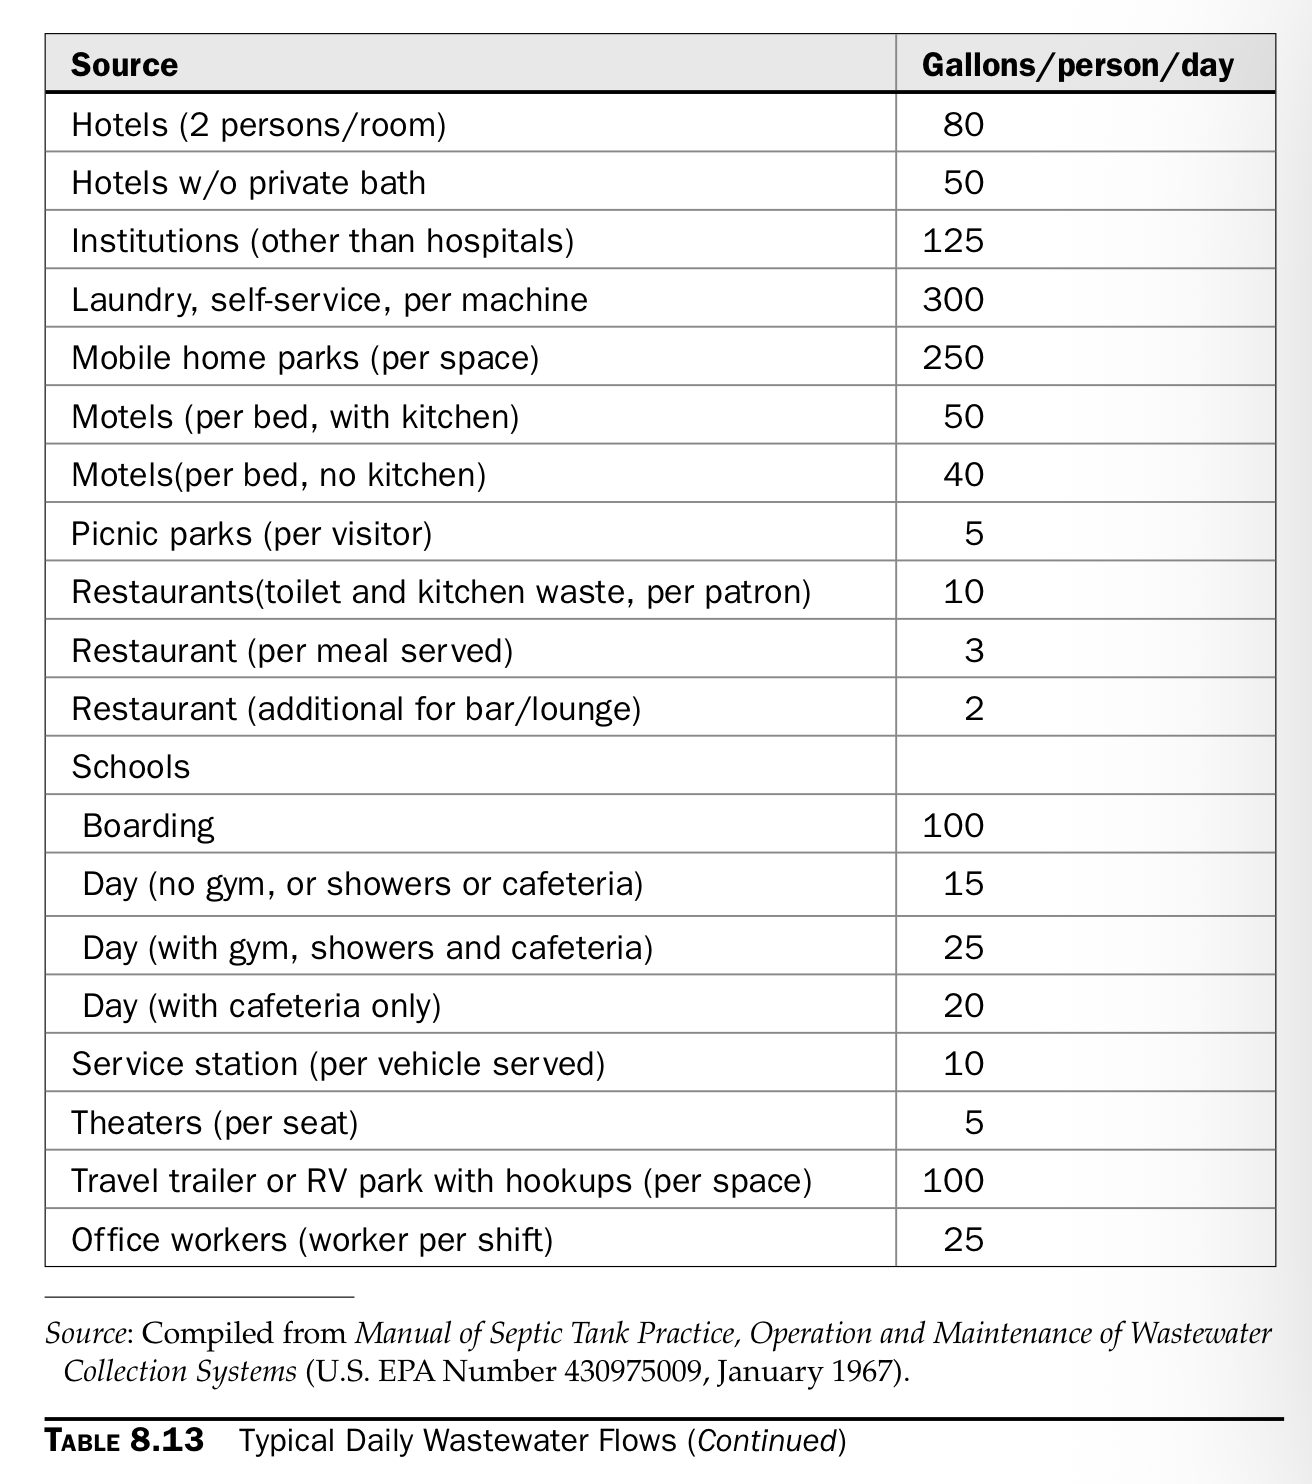
Flows are lowest in the early morning hours and increase as people rise and prepare for their day. After a midday dip, flows increase again in the evening hours. Table 8.13 lists typical daily wastewater flows for a variety of buildings and uses.
Gravity sewers are designed to provide a minimum flow velocity of at least 2 fps, known as the scouring velocity.
At velocities less than 2 fps, solids may settle out of the flow and result in sedimentation in the pipe, reducing the capacity of the pipe and eventually causing a blocked pipe.
Velocities are also best kept below 10 fps to minimize turbulence and splashing. Higher velocities may increase the wear and decrease the life of concrete pipes and facilities.
Municipal design standards may require the use of abrasion resistant pipe materials when velocities exceed 10 fps. As a rule of thumb, scouring velocity should be reached and exceeded during peak flow periods but not necessarily during low flow periods.
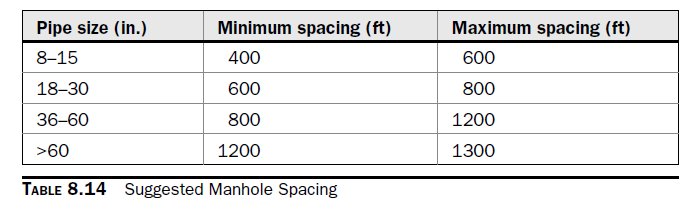
gravity sewers are not constructed with pipe diameters less than 8 in. and have manholes at regular distances (Table 8.14). Manholes should be placed to provide future access to maintenance workers and equipment and are used at all changes in grade, pipe size, and direction.
Source: SPDH, p. 290 - 293

Suggested Manhole Spacing
<Wastewater>
Source: SPDH, p. 294
Depth of utility trenches
<Wastewater>
raise concern for several reasons:
Safety of workers
particularly in unconsolidated or unstable soils
Including safety instructions on working drawings may increase the designer’s liability for construction conditions; on the other hand, noting the installation should be in compliance with federal or state safety standards and regulations may serve to protect the designer from liability.
Costs of installation and maintenance
earth loads on the pipe
deformation resistance is a function of the depth and the width of the trench. As trenches are dug wider, the sides of the trench offer less and less support to the pipe. As the depth of the trench increases, the backfill and surface load increases. The selection of pipe should include consideration of the loads that will be developed in buried pipes. Most pipe manufacturers provide tables for the designer to determine loads on pipes under various field conditions.
Bedding materials also affects pipe performance; it helps the pipe in handling the backfill and surface loads.
identified by standard class designations.
class designations refers to a bedding material’s ability to support the “load factor” and is based on a “three-edge” bearing test.
The ability to support the pipe to the three-edge bearing load is rated as 1. The most common bedding materials are concrete, crushed stone, or suitable local materials.
Source: SPDH, p. 294
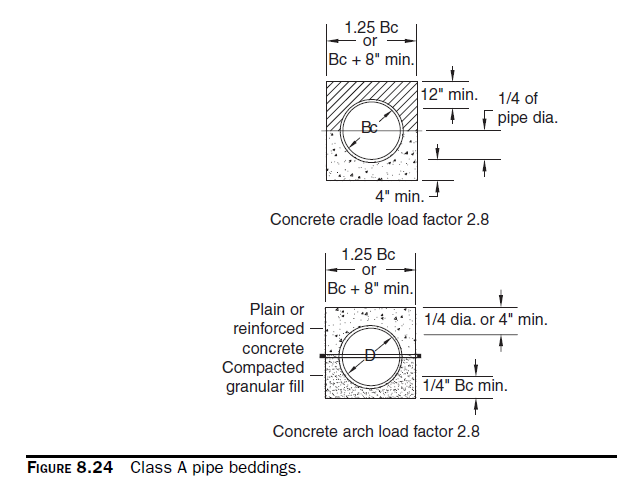
Bedding materials - Class A Bedding
load factor 2 to more than 3
low strength Portland cement concrete (2000 lb/ sq in), depending on the degree of steel or wire reinforcement used.
Expensive, usually used only in very deep trenches or with high surface loads.
pipes are blocked in place and grade while the concrete is poured in place.
Bedding materials - Class B, C & D
<Wastewater>
commonly constructed of crushed stone ranging in size from one quarter to three quarters inch.
In most cases, stone bedding is superior to compacted sand or gravel, except for some plastic pipes.
the most common types used due to their fairly high load factors, ranging from 1.5 to 1.9, and their reasonable cost.
Class D and sometimes class C beddings may be constructed from local or native materials by carefully excavating a trench bed and using the compacted native material as bedding.
Class D bedding is usually not recommended.
Source: SPDH, p.294, 295

On-site sewage disposal systems
<Wastewater>
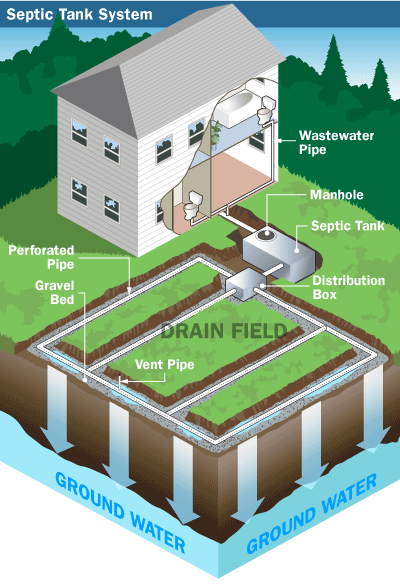
also called absorption systems
commonly used in areas where public sewage collection and disposal are not available.
comprised of a holding tank and a drain field.
The tank provides for settlement and some digestion of the solids. Liquids rise to the surface and are conducted either by gravity or by a pump to a drain field.
The drain field is essentially a manifold system of perforated pipe that distributes the effluent from the tank to a prescribed area. The design of on-site sewage disposal systems must conform to state or local guidelines and requirements, but there are similarities found in these regulations.
utilizes the ability of soil to absorb and treat the effluent as it percolates through the soil matrix.
The soil must have a fairly high degree of permeability but not so high as to present a danger of contamination to groundwater supplies.
field tests that measure the permeability of soil, or the rate at which waste will percolate through the undisturbed soil. The “perc” rate is determined by filling a series of small holes or pits.
An acceptable perc rate is neither too fast nor too slow, based on local regulations.
Other design concerns include the slope of the proposed drain field and the distance to the water table and bedrock.
The actual size of the drain field is calculated as a function of the perc rate and the volume of loading (see Table 8.13). There must be sufficient drain field area to allow for complete absorption of the effluent.
On-site system failures are common.
The pipe system must be installed flat to provide for even distribution over the entire drain field.
If low spots should occur, the waste effluent will tend to collect in the low spot and overload that portion of the drain field. Likewise, if the holding tank becomes filled with solids, the quality of the effluent will degrade and solids may block the distribution system causing overloading.
Source: SPDH, p. 296, 293

Sound mound systems:
<wastewater>
sometimes used where perc rates or soil depth are inadequate for on-site disposal.
raised areas constructed of sandy soils that are designated by local authorities as having acceptable percolation rates.
designed to meet the percolation and loading requirements in much the same way as a typical in-ground system except that the mound is raised and installed above grade, usually on top of the native soils.
In some applications it is coupled with small aerobic treatment system.
is always loaded under pressure using a pump to ensure even distribution of the effluent throughout the drain field.
Source: SPDH, p.296

Constructed Wetlands for Sewage Treatment
<wastewater>
an integral part of on-site and community sewage disposal systems.
Large systems require careful consideration of volume and effluent quality and are usually designed by a qualified engineer.
Smaller systems for individual residences or a few residences may be designed and built without an engineer’s seal in some states. These systems are generally subject to seasonal effects and so are more common in southern states.
Properly constructed and operating systems have no odor and are quite flexible in terms of design form; they may be long and narrow or compact and rectilinear.
They do take up space on a site but provide attractive landscapes when carefully designed and located.
Depending on soil conditions, a typical constructed wetland for a residential system will probably be 300 ft2 or more. Traffic of all sorts should be routed away from the wetland, and surface drainage should be diverted.
require a functioning septic tank. Solids are removed by the tank, and only liquid effluent flows to the wetland.
Typical constructed wetlands have a limited capacity to treat solids. The tank effluent is subject to action by plant roots and microflora and fauna in the wetland.
The high-quality wetland effluent flows through the gravel and is then discharged to the drain field. These systems most commonly are constructed of a shallow depression (+/− 18 in.) lined with an impermeable liner and filled with clean washed gravel or crushed stone (do not use limestone).
Septic tank effluent is introduced through a manifold to ensure a fairly even distribution across the wetland bed. Selected plants are planted directly in the gravel; additional soil is not used.
The effluent is collected in a discharge manifold at the far end of the wetland and conveyed to the leach field.
Care should be taken to remove and wash soil from the roots before planting. These systems do require some maintenance. Plant debris and unwanted vegetation should be removed.
Care should be taken to avoid introducing harsh chemicals to the septic system. Large volumes of water (e.g., draining a pool) should not be discharged to the septic system. Also, plans should be made to water the system if residents are away for more than a few days.
Source: SPDH, p.296-297

Unified soil classes
<soil>
Source: SPDH

Unified Soil Classification System Symbols
<soil>
Source: SPDH

soil Fraction Distribution
<soil>
Source: SPDH

Typical Grading Standards
<site grading>
Source: SPDH

Typical daily wastewater flows (1)
<Wastewater>
Source: SPDH

Typical daily wastewater flows (2)
<Wastewater>
Source: SPDH
Recognized environmental condition
<ESA>
The presence or likely presence of any hazard-ous substances or petroleum products on a property under conditions that indicate an existing release or a material threat of a release of any hazardous substances or petro-leum products. The term includes hazardous substances or petroleum products even under compliance with the law but is not intended to include de minimis conditions. Conditions that might be considered de minimis are incidental contamination such as oil stains from parked cars in small quantities that do not represent a material risk of harm to people or the environment.
Source: SPDH, p. 458
ESA as “practically reviewable”
<ESA>
the information pertaining to the site is accessible without excessive analysis. Information should be accessible for a limited geographic area by address, zip code, county, and so forth.
If information is not reasonably ascertainable or available, the environmental professional will attempt to find information from other sources such as by interviewing owners, neighbors, or local officials. Sources of infor-mation shall be documented: name, date, last update of database, and so on.
information used in the ESA is limited to what is “practically reviewable.” This refers to information that is available in such a form that substantive analysis of the data is not necessary.
Records that cannot be retrieved by reference to the property loca-tion or geographic area are not generally considered practically reviewable.
Source: SPDH, p. 458
Phase I ESA
<ESA>
listed in ASTM E-1527, section 4.5
are not sufficient in scope to elim-inate uncertainty and that, by definition, Phase I is not an exhaustive investigation.
The nature of the Phase I assessment and the range of properties that might be subject to and ESA requires that the practice be flexible.
Typical Phase I process consists of four parts:
a review of existing records of activity and site conditions,
interviews with knowledgeable persons,
a firsthand site reconnaissance, and
a report that summarizes these activities and the relevant findings.
does not include collection or analysis of samples.
The professional is required to conduct the interviews and the site reconnais-sance, but he or she is not required to independently verify all information.
The professional may rely on information provided by others unless there is actual knowledge that the infor-mation is incorrect or unless it is obvious that it is incorrect.
Source: SPDH, p. 458
“Property only”
<ESA>
= minimum search distance
Minimum search distances to be used in access-ing these databases (Information pertaining to environmental permits, actions, activities, or events may be found in a variety of databases)are described in the standard as approximate and may be reduced at the discretion of the environmental professional in consideration of the local density: the distance hazardous substances might be expected to migrate based on geology, hydrogeology, or other conditions.
Source: SPDH, p. 458
Phase II ESA
<ESA>
is intrusive; samples are collected and ana-lyzed. Phase II assessments are performed when common sense or a Phase I investiga-tion indicates the potential for or an actual environmental contamination.
Phase II is usually directed to a specific finding: an area of stained soil, a known underground storage tank, a chemical storage area, an area of suspected contamination, and so on.
The purpose of the Phase II assessment is usually to confirm the suppositions of the Phase I investigation: to identify the limit and extent of contamination in three dimen-sions. It may be necessary to conduct an expanded Phase II investigation to meet the requirements of a state voluntary cleanup program. It is by definition also a reiterative process.
Source: SPDH, p. 461
Net-zero (or Peak-zero, net-positive) building
<Energy Use>
Reducing loads to a minimum makes it possible to use on-site energy production strategies to meet the remaining demands of any necessary mechanical, lighting or electrical systems.
Source: SWL, p. 53
Energy use intensity (EUI)
<Energy Use>
a common metric used to quantify and compare the operational energy consumed.
measures the amount of energy required by a building on a per unit area basis
= total annual energy use / floor area of the building
Source: SWL, p. 53
Building’s energy production intensity (EPI)
<Energy Use>
an estimate of the energy that is generated within the site's boundaries based on available climate resources for photovoltaic panels, wind turbines or other renewable power generation methods employed in the design
Source: SWL, p. 54
kBtu/ ft2 (or annual kWh/ m2)
<Energy Use>
Production units regardless of the power generation method or fuel type consumed, so that equivalent comparisons can be made between buildings and across different fuel types.
Source: SWL, p. 54
Energy Balance Index
<Energy Use>
= Energy Production Intensity − Energy Use Intensity
Conventional buildings have a negative EBI value, since they draw power from off-site in order to satisfy thermal, lighting and plug loads.
A zero value for EBI means that demand equals supply, indicating a building that is net zero.
A net-zero energy building is defi ned as one that produces as much energy as it consumes during a given time period, usually calculated on an annual basis.
An even more efficient building would produce at least as much energy as it consumes at any point in time (including at its peak load hour), resulting in more energy generation than consumption at all other off-peak times; it would have a positive value on the EBI scale, i.e. peak zero, net-positive building.
Other buildings might have an annual positive EBI and therefore be considered net-positive, yet still import energy to handle their peaks.
Source: SWL, p. 54

Integrated design
<Energy Use>
synthesis of climate, use loads and systems to achieve a more comfortable and productive environment for the occupants, and a building that is more energy-efficient than current best practices
an iterative search for synergies between two or more aspects of a project that can create benefits greater than the sum of those resulting from individual design decisions.
Integrated design occurs in the context of the many considerations that are part of any design project—including structural systems, project budget, security and code requirements—and provides a lens through which to view these factors.
Collaboration among project stakeholders throughout the design and construction process promotes synergies.
Source: SWL, p. 55
Integrated Design Process diagram
<Energy Use>
The Integrated Design Process diagram reorganizes the components of preceding diagrams to show the iterative nature of the design process and it defi nes the lens through which each component can be viewed. Climate, for example, could be considered either a positive or negative influence on the project.
The integrated design lens urges designers to view Climate as a resource.
the Use of the building (e.g., schedules and comfort criteria) could be viewed either as a fixed requirement or, according to the integrated design lens, as a malleable element that can be influenced by the building design.
Climate and Use are paired together because they are the two aspects of the design process that define the problems and opportunities of the project. They also share the attribute of being “unbuilt,” or lacking a physical form, in contrast to both Design and Systems, which constitute the designer's “built” responses to the Climate and Use pair. The outermost arrows represent the iterative process of viewing opportunities and designing responses, while the inner circular arrows show the iterative search for synergies among two or more of the components.
many conventional buildings are operated in ways that directly conflict with climate, such as offi ces in warm climates that have peak occupancy and solar and equipment loads during periods of high temperature.
Source: SWL, p. 56 - 57

Analysis Techniques
<Design Decision>
enable the designer to understand, before the building is designed, how the building is likely to use energy, what the climate is like and which architectural design strategies are appropriate.
Source: SWL, p. 59
High-Performance Buildings Techniques
<Design Decision>
provide tools to set targets for energy use and building emissions and to evaluate net-zero energy and carbon-neutral building performance.
Source: SWL, p. 59
Design Decision Chart Overview Diagram
<Design Decision Chart>
Opportunities:
- Climate
1. Resources —> Synergy: Climate as a resource
- Use
2. Use —> Synergy: Energy-conscious occupant behaviors
Responses:
- Building & Site Design
3a. Neighborhood access —> Synergy: Research-rich environments
3b. Site Microclimate —> (same as above)
4a. Morphology —> Synergy: Spatial zoning
4b. Zoning —> (same as above)
4c. Pathways —> (same as above)
5a. Thermal Storage —> Thermal sailing
5b. Envelope —> (same as above)
6. Apertures —> Multivalent design
- Systems
7a. Systems —> Synergy: Active Toiled systems
7b. Controls —> (same as above)
7c. Generation —> (Same as above)
Source: SWL, p. 60

Synergy 1 - Climate as a Resource
<Design Decision Chart>
for Question 1 - Resources
some aspects of even the most extreme climates can be viewed as opportunities;
for example, in hot desert climates the plentiful sunlight can be converted to power and used for supplemental cooling.
Land Community College example:
Question 1 - YES
The design team used WIND ROSE, SOLAR RADIATION, DAYLIGHT AVAILABILITY, DAYLIGHT OBSTRUCTIONS, SKY COVER and temperature and relative humidity information from TMY3 weather data from the National Solar Radiation Data Base (NREL, 2005).
Based on potential load profi les determined from BIOCLIMATIC CHART, TOTAL HEAT GAINS AND LOSSES, HOT WATER LOADS and ELECTRIC LOADS, the team concluded that a net-zero or peak-zero, net-positive building was possible, given the climate and program.
Source: SWL, p. 61, 75

Synergy 2 - Energy-conscious occupant behaviors
<Design Decision Chart>
for Question 2 - Use
design buildings that encourage energy-saving occupant behaviors or that take advantage of physiological traits, such as adaptation to thermal or lighting levels, to reduce loads.
Lane Community College example:
Question 2 - YES
Using a combination of ADAPTIVE COMFORT CRITERIA,
LOAD-RESPONSIVE SCHEDULING and close scrutiny of DESIGN
DAYLIGHT FACTORS, the designers seized an opportunity to
reduce occupant-associated loads.
Source: SWL, p. 61, 75

Synergy 3 - Energy-conscious occupant behaviors
<Design Decision Chart>
for Question 3 - Neighborhood Access and Site Microclimate
access to site resources of sun, wind and light; and power generation are the priorities of this question set and its synergy.
Number of neighborhood scale strategy bundles:
Neighborhood of light
Cooling neighborhood
Solar neighborhood
Integrated urban pattern
Outdoor microclimates bundles and several design strategies help configure space to improve outdoor conditions and improve the climate around and between buildings.
Lane Community College example:
Questions 3a and 3b—N/A and YES.
While the urban infill site was constrained by lot size and surrounding context, GREEN EDGES along the stepped-back south side of the site and SHADY COURTYARDS were used to create a comfortable OUTDOOR MICROCLIMATE without reducing the desired area for on-site power generation.
Source: SWL, p. 61, 75

Synergy 4 - Spatial Zoning
<Design Decision Chart>
for Question 4 - Morphology, Zoning and Pathways
highlight the need to think about climate and use considerations together when seeking to optimize zoning and spatial relationships for energy use reductions and occupant comfort. The bundles at the whole building scale, DAYLIGHT BUILDING, PASSIVELY COOLED BUILDING and PASSIVE SOLAR BUILDING, along with strategies they help organize, identify building scale methods for ensuring access to resources for all spaces.
Lane Community College example:
Questions 4a, 4b and 4c—YES, SOMEWHAT and MAYBE.
As outlined in the DAYLIGHT BUILDING bundle, this solution is a combination of thin and thick building strategies. To make a THIN PLAN that allows access to sun and wind, while still fitting on the site and housing all of the required program elements, the building was split into two L-shaped pieces that wrap a central courtyard. The long legs of the L are oriented to form an EAST–WEST PLAN, and ATRIUM BUILDING was used to both bring light into the central space and to provide ventilation inlets and outlets. Spaces needing higher light levels were strategically placed in the DAYLIGHT ZONES and SIDELIGHT ROOM DEPTH maintained appropriate lighting distribution throughout the classrooms. PERMEABLE BUILDINGS and STACK-VENTILATION ROOMS were used to ensure adequate openings and unobstructed pathways for cooling and ventilation of all spaces.
Source: SWL, p. 61, 75

Synergy 5 - Thermal sailing
<Design Decision Chart>
for Question 5 - Thermal Storage and Envelope
Question 5 has two parts, addresses the integration of thermal storage and responsive envelopes in buildings to create a system that interacts positively with temporal variations in sun, wind and light resources.
The associated THERMAL SAILING synergy suggests a dynamic building that incorporates the bundle RESPONSIVE ENVELOPE, which has three climatic variations, as well as design Strategies that support designing for thermal mass.
Lane Community College example:
Questions 5a and 5b—YES and YES.
THERMAL MASS was incorporated into the design of the building from the inception of the project, used primarily for NIGHT-COOLED MASS but also for DIRECT GAIN ROOMS. MASS ARRANGEMENT called for exposed concrete fl oors that also provide the ceiling of the space below and concrete masonry walls to accommodate the mass surface area that was required. The RESPONSIVE ENVELOPE bundle, which includes EXTERNAL SHADES, SKIN THICKNESS and EXTERIOR SURFACE COLOR, is illustrated by the façade design and exterior wall section. Innovative design strategies such as MOVABLE INSULATION and PERIODIC TRANSFORMATIONS were also considered but were not implemented.
Source: SWL, p. 72, 75

Synergy 6 - Thermal sailing
<Design Decision Chart>
for Question 6 - Multivalent design
concentrate on some of the complex considerations involved in designing apertures and other multi-use elements. Sizing methods and other pertinent information are given by the design Strategies on the right side of the chart.
Lane Community College example:
Question 6—YES.
External glazing design used SEPARATED OR COMBINED OPENINGS to accommodate the multiple functions of windows, lightwells and skylights. Proper sizing was achieved with VENTILATION APERTURES and DAYLIGHT APERTURES. The large windows allow for INTERNAL/IN-BETWEEN SHADES and LIGHT SHELVES to control glare and heat gain and distribute light without falling below minimum daylight levels.
Source: SWL, p. 72, 77

Synergy 7 - Thermal sailing
<Design Decision Chart>
for Question 7 - Active Tailored systems
to tailor the systems as precisely as possible to the size and timing of the peak heating, cooling, ventilation and lighting loads. Several design Strategies are suggested to help identify appropriate energy use targets and select efficient mechanical and lighting systems, if needed.
Lane Community College example:
Questions 7a, 7b and 7c—YES, SOMEWHAT and SOMEWHAT.
The mechanical systems were selected and sized appropriately. Both AIR–AIR HEAT EXCHANGERS and EARTH-AIR HEAT EXCHANGERS were used, along with MECHANICAL HEAT DISTRIBUTION and DUCTS AND PLENUMS. ELECTRIC LIGHT ZONES and TASK LIGHTING were used in concert with MANUAL OR AUTOMATIC CONTROLS to provide combinations of controls that would work reliably in different program scenarios. Overall, the site area constraints do not allow for suffi cient PHOTOVOLTAIC ROOFS AND WALLS to achieve net-zero energy use at its current projected ENERGY USE INTENSITY. However, the SOLAR HOT WATER system does provide a signifi cant energy contribution by supplying most of the academic hot water needs.
Source: SWL, p. 72, 77
Synergies and the Elements of Integrated Design diagram
<Design Decision>
an aid to help remember the synergies that correspond to these question sets.
The diagram shows the four primary elements (Climate, Use, Design and Systems) of integrated design, each of which has one associated synergy, except for the Design component, which has four synergies that apply to different scales (Building Groups, Buildings and Building Parts).

7 Synergies (key design concepts)
<Synergies>
if implemented properly, can help designers create net-zero and peak-zero, net-positive buildings.
CLIMATE
S1 VIEW CLIMATE AS A RESOURCE for load reduction and power generation.
USE
S2 ENERGY-CONSCIOUS OCCUPANT BEHAVIORS reduce peak heating, cooling, ventilation and lighting loads.
DESIGN
S3 Form and organize buildings and open spaces to create RESOURCE-RICH ENVIRONMENTS that provide livable outdoor space and access to site resources.
S4 Integrating climate and use variables yields opportunities for SPATIAL ZONING according to "best-fit" passive design strategies.
S5 A building designed for THERMAL SAILING integrates thermal storage and a responsive envelope that exploit changing patterns of sun, wind and light to regulate comfort and energy use.
S6 MULTIVALENT DESIGN combines two or more functions within a single building element.
SYSTEMS
S7 When all available load reduction strategies and their controls have been exploited, meet the remaining load with an ACTIVE TAILORED SYSTEM that fi ts the load characteristics. 106
Source: SWL, p. 79

S1 View Climate as a Resource
for load reduction and power generation
<Synergies>
addresses Question 1 in the Design Decision Chart for Net-Zero and Peak-Zero, Net-Positive Buildings:
Are site resources sufficient to meet heating, cooling, lighting, ventilation and power needs?
Key climate variables include temperature and relative humidity, the position and intensity of the sun, the speed and direction of the wind and the dominant sky conditions, or cloudiness, which influences the quality and quantity of light. More important than simply analyzing the climate resources is an ability to recognize the architectural implications of certain climatic conditions.
Designers are advised to address early in the design process the potential conflicts between building loads and climatic resource availability over time, since the size and timing of the various loads determine whether they can be met with on-site climatic resources.
Steps:
First analyze the climatic conditions of the site, including temperature, relative humidity, wind, daylight and solar radiation using design strategies such as BIOCLIMATIC CHART, WIND ROSE, DAYLIGHT AVAILABILITY and SOLAR RADIATION.
Then assess the anticipated building loads with TOTAL HEAT GAINS AND LOSSES, ELECTRIC LOADS and HOT WATER LOADS and compare them to the previously determined climatic resources. Based on this information, identify opportunities for creating synergies with the building design and program to reduce loads.
After implementing load reducing strategies, use the climate resources to generate on-site power.
Photovoltaic Area Required for Net- Zero
can be used to estimate the area of PHOTOVOLTAIC WALLS AND ROOFS needed to satisfy the target building Energy Use Intensity (EUI) for several example climates. To use the nomograph, enter on the right-hand side at the target EUI value. Move vertically to intersect the desired Energy Balance Index (EBI) performance, and then move horizontally to intersect an appropriate climate line and drop to the lower left axis to read the ratio of PV area to floor area.
EBI = 0 is a net-zero building. EBI > 0 is a net-positive building. EBI < 0 is an energy consuming building.
Alternative: begin from the PV area/floor area ratio or from the vertical Energy Production Intensity (EPI) axis, depending on which values are known or prioritized.
EUI
is an annual energy use rate, not daily or hourly basis, which may vary significantly.
A building may have a low EUI but still have a high peak load or have most of its energy use in one season or another.
The nomograph neither shows:
the generating capacity equal the annual EUI or the peak demand.
the highest generation coincide with the peak demand
However, the nomograph allows the designer to estimate the area needed to accommodate sufficient PV panels (which can be sizable) to satisfy the energy demand in the absence of peaks.
Assuming that the building loads have been reduced as much as possible, peaks can occur when climate and occupancy factors align.
A low peak is desirable since equipment is often sized based on peak loads, and higher capacity equipment is both more expensive to purchase and less efficient to run during low demand.
When resource availability does not coincide with the need for heating, cooling and lighting, the energy must be stored for later use, for example, in batteries or pumped water. The efficiency of the storage system will affect the amount of power generation required.
Source: SWL, p. 80 - 81

S2 Energy-conscious Occupant Behaviors
reduce peak heating, cooling, ventilation and lighting loads
<Synergies>
addresses Question 2 in the Design Decision Chart for Net-Zero and Peak-Zero, Net-Positive Buildings:
Can schedules, comfort criteria or occupant behavior be changed to avoid or reduce peak loads?
Because building loads tend to follow users, signifi cant progress towards net-zero or peak-zero, net-positive buildings can be made by coupling occupant habits to climatic conditions and minimizing the periods when those habits exacerbate climate peaks.
While climate conditions can contribute to either a heating or cooling peak, human occupants are always heat sources (and often turn on additional heat sources) and thus may increase the climate-driven cooling peak or may decrease the climate-driven heating peak.
Behavioral flexibility describes the physical and psychological adjustments that occupants can make in order to adapt to their surroundings. These behavioral adaptations include changing the amount and type of clothing, drinking warm or cold beverages and doing light exercise [see ADAPTIVE COMFORT CRITERIA]. How flexible occupants can be is partly determined by the building's type and use.
Spaces that encourage climate-responsive use patterns can infl uence operational energy use.
The diagram Designing Well- Lighted Primary Spaces shows a daylighting strategy for ensuring that a double-loaded corridor has lower illuminance than the classrooms it serves. The apertures into the corridor are smaller than those for the classrooms, allowing less daylight into the corridor while the majority is reflected into the classroom.
Since the perceived brightness of any space is influenced by the light level of the most recently occupied space, people entering a classroom from the hallway will perceive it to be brightly lighted because their eyes have adapted to the lower light level of the hallway. They will then be less inclined to turn on the lights in the classroom.
Design internal building spaces that allow occupants opportunities to adjust their comfort criteria, schedules, or behavior patterns in a way that minimizes energy use.
Conscious behavioral patterns can also be harnessed to reduce loads and energy use.
The house is divided into two distinct zones: an outdoor gallery shaded by the parasol roof and an indoor thermal enclave operating by PERIODIC TRANSFORMATIONS that can be closed or open depending on and occupant preferences.
Occupants can also alter their behaviors within a diurnal time frame: they can choose to stay outside under the shelter of the parasol all day and night, moving furniture out to the gallery when it is more comfortable.
Source: SWL, p. 82 - 83
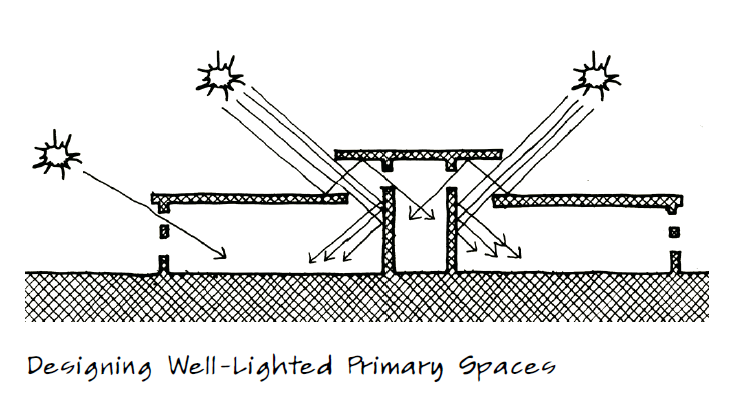

S3 Form and Organize buildings and open spaces
create RESOURCE-RICH ENVIRONMENTS that provide livable outdoor space and access to site resources.
<Synergies>
addresses Question 3a and 3b in the Design Decision Chart for Net-Zero and Peak-Zero, Net-Positive Buildings:
3a. If the project includes multiple buildings, can they be arranged to allow access to fresh air and sunlight throughout the site?
3b. Can the site design enhance access to desirable resources while mitigating unwanted resources for part or all of the year?
Using site energy to produce thermally comfortable conditions extends the occupancy period of these spaces. Habitable outdoor rooms can result in less conditioned indoor area and therefore reduce energy consumption.
Microclimate conditions change throughout both the day and the year.
Design strategies that manifest concurrently or that involve a time lag can promote outdoor comfort during different seasons or periods of the day.
Microclimates also have qualities that can be characterized as either static or dynamic depending on whether they alter their state over time.
In the diagram Static Versus Dynamic Strategies, the tree represents both concurrent and dynamic strategies in that it does not store heat or coolth over time, but it does drop its leaves to admit the sun during the winter and leaves out to provide shade during the summer. The masonry wall stores heat that it collects from the sun during the day and releases it gradually after the sun goes down, and thus is static with a temporal lag.
When designing outdoor microclimates, ensure that outdoor spaces and neighboring buildings have adequate access to climatic resources, because sun and wind can be blocked at smaller scales, but cannot be created if they are not present.
Once resource access is established, site organization and elements can be used to create localized conditions of variation in sun, shade, wind and lee.
Example: North Macadam Greenway Microclimate Study for Portland, Oregon, the patterns of sun, shade, wind and lee are determined by the configuration of the buildings and vary by season and time of day.
Source: SWL, p. 84 - 85


S4 Integrating climate and use variables yields opportunites
create RESOURCE-RICH ENVIRONMENTS that provide livable outdoor space and access to site resources.
<Synergies>
addresses Question 4a, 4b and 4c in the Design Decision Chart for Net-Zero and Peak-Zero, Net-Positive Buildings:
4a. Can the building form and orientation allow access to sun, wind and light resources for most internal and external spaces?
4b. Can spaces with similar heating, cooling, ventilation and lighting requirements be grouped together?
4c. Can the design accommodate unobstructed pathways that allow sun, wind and light to be distributed throughout the entire building?
Building form determines which internal spaces have direct access to sun, wind and light [DEEP SUN, SKYLIGHT BUILDING]; one of the primary drivers of building form is the desirability of spaces along the skin of the building [THIN PLAN; EAST–WEST PLAN].
Orientation influences the quantity and quality of the resources that enter the building, as well as the degree to which admission can be controlled, as observed in southfacing glazing, which permits the best access to solar radiation during winter months while also being the easiest to shade during summer months [ROOMS FACING THE SUN AND WIND, LOCATING OUTDOOR ROOMS].
Internal organization groups together spaces with similar needs [HEATING ZONES, COOLING ZONES, DAYLIGHTING ZONES, ELECTRIC LIGHT ZONES, STRATIFICATION ZONES].
The Building Form and Subdivisions Matrix shows the four primary building form categories—short and fat, short and thin, tall and fat, or tall and thin—and four possibilities for subdivisions of internal spaces. Of the four form types, the tall and fat building has the least amount of surface area relative to floor area, and thus its internal spaces have the least access to sun, wind and light resources. The short and thin building has the greatest amount of surface area relative to fl oor area and the best access to resources.
Spatial Zoning in Section and in Plan diagram:
Internal spaces can be organized in a number of ways.
In plan, for example, a double-loaded corridor might be divided into different zones lengthwise, transversely, or from the middle core out.
it shows how the building can also be divided into zones sectionally, by floor or by orientation. The subdivision of internal spaces affects distribution pathways through the building. Air flow and daylight are particularly sensitive to internal partitioning [PERMEABLE BUILDINGS] and in thick buildings may require MOVING HEAT TO COLD ROOMS or methods for getting daylight deep into the building, such as DEEP SUN, ATRIUM BUILDING, BORROWED LIGHT or SKYLIGHT WELLS, to achieve the desired distribution to interior rooms.
Design buildings to provide access to sun, wind and light for as many of the interior spaces as possible . Often this means that buildings will be thin (either literally or functionally, e.g., courtyard buildings)
Use ENERGY PROGRAMMING to identify the degree to which different types of spaces require different levels of heating, cooling, lighting and ventilation.
Example: Lane Community College Health and Wellness Building.
Using zoning principles and distribution pathways to achieve a primarily daylit and naturally ventilated building.
A sliding door located in the central hallway is closed at night to ensure that ventilation air travels the planned route through each separate zone of the building so that the thermal mass in each zone receives adequate night ventilation to remove heat collected during daytime use.
Source: SWL, p. 86 - 87

S5 A building designed for THERMAL SAILING
integrates thermal storage and a responsive envelope that exploit changing patterns of sun, wind and light to regulate comfort and energy use.
<Synergies>
addresses Question 5a and 5b in the Design Decision Chart for Net-Zero and Peak-Zero, Net-Positive Buildings:
5a. Can the design include thermal mass, and do daily temperature swings and radiation levels promote storage strategies?
5b. Can the envelope be designed to resist or allow convective, conductive and radiative heat transfer when desirable?
Building operators can adjust building controls to harvest, reject or modulate climatic forces.
Examples of building elements (both active and passive) that can be combined to form a RESPONSIVE ENVELOPE bundle include: INTERNAL AND IN-BETWEEN SHADES, EXTERNAL SHADES, operable VENTILATION APERTURES and MOVABLE INSULATION panels.
Integrating THERMAL MASS into the building design helps modulate temperature swings, resulting in greater thermal comfort and less energy use.
other details that affect mass performance, such as the provision of INSULATION OUTSIDE the THERMAL MASS and the different pathways and sources for heat loss and gain.
other factors in the effectiveness of thermal storage strategies. MASS ARRANGEMENT, for example, affects its access to either warm or cool air and its ability for radiant exchange.
The surface reflectivity and MASS SURFACE ABSORPTANCE also influences how much heat is gained or lost through radiation.
To reject heat gain in a masonry storage system, exterior or interior shades can be used to prevent direct radiation from entering the space and VENTILATION OPENINGS ARRANGEMENT provides a pathway for cool night air to flow across the mass.
In the heating season:
solar gain is encouraged during the daytime, and MOVABLE INSULATION is used to prevent heat loss at night.
selectively applying insulation to some high-loss areas of external walls, such as window apertures, has more impact on the overall wall R-value than increasing the level of insulation in the wall area itself.
For example, a wall insulated to R-30 with a 30% glazing fraction has an overall wall R-value of 7.79 using windows with 0.35 U-factor, but the same wall has an overall wall R-value of 18.75 when R-10 shutters are used.
To design a building for THERMAL SAILING, first determine whether the exterior envelope elements are to act as a connector, barrier, filter or switch, or combinations of these based on prevailing climatic conditions and indoor comfort criteria.
fixed window acts as a barrier to air movement, and as a connector for sunlight and daylight.
An operable window acts as a switch in terms of air fl ow, while an electrochromic window and operable shades act as switches for sunlight.
Mixed climate:
overheated periods - ventilation apertures for cooling
close apertures to retard excess heat gain.
If NIGHT-COOLED MASS is employed, open apertures at night
Organizing occupancy patterns in LOAD-RESPONSIVE SCHEDULES
During the cooling season, shade all glazing from direct radiation. Employ MOVABLE INSULATION as a barrier against heat gain during the daytime, so long as sufficient glazing area for daylight is maintained, or in the case of unoccupied rooms.
During underheated periods, open INTERNAL SHADES and operable EXTERNAL SHADES to admit sun.
Organize occupancy patterns using MIGRATION so that the parts of the building that warm up first, such as those with east-facing glazing and those on upper levels, are occupied early in the day. As spaces become unoccupied and lose access to direct solar radiation, employ MOVABLE INSULATION over the glazing to reduce heat loss.
Source: SWL, p. 88 - 89
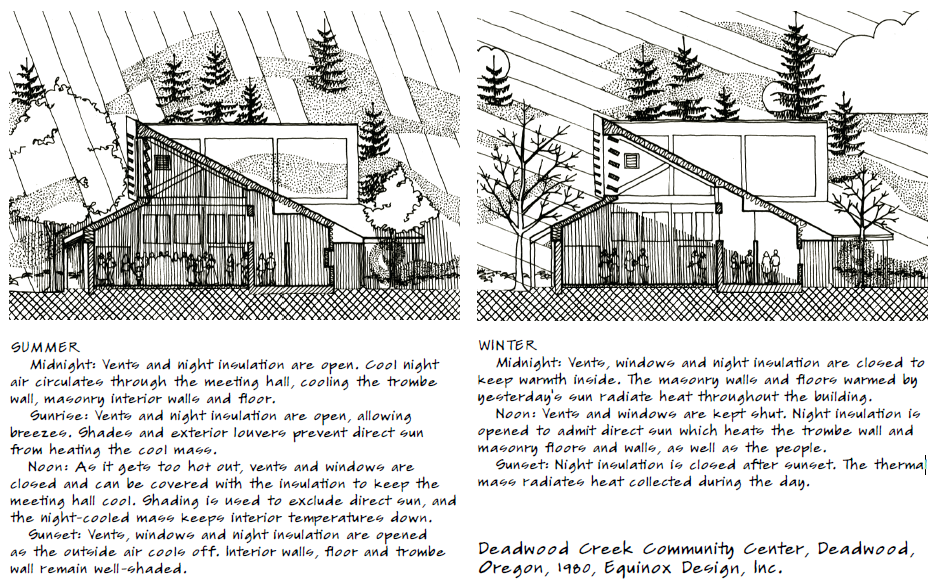
S6 MULTIVALENT DESIGN
combines two or more functions within a single building element.
<Synergies>
addresses Question 6 in the Design Decision Chart for Net-Zero and Peak-Zero, Net-Positive Buildings:
Can apertures be designed to admit resources without adverse effects, such as overheating and glare?
Some building elements, such as windows, can be designed to perform multiple functions , but can introduce problems when designed poorly.
When designing multivalent elements, create a table like the example for vertical windows given in the Multivalent Elements Table, which lists the functions of each element and the potential confl icts or problems. Fill in possible design strategy solutions for each problem and then look for strategies that fulfill multiple functions.
When aperture sizing confl icts arise between two or more of the needs for heating, cooling, daylighting and ventilation, consult SEPARATED OR COMBINED OPENINGS for alternatives. If SOLAR APERTURES present glare issues or seem too large, collection openings for DIRECT GAIN ROOMS can be combined with other solar heating systems, such as THERMAL STORAGE WALLS, SUNSPACES, or THERMAL COLLECTOR WALLS AND ROOFS to provide heat with less daylight and glare, as outlined in the RESPONSIVE ENVELOPE bundle.
Example: Lane Community College Health and Wellness Building
The DAYLIGHT APERTURES are equipped with EXTERNAL SHADING louvers which allow a high percentage of reflected light to enter while minimizing unwanted solar gain when the sun is at a high angle, thus serving as DAYLIGHT ENHANCING SHADES.
Central SKYLIGHT WELLS are used to provide daylight and become STACK-VENTILATION ROOMS with exhaust outlets for ventilation air.
Source: SWL, p. 90 - 91
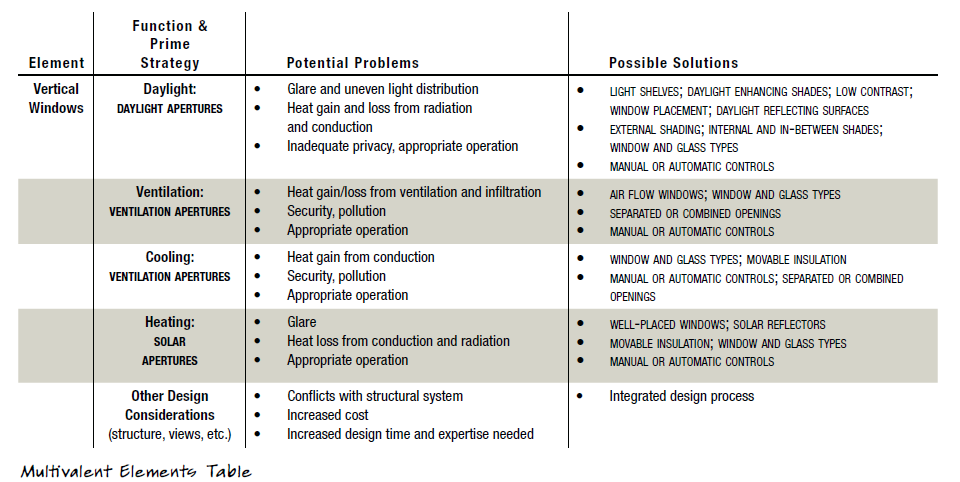
S7 When all available load reduction strategies and their controls have been exploited, meet the remaining load with an ACTIVE TAILORED SYSTEM that fits the load characteristics.
<Synergies>
addresses Question 7a, 7b and 7c in the Design Decision Chart for Net-Zero and Peak-Zero, Net-Positive Buildings:
7a. If needed, are mechanical and electrical systems selected and sized appropriately to supplement load reduction strategies?
7b. Can manual controls be used reliably given the program and climate?
7c. Are power generation systems sized appropriately to provide power when needed?
Building loads can be evaluated using ANNUAL ENERGY USE and then be compared to the on-site generation potential using NET-ZERO ENERGY BALANCE.
Designers can use load reduction strategies to make energy demands more level and smaller so that there is less difference between average and peak loads.
Assuming load reduction strategies have already been applied to the degree possible, consider the following principles for tailoring active systems to building loads:
See the architectural fabric and the mechanical and electrical systems as an integrated whole.
Segregate the heating, cooling, ventilation and lighting systems so that each can be sized and efficiently controlled for its own load; systems are efficient at constant operation levels.
Condition spaces only where and when they are occupied.
use a combination of MANUAL AND AUTOMATIC CONTROLS to optimize energy use and occupant comfort.
Use a spectrum of task/ambient heating, cooling and lighting systems matched to occupants' needs. Allow the potential for variety in thermal and luminous conditions [TASK LIGHTING, ADAPTIVE COMFORT].
Generate renewable energy during peaks, and use it for supplemental heating/cooling or store the energy for later use.
design modular spaces that have separate systems sized to meet only the demands of each space. In this way, rooms can be operated independently according to occupancy levels and use, reducing overall building energy consumption.
rooms can be operated independently according to occupancy levels and use, reducing overall building energy consumption.
Example:
Mount Angel Abbey Annunciation Academic Center
relies on hydronic baseboard radiant heaters to supply heating and AIR–AIR HEAT EXCHANGERS to temper ventilation air, all sized and operated independently for each classroom. Heating, lighting and ventilation systems within the classrooms use a mix of MANUAL OR AUTOMATIC CONTROLS.
Source: SWL, p. 92 - 93

Bundle
<Bundles>
A Bundle in Sun, Wind & Light is a set of related strategies working together to resolve commonly occurring design problems.
A bundle may address a single energy issue or it may address two or more energy topics (heating, cooling, daylighting, ventilation or power. In general, a bundle has the following characteristics, as illustrated in the diagram The Structure of a Bundle.
A Bundle covers two or more scales in the hierarchical system for levels of complexity (such as L1 Elements and L2 Building Systems). Most of the fundamental bundles cover three levels (the gray bars). The black lines connecting the squares represent a particular kind of relationship among the strategies of lower and higher complexity. The levels function to make clear how lower complexity strategies help to build higher complexity strategies.
Bundle has 3–5 invariant core strategies (the solid black squares) that can always be used in the given design situation. Core strategies are recognized as those that apply to all the bundle's variations.
A Bundle has two or more situational variations, each with its own bundle diagram. These adapt the bundle to a major variable commonly present (such as the difference between designing in a cool versus a hot arid climate) by the addition of situational strategies (hollow squares inside the dashed line) beyond the core strategies. If it is a core strategy, it will be present in all variations as an important strategy.
A Bundle may also identify refiner strategies (squares in the lower grey bars outside the dashed line), which are related to the bundle and are recommended to be considered as the design develops to greater levels of detail.
Source: SWL, p. 97 - 98

Passive Solar Building: Thick Plan Bundle
<Bundles>
Each graphic icon represents an individual design strategy in Sun, Wind & Light. The core strategies are shown with a bold outline: HEATING ZONES, ROOMS FACING THE SUN AND WIND, DIRECT GAIN ROOMS, MASS ARRANGEMENT and WELL-PLACED WINDOWS. These strategies will apply to almost all passive solar buildings of both variations.
The situational strategies are located within the bundle boundary (bold dashed line); their icons have no border, for example: CLUSTERED ROOMS, SUNSPACES and MECHANICAL HEAT DISTRIBUTION. These design strategies will typically apply to one of the bundle variations, but not to all of the variations. The situational strategies are appropriate almost all of the time, yet not every strategy will be used on every project.
For example, most thick plan buildings will need MECHANICAL HEAT DISTRIBUTION to move heat from rooms or surfaces that collect solar heat to remote rooms without direct access to solar heat, but a thin plan building can usually use passive radiation or local passive CONVECTIVE LOOPS to distribute heat.
Refiner strategies are less critical to the bundle's success or have less impact on architectural form than core or situational strategies. However, they may still have a large impact on performance, depending on the situation. The refiner strategies are located outside the bundle boundary (bold dashed line) and their icons have no borders: ATRIUM BUILDING, INSULATION OUTSIDE and SEPARATED OR COMBINED OPENINGS. For example, in a thick plan PASSIVE SOLAR BUILDING, a light court may be used in an ATRIUM BUILDING arrangement; the atrium may also double as a SUNSPACE to collect heat if its roof or one wall has SOLAR APERTURES oriented to the sun. This refiner strategy will not apply to all buildings, but if used, could improve the performance of the bundle.
Source: SWL, p. 98 - 100

Two broad types of Bundles
<Bundles>
Topically focused Bundles
composed of strategies that are primarily related by their association with a particular climatic design issue, such as the way a daylighted building needs strategies that cross a range of scales.
Bundles of this type include:
NEIGHBORHOOD OF LIGHT
SOLAR NEIGHBORHOOD
COOLING NEIGHBORHOOD
DAYLIGHT BUILDING PASSIVELY
COOLED BUILDING
PASSIVE SOLAR BUILDING
Topically integrated Bundles
are related across multiple topics, such as the way the building envelope can address heating, ventilation, cooling and daylighting.
Bundles of this type include: OUTDOOR MICROCLIMATES RESPONSIVE ENVELOPE
Source: SWL, p.100
Situational variations
<Bundles>
a bundle can have situational variations based on any variable that significantly changes the designer’s response because of a relatively large change in the design situation, for example:
Different climates
(cold/hot, humid/arid, low/high altitude or continental/marine)
Rate of Internal gains
(high lighting, people and equipment density vs. low density)
Occupancy schedules
(no summer use vs. buildings used all year, no weekends vs. seven days a week)
Morphological alternatives
(short/tall and thick/thin buildings, etc.)
Energy goals
(such as site net-zero energy buildings/ net-positive energy buildings, etc.)
when the situation changes significantly, the strategy family that is appropriate may also change.
one strategy will apply to all situations. This is the root of the core strategies found in the bundle variations based on climate.
Source: SWL, p.100
Two forms to make sure critical strategies in the network of the design have not been left out when bundles are used in a design process.
<Bundles>
The designer checks for the presence of the family of strategies needed for the success of one system, such as a solar-heated building, and that, at a minimum, nothing critical has been left out.
The designer checks that the major common implications of that system are accounted for, such as the extra attention to shading and glare needed when using large, sun-facing windows for collecting solar heat.
Source: SWL, p.100
B4 INTEGRATED URBAN PATTERNS
of streets and blocks can be oriented and sized to integrate concerns for light, sun, wind and shade according to the priorities of the climate. [heating, cooling and daylighting]
<Fundamental Bundles>
Integrated urban patterns balance needs for heating, cooling and daylighting based on the variables of Use and Climate.
The pattern of streets and buildings sets the stage for the possibility of passive strategies at the building scale.
The orientation and layout of streets, combined with the spacing of buildings, has a significant effect on the micro climate around buildings and on the blocking of or access to sun and wind for use in buildings.
Major tension in neighborhood layout:
In mixed climates, admitting desirable site resources and blocking the undesirable resources may be at odds.
the need for compactness versus the need to disperse buildings for access to winter sun or summer wind.
Recommendations:
Wider east–west streets give better winter solar access [EAST–WEST ELONGATED BUILDING GROUPS]
Wider streets in the direction of prevailing wind flows promote better wind movement through the city [BREEZY STREETS].
Wind speeds can be decreased or increased depending on whether the neighborhood is designed as a LOOSE OR DENSE URBAN PATTERN.
At high latitudes the sun position and therefore winter radiation is more equatorial-dominant (S in NH and N in SH), while at temperate latitudes, more flexibility in orientation for solar heating is permissible with out severe penal ties in the amount of radiation collected [ROOMS FACING THE SUN AND WIND].
Narrow north–south streets can create shade from one building ot the next [SHARED SHADE].
Source: SWL, p.138


Street Orientation and Layout by Climatic Priority
<Fundamental Bundles>
because internal-load-dominated (ILD) buildings have a greater requirement for cooling than skin-load-dominated (SLD) buildings, the effect on the recommendations is to shift these buildings to the next hotter climate type. For related recommendations that vary by Climate and Use, see SITE MICROCLIMATE and SHADING CALENDAR.
Source: SWL, p.140

Summer Solstice Shadows as a Function of Street Orientation
<Fundamental Bundles>
show the effect of different street orientations on summer solstice sun and shading patterns at different latitudes. Orientation and building spacing can be selected based on the building's mix of needs for heating or cooling.
They represent four-story buildings on 60 ft (18 m) right-of-way streets. Cardinal orientations give more sun to the south facades in winter, where as rotated organizations tend to reduce winter gains and increase summer gains, especially on easterly and westerly facades. However, for buildings that do not require winter sun for heating, rotated organizations give more evenly distributed sun to more facades.
rotated orientations pro vide more shade on the streets during more of the day. A cardinal orientation will have one shady street, while cross streets will be sunny.
rotated orientations will provide shade on at least one side of the street for most of the day.
during mid day, when the sun is high, buildings cast quite small shadows and the orientation of streets has little effect, indicating that south-facing facades (N in SH) should be shaded at the element scale [DAYLIGHT-ENHANCING SHADES, EXTERNAL SHADING, and INTERNAL AND IN-BETWEEN SHADING] and that streets, open spaces and out door rooms must be shaded in the over head plane [OVERHEAD SHADES].
The 22.5° rotation plans show increase street shading while meeting solar orientation criteria and may be appropriate for a temperate climate. As rotation in creases away from cardinal, shadows reach opposite buildings less and thus buildings must provide more self-shading.
Source: SWL, p.140 - 141
