Statistical Interference Week 6 B&R
 Call Kai
 Learn
 Practice Test
 Spaced Repetition
 Match
 Flashcards
 Knowt Play
1/15

There's no tags or description
Looks like no tags are added yet.
16 Terms
Why do statistics use samples to make inferences of population?
Estimate is a known quantity calculated from the sample data
Use estimate to try and calculate the unknown population- Parameter
Sample is very unlikely to represent population perfectly- attach confidence and probability to our statements
We use small groups to learn something the larger population represents
What are the two types of statistical tests?
T-test: testing for difference between two groups/conditions
Correlation: exploring relationship between two variables
What are the main principles behind a t-test?
Is variation between-group variation greater than within-group variation?
t-value= mean difference (signal)/ standard error (noise)
High t value indicates a clear signal
What are the two main types of t-test?
Independent- compares means of two independent groups
Paired (dependent)- compare the means of two related group samples
When do we use a paired t-test?
Before-and-after measurements, repeated measurements, two conditions applied to the same subject, matched individuals and two methods applied to the same item
What is statistical interference?
Where statistics use samples to make ‘inferences’ about a population
ESTIMATE is a known quantity calculated from a sample of data
Use the estimate to try and determine the unknown population PARAMETER e.g. population mean
• Sample is very unlikely to represent the population perfectly – we attach probability or confidence to our statement
study small group to learn something larger population represents
What is Descriptive statistics?
Summarize and describes the data you have e.g. pie chart, bar graph
What is inferential statistics?
Makes conclusions about larger population e.g. hypothesis testing
What are the three levels of significance?
Statistical significance: Probability of obtaining the sample result if the null hypothesis was true.
Theoretical significance: Finding is relevant for a theory or leads to a new experiment.
Many results that are statistically significant don’t meet this criteria
Clinical (practical) significance: A finding is relevant for diagnosing or treating a disease
Why might group means be different?
There is a 'real' difference in population and the difference in the sample group reflects this- SIGNAL
No ‘real’ difference the population and difference in sample reflects sampling in variation and error- NOISE
What are type 1 and 2 hypothesis testing errors?
In hypothesis testing, a Type I error is a false positive
concluding an effect exists when it does not.
Type II error is a false negative.
failing to detect an effect that exists
How do we reduce type 1 errors?
Reduce α threshold and control multiple testing. More likely that effect is real (decrease Type I errors) but harder to find real effect.
How do we reduce type 2 errors?
Increase power, often through a larger sample or better study design. Usual to set power around 80%.
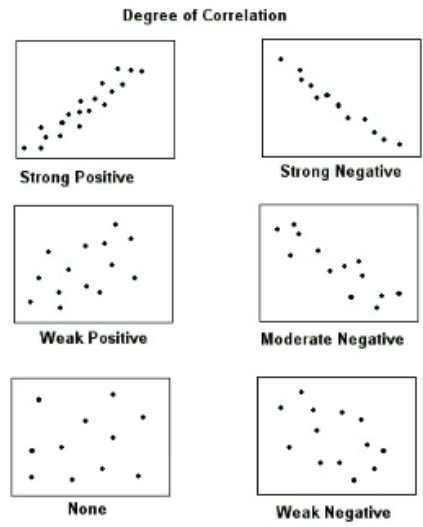
What are the features of correlation?
Correlations only examine linear relationships
Correlation is independent of units
Used if both variables are measured (not manipulated)
Significance is highly dependent on sample size
Very small correlation coefficients can be statistically significant if there is a very large sample
Consider practical importance of findings
How do we choose statistical data if normally distributed?
Is the data normally distributed?
Yes- parametric tests (more powerful)
No- nonparametric tests (ranking of data)
What are non-parametric tests?
Nonparametric tests- used with data that isn't normally distributed
T statistics are calculated using rankings
Less powerful but more robust
Example- spear man's rank correlation