EECS 3461 - User Interfaces Test 1
 Call Kai
 Learn
 Practice Test
 Spaced Repetition
 Match
 Flashcards
 Knowt Play
1/147

Earn XP
Description and Tags
EECS 3461 - User Interfaces Test 1 with Emily Kuang, Fall 2026
148 Terms
What is human-computer interaction?
Human-computer interaction (HCI) involves the study, planning, and design of the interaction between people (users) and computers.
It is often regarded as the intersection of computer science, behavioral sciences, design and several other fields of study.
What is a User Interface?
The space where interactions between humans and machines occur
Encompasses all visual (buttons, icons, layouts, colors) and interactive (clicks, swipes, voice) elements that allow users to control and receive feedback
What is User Experience?
User Experience encompasses all aspects of the end-user's interaction with the company, its services, and its products
Describe the difference between UX and UI? (mention the roles of the designers)
UX starts with a problem and ends with a wireframe or prototype.
Roles of a UX designer:
-understand the customer journey
-understand the target audience
-interviewing customers
-defining user flows
-conducting user testing.
UI design is about using typography, images, and other visual design elements to turn a basic interface into something digestible and usable
Roles of a UI designer:
-focus on how the colors
-focus on typography
-images of a design connect to the brand of a product
What are three pillars of user centered design?
Early focus on users and tasks: directly studying cognitive, behavioural, anthropomorphic and attitudinal characteristics
Empirical measurement: usersʼ reactions and performance to scenarios, manuals, simulations & prototypes are observed, recorded and analyzed
Iterative design: when problems are found in user testing, fix them and carry out more tests
Why is involving users beneficial?
Authenticity:
-authentic user expertise
-authentic perspectives
Pragmatics:
-expectations are realistic (expectations of users, and of team)
-users feel a sense of ownership (users become active stakeholders)
Who are users?
Anyone who…
-Interacts directly with the product
-Manages the main users
-Receives output from the product
-Makes purchasing decisions
-Uses competitorʼs products
What are the three main categories of users? Briefly describe each
-Primary: frequent hands-on
-Secondary: occasional or via someone else
-Tertiary: affected by its introduction, or will influence its purchase
Describe Primary users, and give an example
Main users of your product. They interact with it the most frequently and use its core functionalities
ex: for a fitness app, primary users may be people who regularly track workouts or meal plans
Describe Secondary users, and give an example
Users who do not interact with your product as much as primary users, but are still important. May use some of the product’s functionalities, but not all.
ex: for a fitness app, these may be people who use the app occasionally for basic features like step tracking.
Describe Tertiary users, and give an example
End users who indirectly interact with your product. They may not actively use the product itself, but are involved in buying it, setting it up, or keeping it running smoothly.
ex: for a fitness app, they could be gym instructors who recommend the app to their students
Describe Stakeholders, and give an example
Not traditional end users, but rather people who have some interest in the product’s success. They may occasionally interact with the product.
ex: for a fitness app, they could be app developers, or advertisers
Give examples of primary, secondary, and tertiary users as well as stakeholders for eClass
Primary: students who log in daily to watch lectures, submit assignments, and participate in discussions
Secondary: instructors who upload course materials, grade assignments, and post announcements but only use a subset of the platform’s features
Tertiary: TAs or IT support staff who help troubleshoot issues or manage course setup
Stakeholders: University administration, the platform provider, funding agencies…
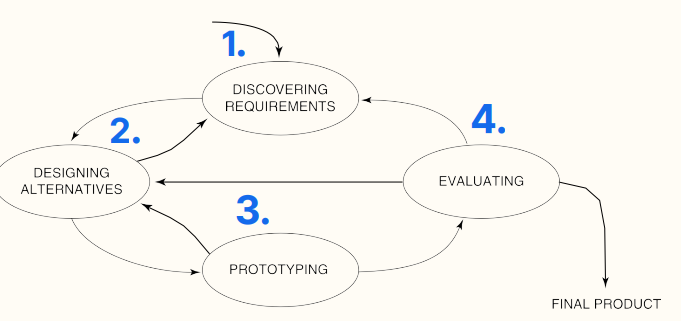
Describe Fidelity in prototyping
Fidelity refers to how closely the prototype resembles the final product in terms of look, feel, and function.
High fidelity resembles the product much more than low fidelity.
What are the 7 design principles? Briefly describe each
Feedback - conveys effects of user’s actions (ex: update users on the status of their meeting requests)
Discoverability - whether it’s possible to figure out how to use an object by interacting with it (ex: use focal points like headers, images, visual hierarchy to make it easier for users to determine possible actions)
Conceptual Model - the design of the system should help convey how it works(ex: onboarding experiences show users how the service works)
Signifier - indicators that communicate the action needed from the user (ex: buttons and visual cues tell users where different actions can occur)
Constraints - restrictions that limit the possible actions available with an object (ex: limit users to one question per step to reduce the likelihood of errors)
Affordance - the possible use for a product when interacting with it (ex: a knob is meant to be turned)
Mapping - indication of the relationship between objects (ex: buttons on screen should match physical buttons)
What are the four types of constraints? Describe each
Physical: use physical features to constrain possible actions (ex: can’t put a HDMI cord into a wall outlet)
Cultural: rely on social/cultural conventions to dictate what is acceptable (ex: red = stop)
Logical: logic dictates what should probably happen (ex: no pieces left when assembling furniture)
Semantic: based on the meaning of the situation
What are the two types of Discoverability? Describe each
Findability: whether it’s easy to find content (ex: an F-shaped pattern works best for web content)
Learnability: whether it’s easy to learn how to use functionality (helps to make use of existing practices and familiar interactions)
What is a Natural mapping? Give an example
Natural mapping is when the system’s controls quickly convey a relationship between the user input and the result. It is meant to reduce the need for any information from a user’s memory to perform a task.
Natural mappings make systems faster to learn and easier to remember
ex: stove where the arrangement of the controls mimics the arrangement of the burners
What is Stimulus-response compatibility?
The degree to which the physical arrangement of the stimuli matches the location of the expected responses. The “naturalness” of the association between a stimulus and its response.
What 3 things can designers do to create natural mappings?
Spatial similarity: By arranging controls in a spatial layout that mimics the design layout, users can understand the system faster (ex: arranging on-screen monitors to mimic the spatial arrangement of the physical monitors helps users move efficiently between monitors)
Conceptual or Metaphorical similarity: take advantage of a commonly accepted metaphor and use that as the basis for design decisions (ex: swiping up the brightness in your iPhone’s control center raises the brightness-up = more)
Behavioural similarity: interface responds in a way that resembles the action that users perform (ex: pinch to zoom in)
What are the 7 Gestalt Principles in UI design? Briefly describe each
The law of Proximity - things that are close together appear to be more related than things that are spaced farther apart (ex: labels are always placed near a text field so that the user perceives it as a single element)
The law of Similarity - when things appear to be similar to each other, we group them together and tend to think they have the same function (ex: text fields are a different colour to a login button so that we know they have different functions)
The law of Focal Point - whatever stands out visually will capture and hold the viewer’s attention first (ex: a sign up button has an eye-catching colour so that the user will find it easily)
The law of Figure-ground - people instinctively perceive objects as either being in the foreground or background (ex: pop-ups look like they are in the foreground)
The law of Common-region - when objects are located within the same closed region, we perceive them as being grouped together (ex: “cards” on a page create a specific region of information)
The law of Continuity - elements that are arranged on a line or curve are perceived to be more related than elements not on the line or curve (ex: dropdown and sub-dropdown menus will stay on the same line as the button that produced them)
The law of Closure - when we look at a complex arrangement of visual elements, we tend to look for a single, recognizable pattern (ex: negative space logos)
What is a persona? What should they include, and what are they used for?
A model of a target customer. Should be like a mini-biography that includes core details like demographics, goals, frustrations, and personality traits. They are used to predict a user’s behaviour by understanding their mental state
What are the 4 types of Personas? Briefly describe each.
Goal-directed Personas: focus on the persona’s goals, and what they would like to do with the product.
Role-based Personas: focus on the user’s role in the organization and their behaviour. These personas are data-driven and incorporate data from qualitative and quantitative sources.
Engaging Personas: incorporate both goal and role-directed personas, as well as traditional rounded personas. These personas examine the emotions, psychology, and backgrounds of the user
Fictional Personas: The only personas that do not emerge from research, but rather the experience of the UX design team. These personas require the team to make assumptions based on past interactions with the user base.
Why are personas helpful?
They allow stakeholders to have a clear picture of who the users are.
They allow us to see users as real people and thus design for a person
What are the 6 Data Gathering techniques discussed in class?
Documentation
Interviews
Questionnaires
Contextual inquiry
Observation
Researching similar products
Describe the Data Gathering technique of Documentation. What are the pros and cons? What should you keep in mind when using?
Documentation is a strategy of Data Gathering involving studying existing documentation.
Pros: good for understanding legislation and getting background information
Cons: No stakeholder time
This technique is not to be used in isolation
What are the two types of Interviewing? What are the pros and cons to each? What should you keep in mind when using each?
Interviews:
Pros: good for exploring issues
Cons: time consuming, and sometimes difficult to visit everyone
Props can be used to elicit responses (ex: sample scenarios and prototypes)
Focus Groups(group interviews):
Pros: useful for gaining a consensus view and/or highlighting areas of conflict
Cons: can be dominated by individuals in a group
Briefly Describe the Data Gathering technique of Contextual Inquiry.
An “Ethnographic” study where the user is the expert, and the designer is an apprentice(designer studies the “master at work”). These interviews are usually a few hours long, and take place at the user’s workplace.
What are the four main principles of Contextual Inquiry?
Focus: to understand what to look for
Partnership: user and designer collaborate
Interpretation: observations interpreted by user and designer together
Context: see the workplace and what happens
Describe the 4-part session structure of Contextual Inquiry
Primer: Ease the participant into the section
Transition: Stop and explain what will happen during the rest of the session and what you need
Contextual interview: Go through multiple iterations of the following pattern:
watch and learn
stop and initiate discussion when the user does something you don’t immediately understand
Wrap-up: Ask any final clarifying questions. Review notes and summarize
Describe the difference(s) between Interviews and Contextual Inquiry
Interviews may take place anywhere, while Contextual Inquiry must take place in the user’s real work environment.
In an interview, you are studying what the users say, while in Contextual Inquiry, you are studying what they do.
Interviews are good for understanding user’s goals, motivations, and opinions. Contextual Inquiry is good for understanding user’s workflows, breakdowns, and hidden practices.
What are the two types of Observation? What are the pros and cons of each?
Direct Observation: researchers observe the actual user
Pros: good for gaining insights into stakeholder tasks, good for understanding the nature and context of the tasks
Cons: requires time from the design team, can result in large amounts of data
Indirect Observation: researchers observe the user’s key logs, metrics, traces…
Pros: good for logging current tasks
How are Questionnaires used? What kind of data do they provide? When are they used?
Questionnaires are often used in conjunction with other techniques.
They can provide quantitative or qualitative data.
They are good for answering specific questions from large groups of people
What are Task Descriptions? What are 3 examples?
Task Descriptions are used to envision new systems or devices. They include Scenarios, Use cases, and Essential use cases
What is Task Analysis used for? What is the most popular technique?
Task Analysis is used mainly to investigate an existing situation/system.
the most popular technique is Hierarchical Task Analysis (HTA)
Describe Hierarchical Task Analysis (HTA). What is it used for?
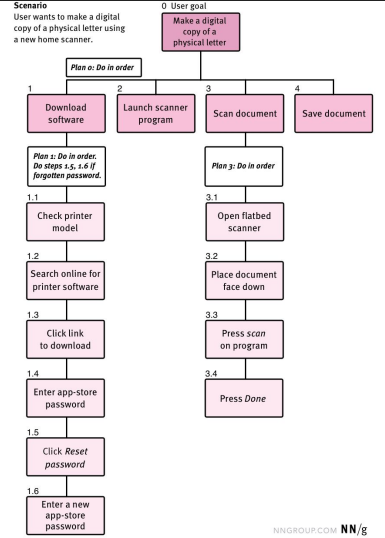
HTA organizes user tasks into goals, subgoals, and steps, forming a clear task hierarchy. You would usually begin with one main goal, and then think of all the smaller subgoals and steps involved with achieving the main goal.
UX designers use HTA to map user behaviour, uncover bottlenecks, and streamlines flows to make interfaces intuitive and efficient.
What is a Scenario?
A Scenario is a concise description/story of someone using a product to achieve a goal.
What are the two types of Data?
Quantitative Data
Qualitative Data
Describe Quantitative Data. Is it measurable? What does it answer? List some examples.
Quantitative data is expressed as numbers.
It is measurable, and can be used to test specific hypotheses.
Quantitative data answers “How much?”
Examples:
Number of clicks
Performance scores
Task durations in seconds
Likert scale responses
Number of successful trials
Describe Qualitative Data. Is it measurable? What does it answer? List some examples.
Qualitative data is expressed as detailed descriptions. It represents themes, patterns, and stories.
It is not measurable.
Qualitative data answers “Why? What?”
Examples:
Area of expertise
Explanation of why someone chose an item
Description of a process
Story describing experiences with technology
Someone’s understanding of how a system works
Differentiate between Subjective and Objective data.
Subjective: an individual's opinion, preference, experience, or judgment; not from some external measure.
Objective: 'external to the mind' and concern facts and measurements.
Give examples of the following types of data:
Subjective-Quantitative
Subjective-Qualitative
Objective-Quantitative
Objective-Qualitative
Subjective-Quantitative: The user rates this system 8/10 for ease of use
Subjective-Qualitative: The user thinks computers are too expensive
Objective-Quantitative: The user took 45 seconds to complete the task
Objective-Qualitative: The user owns an Apple computer
What should you consider when designing a Questionnaire?
Responses can be influenced by order of questions
Provide clear instructions
Balance between whitespace and keeping compact
Wording is very important (pay attention to whether or not your phrases are positive, negative, or mixed)
What are Likert Scales?
Scales that ask about agreement (ex: strongly disagree to strongly agree)
What is the effect when a Likert Scale has an odd vs. even number of options?
Odd: gives the option to be neutral
Even: forces users to “get off the fence”
What are the Limitations of Likert Scales? What can we do about them?
Acquiescence bias: peopleʼs tendency to agree with others. Participants are primed by the positive/negative statement they are presented with. To fix this, your questionnaire should alternate between positively and negatively phrased statements.
Social-desirability bias: desire to report views that will be regarded favorably by others. When respondents feel there is an accepted position, they will be more likely to agree with that position out of fear that disagreement may reflect badly upon themselves. To fix this, don’t ask respondents for their name or identifying information/make sure they know that any identifying information will be removed.
What is a Semantic Differential?
Semantic Differentials are anchored by two opposing poles. They explore bipolar attitudes about a particular item. Each pair of attitudes is represented as a pair of adjectives

Describe how Likert scales and Semantic Differentials differ in the following 4 categories:
Information obtained
Number of options
Labels for options
Limitations
Information obtained
Likert scales obtain an agreement/disagreement to statements
Semantic Differentials obtain where the respondent’s view lies on a continuum between two contrasting adjectives
Number of options
Likert scales typically have 5 options (could be as many as 7 or 9)
Semantic Differentials typically have 7 options (the number can vary, though)
Labels for options
Likert scales: Each option is labelled with words
Semantic Differentials: Two polar sides are labelled, but the options are typically not.
Limitations
Likert scales: Affected by acquiescence bias and social desirability bias
Semantic Differentials: Requires higher cognitive demand to answer unlabeled options.
What are the pros and cons of open-ended questions?
Pros:
Allow users to expand on opinions and give suggestions
Cons:
Time-consuming to fill in and evaluate
Need to be interpreted
What should you keep in mind when making Multiple Choice Questions?
Be specific when possible (ex: 1-3 times instead of “rarely”)
Cover the whole range of possibilities without overlap (ex: 1-2 years, 3-5 years, more than 5 years…)
What are the 3 types of interviews?
Structured: pre-determined set of questions
Unstructured: More like a conversation, can often go into depth
Semi-Structured: Some pre-determined questions, but flexible as situation evolves
Describe Closed and Open questions. Give examples.
Closed: similar to survey questions, not much room to elaborate.
Do you own a smartphone?
How many times a week do you buy coffee?
Open: more room to elaborate
How does buying coffee here compare to other places?
How would you improve the ordering process?
What are two strategies used during Direct Observation in order to get better insight into the user’s decision process and opinions?
Think-Aloud Method: Users are asked to say what they are thinking/doing (what they are trying to do, what they believe is happening…). This gives insight into what the user is thinking.
Co-discovery Learning: Two people work together on a task. The researcher will monitor the normal conversation between the two users. This method removes the awkwardness of think-aloud, and provides insights into the thinking process of both users.
What are 3 ways of Recording Observations? What are the strengths and limitations of each?
Paper and pencil(or laptop):
Limitations: Evaluator seems disengaged, writing is slow
Strengths: Researcher is able to “cut the fat” and only write things that are important
Audio Recording:
Limitations: Hard to synchronize with actions
Strengths: Captures discussion (useful for think-aloud and co-discovery)
Video Recording:
Limitations: Can be intrusive
Strengths: Can see what a user is doing
Give some examples of Performance Data
Timestamps, timing
User clicks, selections, data entries
Scores
Task outcomes
Give some examples of Physiological Data
Eye tracking
Heart and breathing rate
ECG(cardio), EEG(brain)
Motion
Skin conductance
What are the 4 types of User Studies?
Lab-based/Controlled: direct observations in lab
Field-based: deployed in regular settings
Web-based/Remote: uncontrolled environment
Crowd-Sourced: large-scale data collection
What are the Characteristics and Potential Drawbacks of Lab-Based/Controlled user studies? What are they used for?
Characteristics:
Controlled environment
Direct observation, “think-aloud”
Potential Drawbacks:
Realism can be difficult to achieve
Novelty effects (“hey, this is cool"!”)
Used for:
Measuring performance & improvements
Discovering usability problems
What are the Characteristics and Potential Drawbacks of Field-Based user studies? What are they used for?
Characteristics:
Deployed in regular setting
More ecologically valid
More expensive and time-consuming
Potential Drawbacks:
Riskier for security, privacy
Influenced by outside factors
Messier data
Used for:
Evaluating real-world usage
What are the Characteristics and Potential Drawbacks of Web-Based/Remote user studies? What are they used for?
Characteristics:
More natural setting
Uncontrolled environment(realistic)
Can prompt to complete tasks, screenshare…
Potential Drawbacks:
More difficult to observe
Technical challenges
Used for:
More convenient than lab studies
Middle ground between lab and field studies
What are the Characteristics and Potential Drawbacks of Crowd-Sourced user studies? What are they used for?
Characteristics:
Fast and cheap data collection through online crowdsourcing
Potential Drawbacks:
Data quality
Need fully automated study protocol
Used for:
Quickly gathering large amounts of data
Studies that can be broken into small tasks
If you wanted to test your app with many students using their own devices, which type of user study would you use?
Crowd-sourced or Web-based/Remote
If you wanted to understand how well your target audience can use a specific feature, which type of user study would you use?
Lab-based/Controlled — otherwise, we would miss close observation, facial expressions, and mis-clicks. When trying to see how easily used a feature is, you want to be able to observe your user well, and you want minimal distractions.
If you wanted to understand how your target audience uses a specific feature in their natural environment, which type of user study would you use?
Field-based. Your user may behave differently in a lab vs. a normal environment
Describe Within-Subjects Design and Between-Subjects Design. What are the pros and cons of each?
Within-Subjects Design: The same participant tests all conditions, and is exposed to every user interface
Pros:
Need fewer participants
Can see variation in performance across conditions per participant
Eliminates variation of participants between conditions
Cons:
Ordering effects (users may be more fatigued on the 2nd test than the 1st)
Training effects (user already learned the first interface, so if the 2nd is similar the experience will translate)
Can’t compare different groups of people
Between-Subjects Design: Different people test each condition, so that each person is only exposed to a single user interface
Pros:
No ordering or training effects
Shorter study sessions per participant
Easy to set up
Cons:
Need more participants
Chance of variations between subjects
What are User Experiments in HCI?
User Experiments in HCI are used to predict the relationship between two or more variables
What are independent variables? Give examples
Independent variables are manipulated by the researcher (ex: type of input: mouse vs. stylus)
What are dependent variables?
Dependent variables are what you are measuring, and depend on the user (ex: time, number of errors, preference)
What is Attitudinal Research? What is Behavioural Research?
Attitudinal Research: Research that focuses on understanding or measuring people's stated beliefs. It is limited by what people are aware of and willing to report.
Behavioural Research: Research that focuses on understanding "what people do" with the product or service in
question.

Where would the following types of user studies fall on this chart?
Contextual inquiry
Interviews
Surveys
Eyetracking
Clickstream/Analytics

What is Research Ethics? What are the 3 core ideas?
Principles and practices that guide researchers in conducting research responsibly, respectfully, and safely, particularly when research involves human participants.
Respect for people
Minimize harm
Justice and fairness
How can we abide by the principle “Respect for People”?
Obtain informed consent
Participation should be voluntary
Participants can withdraw
Respect participants’ autonomy and dignity
How can we abide by the principle “Minimize Harm”?
Identify potential risks before the study
Minimize physical, psychological, social, financial, and privacy risks
Benefits should justify the risks
How can we abide by the principle “Justice and Fairness”?
Don’t disproportionately burden vulnerable groups
Don't unfairly exclude relevant populations
Ensure benefits and burdens of research are distributed appropriately
What are the two branches of Quantitative Data Analysis? Briefly describe each
Descriptive analysis: Methods to summarize or describe attributes of your data set (ex: key states like frequency, mean, mode…)
Inferential analysis: Methods that let you draw conclusions from statistics, like analyzing the relationship between variables or making predictions. (ex: t-tests, ANOVAs…)
When do we use Descriptive statistics? When do we use Inferential statistics?
Descriptive:
To assess data quality and structure
To describe population characteristics
To assess dependence among variables
Inferential:
To test hypothesis
To estimate parameters
To perform clustering or classification
Should you use Descriptive or Inferential analysis if you…
want to report the average time students spent completing a usability task in your study?
Descriptive (summarizing observed data)
Should you use Descriptive or Inferential analysis if you…
want to know whether Interface A is significantly faster than Interface B
Inferential (comparing groups & testing hypothesis)
Should you use Descriptive or Inferential analysis if you…
want to test whether user satisfaction differs by experience level
Inferential (relationship between variables)
Should you use Descriptive or Inferential analysis if you…
want to summarize participant’s demographic breakdown
Descriptive (describing the dataset)
What are the three things that are typically looked at with Descriptive statistics? Briefly describe each.
Distribution: what does our distribution look like?
Central tendency: where is the majority of our data?
Dispersion: how much does the data deviate from the center?
What is Central tendency? What are the 3 ways to calculate a central value?
Numerical values that are used to represent a large collection of numerical data by finding the central value.
There are 3 ways to find this central value:
Mode: the value that appears most often in the data
Median: the middle value of data when all values are ordered
Mean: the arithmetic average (add up all values then divide by the number of data points)

What is Range in terms of dispersion?
the difference between the smallest and largest values
What are Quartiles in terms of dispersion?
Quartiles break the distribution into 4 equally sized parts
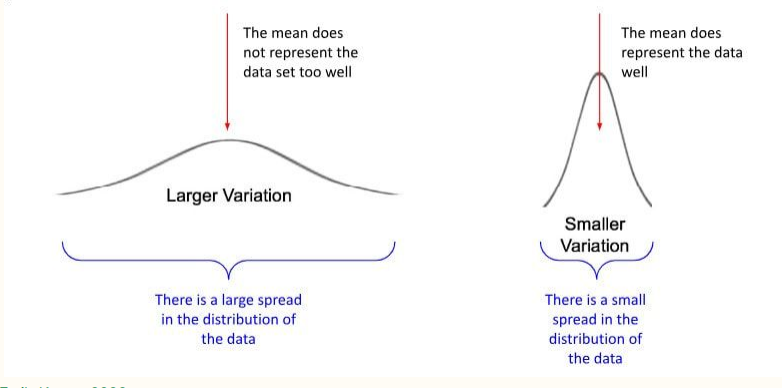
What is Variance in terms of dispersion?
The squared deviation of the variable from its mean.
If the variance is small, it means most numbers are close to the mean, and there is less variation between values. If the variance is large, it means the numbers are spread out more widely, and there is more variation between values.
What is Standard Deviation in terms of dispersion?
Standard Deviation measures the amount of variation in values
What are the 2 main types of Hypotheses(about a population)? What are the two sub-types?
Null Hypothesis: States that a population parameter (ex: the mean) is equal to a hypothesized value
Alternative Hypothesis/Research Hypothesis: States that the population parameter is smaller, greater, or simply different than the hypothesized value in the null hypothesis
One-sided hypothesis: the population parameter differs in a particular direction (ex: higher or lower)
Two-sided hypothesis: the population parameter differs in a nondirectional way (ex: unequal)
Which type of hypothesis is this?
The SUS scores of Google Maps and Apple Maps will not differ
Null Hypothesis
Which type of hypothesis is this?
Users will file their taxes faster using TurboTax 2020 than they will using TurboTax 2019
One-sided hypothesis
Which type of hypothesis is this?
The usability of Google Docs and Microsoft Word will be rated differently by users
Two-sided hypothesis
Which type of hypothesis is this?
Users will reach targets faster using a mouse than a joystick and fastest using a touchpad
One-sided hypothesis
What is a t-test?
A t-test is an inferential statistical method used to determine whether the difference between two averages is likely to be real (significant) or just due to random chance.
Answers questions like: “Is Interface A actually faster than Interface B, or did this difference just happen by chance in our small study?”
What does it mean for a difference to be statistically significant? What is this determined by?
A difference is statistically significant if the likelihood of it occurring by chance is low.
This is determined by a margin, called α. Typically, α = 0.05. Thus, the probability, p, that the difference is occurring by chance has to be p < 0.05 for it to be statistically significant.
When should you use a t-test?
You are comparing two conditions or two groups
Your outcome variable is numeric (e.g., time, errors, score)
You want to know whether the observed difference is statistically significant
What are the two types of t-tests?
Unpaired t-test: When the data in the two distributions come from different populations (between-subjects)
Paired t-test: When the data in the two distributions come from the same population (within-subjects)
What are the 6 Types of Data in Qualitative Analysis?
Written notes from observations/interviews
Audio recordings
Video recordings
Diary recordings
Written answers to questionnaires
Artifacts, photos (ex. from design workshops)
What are the two Qualitative Data Analysis methods discussed in class?
Thematic Analysis
Grounded Theory
What is the goal of Thematic Analysis?
To discover key patterns that tell a narrative in your data
List and describe the 5 steps of Thematic Analysis
Familiarize yourself with the data
immerse yourself in your transcripts through repeated reading and note-taking to identify initial ideas and patterns
Generate initial codes
identify and label your data with codes that capture the key concepts, patterns, or features you observe.
Collating codes with supporting data
group related excerpts by code, ensuring each one is linked to a specific idea or pattern you want to explore further.
Grouping codes into themes
organize the codes into broader themes, finding patterns that connect related concepts and highlight key insights in your data.
Reviewing and refining themes
refine and revise your themes by ensuring theyʼre distinct, well-supported, and relevant to the research question, merging or eliminating themes as needed.