Lecture 4: Estimating with Uncertainty
 Call Kai
 Learn
Learn Practice Test
 Spaced Repetition
 Match
Match Flashcards
 Knowt Play
1/4

There's no tags or description
Looks like no tags are added yet.
Name | Mastery | Learn | Test | Matching | Spaced | Call with Kai | Chat |
|---|
No analytics yet
Send a link to your students to track their progress
5 Terms
What is a sampling distribution?
A specific type of probability distribution that describes how a sample statistic varies across repeated random samples from a population.
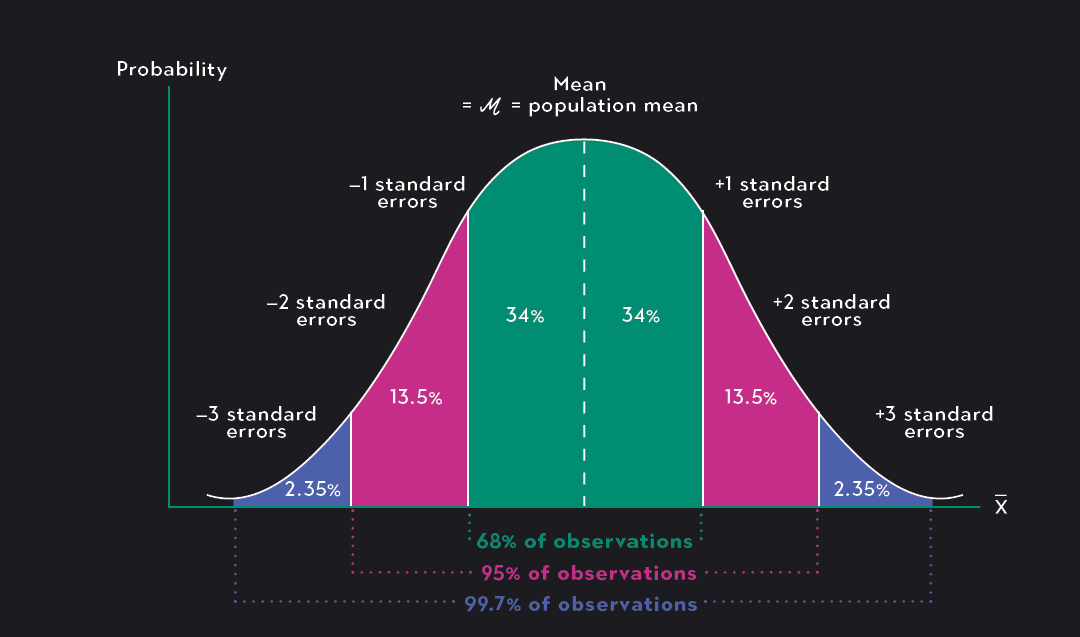
How can we quantify uncertainty in an estimate of a population parameter?
Standard Error (SEŷ): The standard deviation of a sampling distribution, reflecting the precision of an estimate (use S instead of σ).

Confidence Interval (CI): A range of values likely to contain the true population parameter (μ).
For a large sample (n ≥ 30), the multiplier is approximately 2:
CI = ŷ ± 2 × (SEŷ)
For a small sample (n < 30), use a t-multiplier from the t-table:
CI = ŷ ± t × (SEŷ)
Note: Use df = n − 1 and the desired confidence level (e.g., 95%) to find t.
What do error bars show us about our estimate of a population parameter?
Error bars provide a graphical way of showing variability or uncertainty in an estimate of a population parameter.
Note: The same dataset can have different length error bars depending on what they represent. SE and CI show the uncertainty of an estimate, while SD, range, and quartiles show the spread of the original data.
SE/CI = quantify uncertainty; error bars = visually display that uncertainty.

What is pseudoreplication?
Pseudoreplication occurs when multiple measurements from the same sampling unit are treated as independent replicates, artificially inflating sample size and overstating precision.
How does sample size affect precision?
Larger sample sizes increase precision by reducing standard error and therefore narrowing the confidence interval.