Correlations and Inferential Stats Tests
 Call Kai
 Learn
Learn Practice Test
 Spaced Repetition
 Match
Match Flashcards
 Knowt Play
1/15

Earn XP
Description and Tags
Includes distribution, references and peer review
Name | Mastery | Learn | Test | Matching | Spaced | Call with Kai | Chat |
|---|
No analytics yet
Send a link to your students to track their progress
16 Terms
Differences between a correlation and an experiment
Difference between two conditions of an IV, relationship between two co variables
IV is manipulated, DV measured, no IV or DV but covariables
Cause and effect, no cause and effect
Uses graphs and bar charts, uses scatter graphs
Both use a null hypothesis which aims to be disproven
Features of a correlation
Stats tests can be applied: Spearmans, Pearsons
Correlation coefficients can be established- these tell us the strength and direction of the relationship
Ranges from -1 to +1
Closer to -1 is strong negative, closer to +1 is strong positive
Strengths: doesn’t require the IV to be manipulated- more ethical and in further research the correlation can be demonstrated experimentally
Weaknesses: cannot establish cause and effect and self report data (people could lie- data is unreliable and meaningless)
Hypothesis: there will be a (positive) relationship/correlation between the two co variables
A perfect correlation goes straight from the middle
What are descriptive statistics?
Allow us to summarise a set of data:
Measures of central tendency
Mean, median, mode
Measures of dispersion
Range, standard deviation
What are inferential statistics?
Used to draw conclusions about a null hypothesis- accept or reject
Inferential stats tests
What are the level of measurement data?
Nominal data: frequency count
Ordinal data: rating or ranking
Interval level data: universally recognised units of measurement with equal units between each measure eg speed, weight, seconds
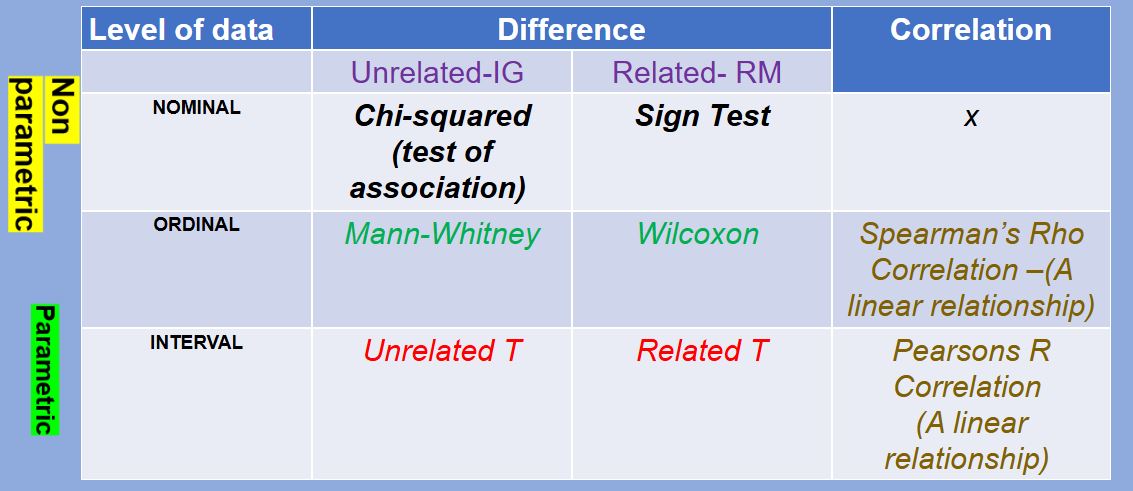
How to choose a stats test?
Level of measurement (nominal, ordinal, interval)
Correlation or experiment (if correlation use Pearson’s if both sets of data are interval level, use a Spearman's test if not) - looking for a difference or association
If experiment, independent groups of repeated measures design
How to carry out a Spearman’s Rho stats test?
Decide whether the hypothesis requires one tailed or two tailed test + how many participants
Assume p=0.05 unless stated otherwise
Find the critical value from the Spearman’s Rho table
Decide whether the calculated value is significant (if it is more than the critical value)
Accept or reject the null hypothesis
How to carry out other stats tests?
Use the same method
Some may use N1 and N2 for the number of ps which need to be cross-referenced, chi-squared uses degrees of freedom (df)
Different tests may require the calculated value to be more or less than the critical value
The significance statement framework
The calculated value is ___. The critical value is ___ (N= ,__-tailed, __%). The calculated value is greater/less than the critical value so the null hypothesis is accepted/rejected. Therefore we can conclude (reinstate the hypothesis you are accepting-either null or alternative)
What does the p=0.05 mean in inferential stats tests?
Psychologists are 95% sure that the manipulation of the IV has caused the change in DV
5% chance that other factors eg extraneous variables influenced our findings
What are the symbols for each statistical test?
Chi-squared X2
Spearman’s rs or rho
Wilcoxon T
Mann-Whitney U
Sign test S
Pearson’s R r
Related T t
unrelated T t
What are type 1 errors?
This is when the null hypothesis is falsely rejected due to a mistake telling you the result is significant
A false positive where the researcher incorrectly concludes there is an effect
This could be due to too lenient of a significance level e.g. 10% or confounding variables
e.g. caffeine and coffee in IG design on memory test- people recalled better due to participant variables (people with better memories in one group) not caffeine
What are type 2 errors?
The null hypothesis is falsely accepted - a false negative where a real effect exists but is undetected
Could be due to too strict a significance level eg 1% or confounding variables
Ps given 3 minutes to learn list of words which is too long- caffeine would have no effect but it would if the study had been planned better, too small sample
Difference between a parametric and non-parametric statistical test
A parametric test is used to identify differences between two related conditions using interval level data
A non-parametric test is used when data does not meet the assumptions required for parametric tests
Describe how to carry out a sign test
Used for nominal level data and repeated measures design and experiment (difference)
Convert raw data to nominal by recording a positive or negative sign
Ignore any 0 values (stay the same) and exclude these from the n value
If using a table, see if the values have increased (+) or decreased (-) and count the number of times the signs appear
Calculate the value of S- this is the number of times the less frequent sign or value occurs (this is the calculated value)
Compare this with the critical value and accept or reject the null
What are normal and skewed distributions?
Normal distribution: mean, median and mode are in the middle
Positive skewed: P that has fallen backwards with mode at the hump, then median, then mean further down
Negative skewed: mode at hump, then median and mean down the curve