Stats Exam 3
 Call Kai
 Learn
 Practice Test
 Spaced Repetition
 Match
 Flashcards
 Knowt Play
1/107

There's no tags or description
Looks like no tags are added yet.
108 Terms
what does a probability describe?
proportion of times that an outcome occurs
what is a proportion based on?
data from many repetitions (relative frequency) or based theory (theoretical)
why do we use simulations?
to find probabilities in complex situations
probabilities range from
0 to 1 or 0% to 100%
what is theoretical probability
calculated using a mathematical model, for equally likely outcomes divide favorable outcomes by total possible outcomes
difference between relative frequency and theoretical probability
relative =results theoretical =theory
what do probabilities of 0, 0.5, and 1 mean
0 means impossible under the model 0.5 means a 50% chance and 1 means certain under the model
what does the law of large numbers say
as a chance process is repeated many times the proportion of times an event occurs tends towards its probability
why does the law of large numbers matter
explains why larger samples give more reliable averages
what is a simulation
a way to imitate chance behavior
how could random digits simulate a 70% chance of success
assign 0-6 to success and 7-9 to failure, seven of the ten equally likely digits represent success
how could numbers 00-99 simulate four equally likely card suits
assign 00-24, 25-49, 50-74, and 75-99
what is one difference between a simulated outcome and repetition
outcome might represent one shot, repetition must imitate the entire situation
what does independent mean
knowing that one event occurred does not change the probability of the other event
what is the complement rule
P(not A) = 1-P(A)
if chance of rain is 0.30 the chance of no rain is 0.70
what is expected value
the long-run average numerical outcome of a chance process repeated many times
what is the expected value formula
expected value= a1p1+a2p2+…+akpk
what steps do you follow to find expected value
list possible numerical outcomes, find probabilities, multiply and add
is the expected value the same as the most likely outcome
no, expected value is a weighted average and the most likely outcome is the outcome with the highest probability
what is a two way table
a table showing counts for combinations of two categorical variables, such as study and pass/fail status
two way tables include
— rows and ll columns
expected count formula
expected count= row total x column total/table total
what do you calculate for each cell
expected count
how do you find a missing count in a row
subtract the other counts in that row from its row total
what is the chi-square statistic χ²
a measure of how far the observed counts in a two way table are from the expected counts
what should you recall when thinking about chi square statistic
statistic is a value calculated from a random sample, value changes from sample to sample, and will have a distribution
specific chi square distributions are specified by giving its
degrees of freedom
degrees of freedom formula
df= (r-1)(c-1)
of 100 students, 40 studied, 60 passed, and 36 both studied and passed. among those who studied, what percent passed?
36/40 × 100= 90% the denominator is the number who studied
what does independence mean for two categorical variables
the distribution of one variable is the same across categories of the other, knowing one category does not change the probabilities for the other variable
the chi square distributions are a family of distributions that take only
positive values and are skewed to the right
what tells you if a chi square value is dependent or independent
5% or less= not dependent (two variables related) 5% or more= independent (not related) (looking at a 95% confidence interval)
chi square statistic is calculated as
χ2=E (observed count-expected count)2/expected count

what are the steps for a significance test
H₀ no relationship between 2 variables
Hₐ some relationship between 2 variables
H₀: null hypothesis= being tested in a statistical test
Hₐ: alternative hypothesis= the statement we hope or suspect is true instead of H₀
chi square > critical value =
dependence
to find a chi square critical value
1. calculate DF 2. find significance level (chart) 3. use the chi square table to find where they meet
in statistical inference, we sample a population then based on that sample
attempt to infer something about the entire population
what does statistical inference draw
conclusions about a population on a basis of sample data
what is a population
the entire group that a statistical question is about
what is a sample
the subset of the population actually observed or studied
what is a parameter
a numerical characteristic of a population, such as the proportion of all students who support a policy
what is a statistic
a numerical characteristic calculated from a sample, such as a proportion of 50 surveyed students who support a policy
what do p and p-hat represent
p is the population proportion, a parameter. p-hat is the sample proportion, a statistic used to estimate p.
how do you calculate p-hat
divide the number of sample successes by the sample size: p-hat= x/n
what is sampling variability
different random samples from the same population produce different values of a statistic
what is a sampling distribution
the distribution of a statistic across many possible samples of the same size from the same population
a statistic is a random sample used to
estimate population parameter
what is the mean of the sampling distribution of p-hat
the population proportion p.
what is the standard deviation of p-hat under independent sampling
square root of p(1-p)/n
recall that 95% of a normal distribution falls within the mean
±2 standard deviation
what does 0.60 ± 0.04 give as an interval
0.56 to 0.64, or 56% to 64%
in sample size:
increasing n generally makes confidence intervals narrower
in confidence level:
increasing confidence makes intervals wider
in correlation
r ranges from -1 to 1
in regression you have to understand
slope, intercept, and r squared
a survey of 500 college students finds that 65% prefer online classes. researchers want to estimate the percentage of ALL college students who prefer online classes. what do you use
confidence interval for proportion, you are estimating a percentage
a company records the average amount of soda in 40 bottles and wants to estimate the truge average fill amount. what do you use
confidence interval for mean
researchers want to determine whether gender and preferred social media platform are associated, what do you use
chi square, test of independence
a game has a 20% chance of winning $50 and an 80% chance of winning $0. what is the average payout over many plays
expected value, asks for the long-run average outcome
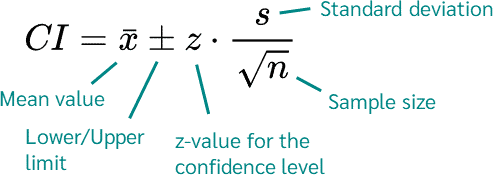
what formula is this? its a 2 not a Z
95% confidence interval for the mean
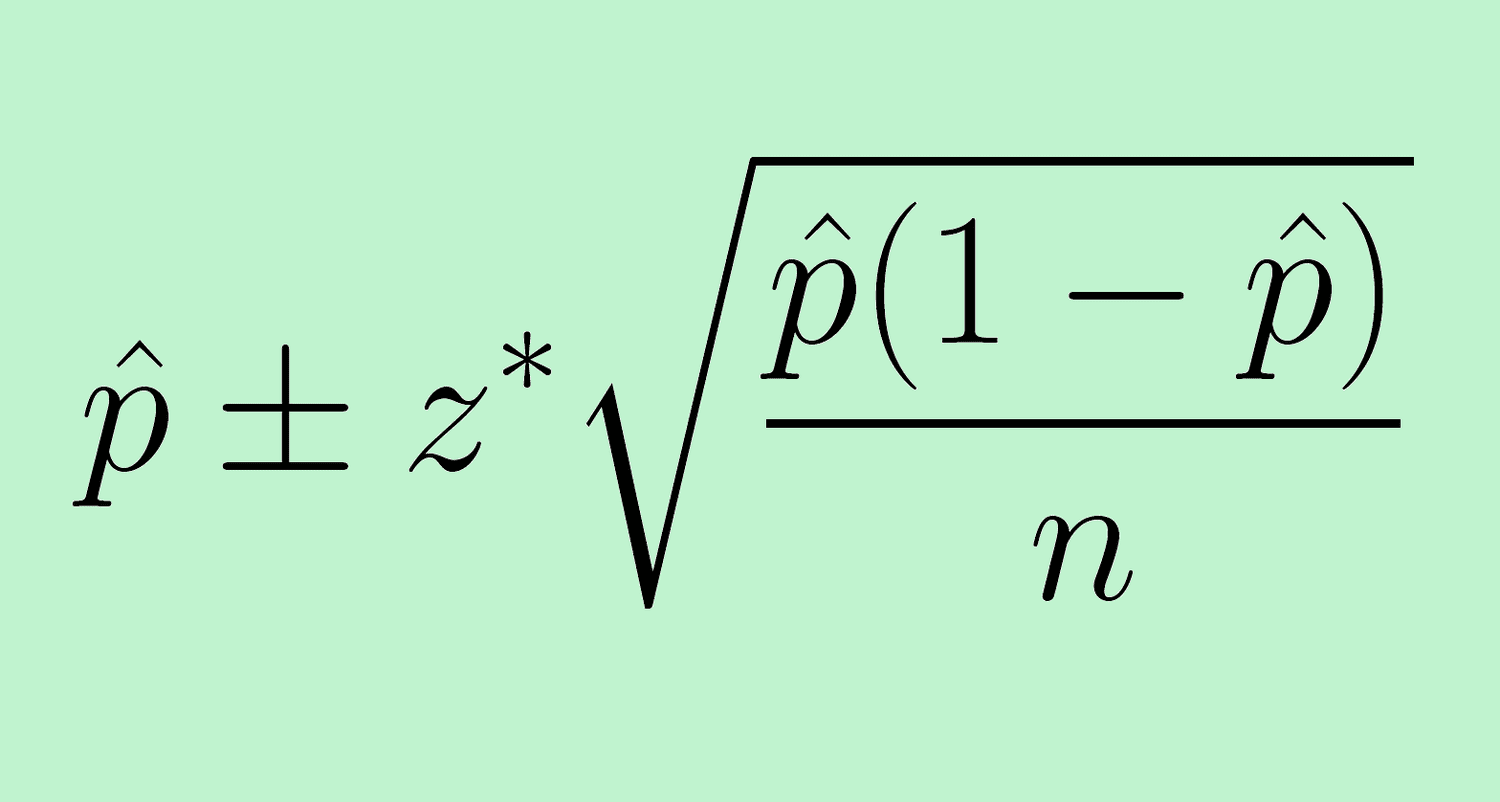
what formula is this
general confidence statement for p. used when estimating a percentage
what is z star
critical value (depends on confidence level)(check chart)
how should you interpret a 95% confidence interval from 56% to 64%
we are 95% confident that the population proportion is between 56% and 64% (specify the population and characteristic in the actual problem
what does the 95% confidence level describe
if we repeatedly took random samples and built intervals using this method, about 95% of the intervals would contain the true population parameter
does a 95% confidence interval contain 95% of individual observations
no it estimates a population parameter, such as proportion or mean; it does not describe where 95% of individual values fall
what happens to an interval when the confidence level increases, using the same sample and method
it becomes wider, greater confidence requires a larger margin of error
what happens when the confidence level decreases, using the same sample and method
the center stays the same, but the margin of error decreases making the interval narrower

what is this
population mean, the mean of the sampling distribution
what is the central limit theorem
when the sample size is at least 30 the sampling distribution of the sample mean is approximately normal
what is x̄
sample mean
what is s
sample SD
what is n
sample size where n is greater than or equal to 30
what does a hypothesis test check
sample data against a claim or assumption about the population
claim or assumption being tested is called null hypothesis, such as
Ho: p= 0.05 always status quo (equal sign)
3 possible alternative hypotheses for p=0.05
Ha: p< 0.05 Ha: p> 0.05 Ha: p is not equal to 0.05
should hypotheses about a proportion use p or p-hat
use p because hypotheses concern the population proportion, p-hat is the sample result used as evidence
what is p-value used for
to summarize the amount of evidence against null hypothesis
p- value is
the probability that we would see a statistic at least as extreme as the one observed if the null hypothesis was true
the smaller the p-value the
more evidence against the null hypothesis
if p-value < α then
reject null and alternate true
what is the difference between a confidence interval and a hypothesis test
a confidence interval estimates a parameter with a range of credible values, a hypothesis test evaluates evidence against a particular claim

what is a scatterplot used for
displaying the relationship between two quantitative variables measured on the same individuals
what is an explanatory (independent) variable
the variable used to explain or predict another variable, x axis
what is a response (dependent) variable
the outcome being explained or predicted, y axis
interpreting scatterplots look for:
overall pattern, outliers, striking deviations
what is positive association in a scatterplot
larger x values tend to occur with larger y values, generally rises left to right
what is negative association in scatterplots
larger x values tend to occur with smaller y values, generally falls left to right
what does correlation r describe
direction and strength of a straight- line relationship between two quantitative variables
what values can r take
any value from -1 to 1
which correlation is stronger: -0.90 or 0.40
-0.90 because it is further from 0
r= 0 means
no linear association
what do r=-1 and r=1 mean
perfect straight line
r is strongly affected by
outliers
r has no
units and wont change
what is confounding
the effects of explanatory factors on a response cannot be clearly separated, making it difficult to determine which factor accounts for an observed result
what is regression used for
predicting the value of a quantitative response variable from an explanatory variable
the least-squares regression line of y on x is the
line that makes the vertical distances of the data points from the line as small as possible
what is a regression line
a straight line that describes how a response variable (y) changes as an explanatory variable (x) changes
equation of a regression line
y= a+bx
in the regression line equation y= a+bx what do they represent
a is the y-intercept (value of y when x=0), b is the slope (amount by which y changes when x increases one unit) and y is the predicted response