Stats
 Call Kai
 Learn
 Practice Test
 Spaced Repetition
 Match
 Flashcards
 Knowt Play
1/64

Earn XP
Description and Tags
-flashcards made so far from lecture 1 to 4-
65 Terms
IV, DV and CV
Independent → The thing that is changed
Dependent → The thing that is measured
Control → Everything that should remain the same between test
Which types of data are continuous and which are categorical?
Continuous → Interval and Ratio
Categorical → Nominal and Ordinal
Interval data
Quantitative data measured along a scale where each point is placed at an equal, standardized distance from adjacent values, but has no true or absolute zero point
Ratio data
Quantitative data measured along a scale where each point is placed at an equal, standardized distance from adjacent values, and has a meaningful zero (where zero represents a complete lack of something)
Nominal data
Qualitative, categorical data used to label or name variables without any quantitative value, ranking, or natural order
Ordinal data
Qualitative, categorical data used to label or name variables with a natural order (e.g. disagree, neutral, agree)
Correlational design
All variables are measured to examine a relationship between variables → non of the variables are manipulated
Experimental design
An experimental design involves manipulating an independent variable and measuring its effect on a dependent variable. Random assignment and appropriate controls strengthen causal conclusions.
Between vs within subjects
Between-subjects (Independent groups) → Different participants in different groups
Within-subjects (Repeated measures) → Same participants in one group
Inferential statistics
Using research methods and statistical analyses, we can infer information about a population based upon the findings of our sample. We can generalise the findings from our sample to a population.
Descriptive statistics
Tells us information about our specific group (our sample). Helps us to explore, summarise, organise and simplify data.
Unimodal, bimodal, and multimodal distribution

What is skewed data? What are the types?
A set of data where the distribution is asymmetrical instead of forming a balanced bell curve

What is kurtosis? What are the types?
A statistic used to describe the shape of a distribution of continuous data. It measures the tendency of the data to be distributed toward the tails, or ends, of the distribution versus toward the middle.

What is the difference between a one tailed and two tailed hypothesis
One tailed → One population mean is greater than or less than the other → Example: Drug A will be better than Drug B (direction)
Two tailed → Two populations are different from one another → Example: Drug A and B will have different effects (no direction)

What is a type one and a type two error
Type 1 error → We believe there is an effect, but in reality there isn’t. → Rejection of a true null hypothesis
Type 2 error → We believe there is no effect, but in reality there is. → Failing to reject a false null hypothesis

What is meant by the statistical power of a test?
Statistical power is the probability that a statistical test will correctly detect a real effect or difference when one actually exists
Define standard deviation
A measure of how spread out a set of scores is around the average, or mean
What does a high or low standard deviation mean?
Low Standard Deviation: Scores cluster around the mean, meaning participants behaved very similarly.
High Standard Deviation: Scores spread out across a large range, meaning there is high variability among participants.
Define a T-test
An inferential statistical test used to determine whether there is a statistically significant difference between the means of two groups
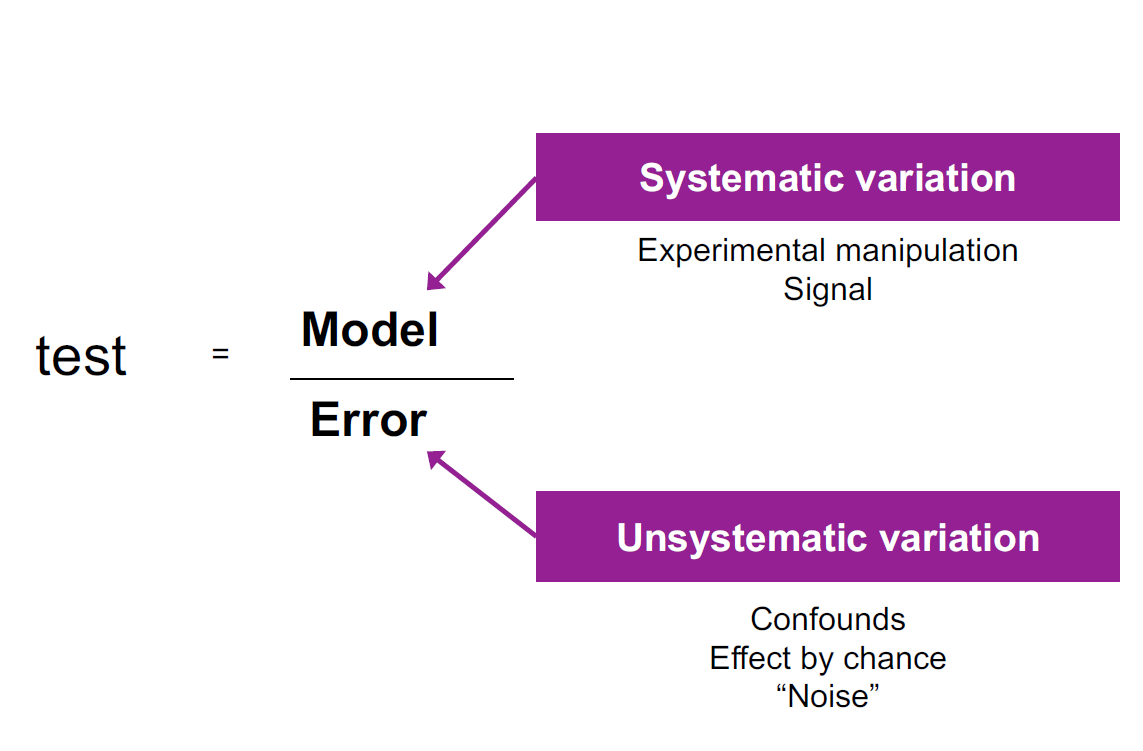
What is standard error?
A statistical measure that tells you how far your sample mean (average) is likely to be from the true average of the whole population
It is inversely proportional to the (square root of the) sample size, meaning that smaller samples tend to produce greater standard errors
What is the standard error of the differences in means?
How much we expect the means of different samples, drawn from the same distribution, to differ from each other
What is the difference between an independent and dependent t-test

What are the three types of t-test
One sample | One sample, compared with known population mean | Comparing the acidity of a liquid to a neutral pH of 7 |
Independent sample (Between subjects) | Different samples of participants experience each level of IV | Comparing the academic performance of online vs. on-campus students |
Paired/dependent sample (Within-subjects) | Same or related samples of participants experience each level of IV | Comparing the happiness score before and after eating chocolate |
What is a p-value? (t-tests)
A measure of how likely your observed results (or more extreme ones) would be if the null hypothesis were true. e.g. null hypothesis = no relationship so if it is likely a statistical relationship is shown when null hypothesis is true this means results can’t be trusted
How do we know if a t-test is statistically significant?
Statistically Significant (p ≤ 0.05): If your p-value is lower than or equal to 0.05, the result is considered statistically significant.
Not Significant (p > 0.05): If the p-value is higher than 0.05 there is insufficient evidence to reject the null hypothesis
What is a z-score? (t-tests)
A statistical measure that describes the position of a raw score in terms of its distance from the mean
What are the four assumptions of data in a t-test
Are independent
Are (approximately) normally distributed (no outliers!)
Have a similar amount of variance within each group being compared (i.e. homogeneity of variance; for between subjects)
DV needs to be continuous; IV needs to be categorical
What is a parametric test?
A type of statistical hypothesis test that assumes the underlying data follows a specific probability distribution (most commonly a normal or bell-shaped distribution) and makes inferences about population parameters like the mean and standard deviation
What is a non-parametric test?
A statistical hypothesis test that makes few or no assumptions about the underlying population distribution
How are t-test assumption checked?

Define degrees of freedom
The number of scores that are free to vary when estimating a population parameter from a sample
What is ANOVA
Analysis of Variance (ANOVA) is a family of statistical tests that are useful when comparing several sets of scores → means of three or more groups
The basic idea behind ANOVA is a comparison of the variance between the groups and the variance within the groups
(NOTE: No restriction on number of means (as many groups as you wish)
NOTE: Allows us to use more than one independent variable)
What are the null and alternative hypotheses for ANOVA
Null hypothesis → there is no significant difference among the groups
Alternative hypothesis → assumes that there is at least one significant difference among the groups
What is the F statistic? (ANOVA)
The ratio of the Between Group Variation to the Within Group Variation
(If the Between Group Variation is significantly greater than the Within Group Variation, then it is likely that there is a statistically significant difference between the groups)

What are the assumptions of data of an ANOVA

What is sphericity?
A key assumption in a repeated-measures ANOVA (with three or more levels). It means that the variances of the differences between all pairs of within-subject conditions are equal
If an assumption is violated, what do you do?
• Data transformation
• Use a non-parametric test instead
• Alternative test
Define post-hoc tests
Statistical follow-up tests used after an omnibus test - such as an Analysis of Variance (ANOVA) - shows a statistically significant overall difference among three or more groups, but does not specify which particular groups differ from one another