ch 4 Maco Econ
 Call Kai
 Learn
Learn Practice Test
 Spaced Repetition
 Match
Match Flashcards
 Knowt Play
1/44

There's no tags or description
Looks like no tags are added yet.
Name | Mastery | Learn | Test | Matching | Spaced | Call with Kai | Chat |
|---|
No analytics yet
Send a link to your students to track their progress
45 Terms
When the price of a product is increased 10 percent, the quantity demanded decreases 15 percent. In this range of prices, demand for this product is:
Elastic
If the price elasticity of demand for a product is equal to 0.5, then a 10 percent decrease in price will increase quantity demanded by:
5 percent
A straight-line downward-sloping demand curve has a price elasticity of demand which:
Decreases as price decreases

Refer to the graphs above. Which demand curve is relatively most elastic between P1 and P2?
D1
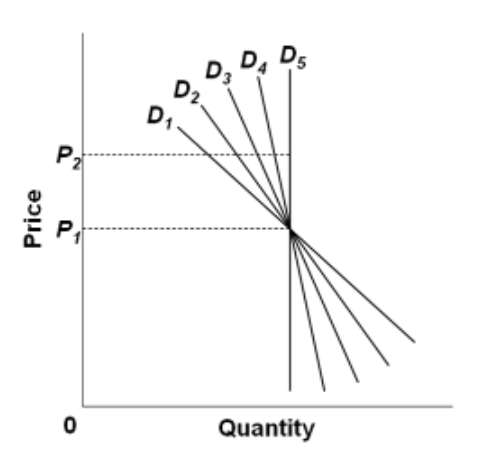
Refer to the graphs above. Which demand curve is perfectly inelastic?
D5
Which is inconsistent with an elastic demand curve?
The price-elasticity coefficient is less than 1
Block's sells 500 bottles of perfume a month when the price is $7. A huge increase in resource costs forces Block's to raise price to $9 and the firm only manages to sell 460 bottles of perfume. The price elasticity of demand is:
.33 and inelastic

Suppose you are given the following data on demand for a product. The price elasticity of demand (based on the midpoint formula) when price decreases from $9 to $7 is:
1.60
When the price of candy bars decreased from $.55 to $.45 the quantity demanded changed from 19,000 per day to 21,000 per day. In this price range, the price-elasticity coefficient (based on the midpoint formula) for candy bars is:
0.5

Consider the parallel demand curves in the figure above. Which curve is relatively more elastic at P1?
BB

Refer to the graphs above. A price increase from $20 to $40 causes quantity demanded to decrease from 100 units to 50 units. Which graph best illustrates the demand for this good?
Graph B

Refer to the graphs above. Which one shows a perfectly elastic demand?
Graph A

Refer to the graphs above. Which one shows demand with a price-elasticity coefficient equal to zero?
Graph C

Refer to the graphs above. Which one shows a situation where buyers are all willing to pay one uniform price for the product?
Graph A
If a 5 percent cut in the price of a product causes the quantity demanded to rise by 10 percent, the demand is:
Elastic
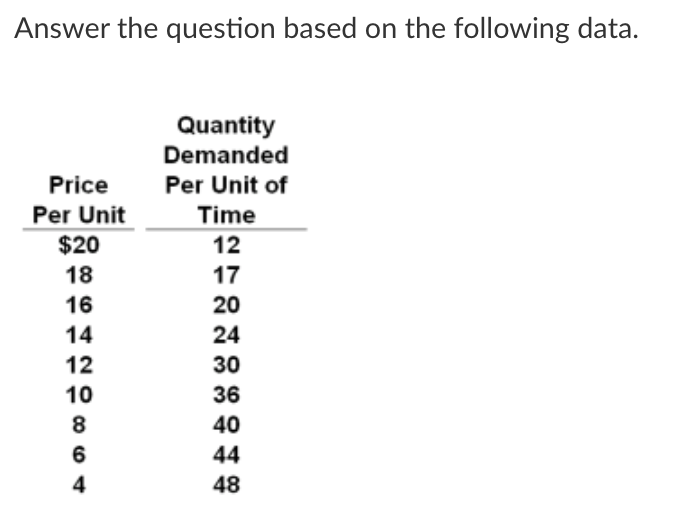
Refer to the above data. Over which price range is the demand inelastic?
$10-$8

Refer to the above data. Over which price range is the demand elastic?
$12-$14
If an increase in the supply of a product results in a decrease in the price, but no change in the quantity traded, then:
The price elasticity of demand is zero
A 4 percent reduction in the price of a product has zero effect on the dollar amount of consumer expenditure on the product. The price elasticity of demand is:
Equal to 1
Demand is said to be inelastic when:
A reduction in price results in a decrease in total revenue

Consider the demand curve above. If area 0ABC is smaller than area 0DEF, we may conclude that demand in this range is:
Price-elastic
In which instances will total revenues decline?
Price rises and Ed equals 2.47
Assume that pizza and hamburgers are the only food items available to consumers. If the price of pizza increases, then which of the following will definitely happen?
Total revenues received by hamburger sellers will increase
When the price of movie tickets in a certain town was reduced, the movie-theaters' revenues did not change. This suggests that the demand for movie tickets in that town has a price-elasticity coefficient of
1.0
“Other things equal, when the price of a good rises, the quantity demanded of the good falls, and when the price falls, the quantity demanded rises.” This relationship between price and quantity demanded
All of the above are correct.
applies to most goods in the economy.
is represented by a downward-sloping demand curve.
is referred to as the law of demand.
A decrease in demand is represented by a
leftward shift of a demand curve.
A decrease in the price of a good will
increase quantity demanded.
A higher price for batteries would result in a(n)
decrease in the demand for flashlights.
A downward-sloping demand curve illustrates
the law of demand.
A likely example of complementary goods for most people would be
canoes and paddles.
A likely example of substitute goods for most people would be
pencils and pens.
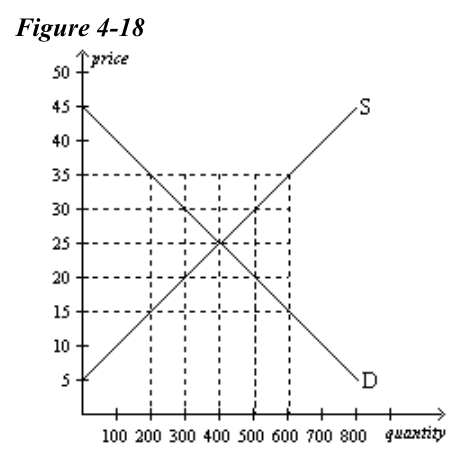
Refer to Figure 4-18. Equilibrium price and quantity are, respectively,
$25 and 400 units.

Refer to Figure 4-17. At a price of
All of the above are correct.
$8, there is a surplus of 6 units.
$5, there is neither a shortage nor a surplus.
$2, there is a shortage of 6 units.

Refer to Figure 4-15. Which of the following would cause the supply curve to shift from Supply A to Supply C in the market for beach towels?
a decrease in the price of cotton

Refer to Figure 4-14. Which of the following best describes the movement from E1 to E2?
a decrease in supply

Refer to Figure 4-10. The movement from Point A to Point B represents a(n)
decrease in the quantity supplied.
Music compact discs are normal goods. What will happen to the equilibrium price and quantity of music compact discs if musicians accept lower royalties, compact disc players become cheaper, more firms start producing music compact discs, and music lovers experience an increase in income?
Quantity will rise, and the effect on price is ambiguous.
In a market economy,
supply and demand determine prices and prices, in turn, allocate the economy’s scarce resources.
In any economic system, scarce resources have to be allocated among competing uses. Market economies harness the forces of
supply and demand to allocate scarce resources.
If the supply of tennis balls, a complement to tennis racquets, decreases, what will happen to the equilibrium price of tennis balls and to the equilibrium price of tennis racquets?
decreases
If, at the current price, there is a surplus of a good, then
sellers are producing more than buyers wish to buy.
If, at the current price, there is a shortage of a good, then
the price is below the equilibrium price.
If the number of sellers in a market increases, then the
supply in that market will increase.
If income rises in the market for an inferior good, will the demand curve for the inferior good shift to the right or to the left?
left