Genetics - Chapter 5 - Linkage & Chromosome Mapping in Eukaryotes
 Call Kai
 Learn
Learn Practice Test
 Spaced Repetition
 Match
Match Flashcards
 Knowt Play
1/36

There's no tags or description
Looks like no tags are added yet.
Name | Mastery | Learn | Test | Matching | Spaced | Call with Kai | Chat |
|---|
No analytics yet
Send a link to your students to track their progress
37 Terms
Linkage (generally)
Genes near each other on a chromosome tend to be inherited together
Chromosomes mimic the movement of the alleles of genes
(since the genes are moving with them during cell division and replication)
Dihybrid cross: different perspective
In a dihybrid cross, there are four phenotypic groups; offspring have either the
parental phenotype
Recominant phenotype
Parental phenotype
Two of the phenotypic classes have the same phenotypes as the parents (one like one parent and other like the second parent)
Recominant phenotype
The remaining two phenotypes share only one trait in common with each parent
New combinations
Parental vs recombinant phenotype example
share all vs share one

Review: test cross
The testcross is a cross to an individual that carries only recessive alleles for the trait
to determine whether an individual that is displaying the dominant phenotype is homozygous or heterozygous for that trait
phenotypes in the offspring are determined by the alleles found in the hybrid
Cross the hybrid (mono-, di-, tri-hybrid) to fully homozygous recessive
expect 1:1 for mono
expect 1:1:1:1 for di
expect 1:1:1:1:1:1:1:1 for tri
Testcross (unlinked genes)
Important: 50% are parental and 50% are recombinant (relative to the P generation) in dihybrid
Why 50%
BECAUSE in independent assortment, half of the gametes are parental and half are recombinant
The recombinants occur by the random alignment on the meiotic metaphase plane
Each combination is equally likely

“funny observation”
Morgan crossed wild-type flies x purple-eyed, vestigial winged flies, F1 was wild type, F2 was 1195 purple-eyed, vestigial winged, 151 vestigial winged, 154 purple eyed, 1339 wild-type
He tried again and crossed purple eyed x vestigial, F1 was wild type, F2 was 157 purple, vestigial, 965 vestigial, 1067 purple eyes, 146 wild type
This showed chiasmata, interpreted as sites where chromosomes exchange
Morgan determined that these genes are linked, do not assort independently
Map unit
One map unit is defined as 1% recombinant offspring
(# recombinants / total # of offspring) x 100
Example: 151+154 = 303, 303/2335 = 12.9% recombinant so about 13 mu apart
Linkage mapping
Determines the relative position of genes by following phenotypes
Based on recombination that occurs during meiosis
Independent assortment - 50% of the offspring have parental phenotypes, 50% have recombinant phenotypes
Linkage - parental phenotypes are more than 50% and recombinant phenotypes are less than 50%
What are the unit of transmission in meiosis?
CHROMOSOMES (not genes)
Linked genes
cannot undergo independent assortment
Recombination (crossing over)
is required in meiosis and results in the formation of recombinant chromosomes
The frequency of crossing over between any two genes on a single chromosome
is proportional to distance between those genes
Linkage concept
Alleles of genes that are close together on a chromosome tend to be inherited together during meiosis
Loci that are near each other are less likely to be separated by recombination during chromosomal cross-over in meiosis. it is probabilistic
Locus
the location of a certain gene on a chromosome; loci is the plural of locus
Linkage vs independent assortment
Independent: equal proportions of each type (alignment in meiosis I)
Linkage: different proportions (crossing over in meiosis I)
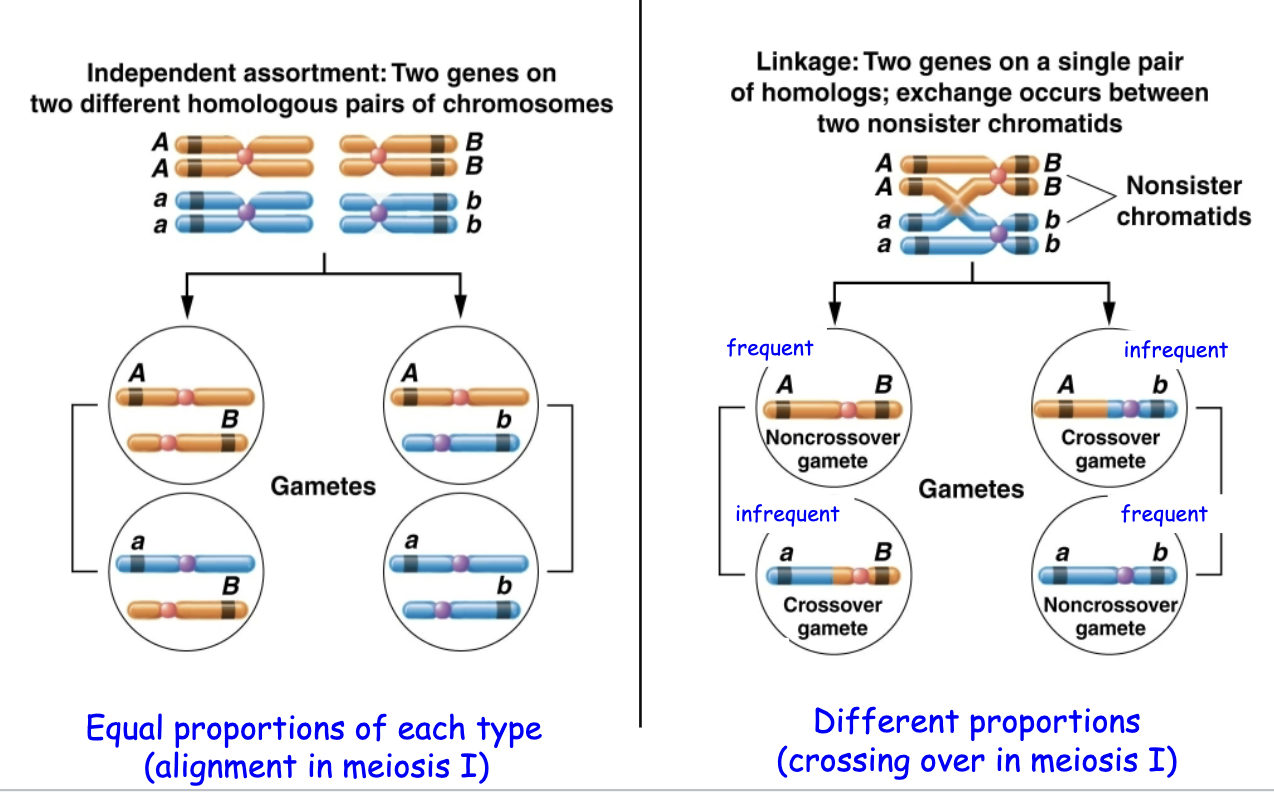
Crossing over in meiosis generates new chromosomes and affects linkage of genes
If segments of two nonsister chromatids are exchanged..
between the genes we are following → it leads to a recombination
between genes we are not following → leads to no recombinants
How to do a mapping problem (generally)
Cross true-breeding parents for 3 genes with contrasting traits
Test-cross the F1 hybrids (to fully recessive individuals)
Put F2 offspring into “parental” or “recombinant” classes
Determine the frequency of recombinants
Convert 1% recombinant to 1 mu
Poisson distribution
The occurence of crossovers in a specific chromosomal region
Describes the distribution of ‘successes’ in samples when the average probability of successes is low
When the probability is low, usually there will be no crossover in a region
Why is there a limit in mapping to 50 mu?
Because the maximum observable recombination frequency between any two genes is 50%
Aside: as more complicated crossing over patterns appear, it can sometimes be hard to detect recombinants AND as genes get farther apart, it increases the probability of undetected crossovers
Interference
Inhibition of further crossover events, usually by another crossover event nearby
Reduces expected number of multiple crossovers, generally seen when looking for recombinants of the middle gene of three when mapping
The amount of interference can be calculated: I = 1 - C
C is the coefficient of coincidence, C = observed DCO/expected DCO
Complete interference
No double crossovers occur
Positive interference
Fewer double crossover events than expected occur, I is a positive number
Negative interference
More double crossover events than expected, I is a negative number (theoretical, cases are usually not seen)
Two genes that are 60 mu apart are expected to show __ recombination
50%
Genes farther apart are more likely to cross over than genes close together
Meiotic Mapping
Strategy 1: determine the gene in the middle first, and then map from that gene to both of the adjacent genes
Strategy 2: map distances between all three genes (A → B, B → C, A→C) and there is only one way to assemble this information
Meiotic Mapping again
Organize progeny classes into four pairs with complementary phenotypes
Note the differences in frequency
One pair will be the most frequent
This pair describes the parental class
They have the phenotypes of the individuals in the parental class
They arise from gametes that do NOT crossover between the genes in question
All of the other pairs show recombination; this recombination changes the alleles of one of the genes from the parental configuration of alleles for the other two genes
Of these 3 pairs, two represent single-crossover classes (SCO) and the least frequent represents the double-crossover class (DCO)
The allele that changes position in the DCO class corresponds to the gene that is in the middle
Make a map of the order of these genes (this is important for strat 1)
Notes:
The gene whose alleles change places in the least frequent class (in pink) when compared with the parental class (in blue) identifies the gene that is in the middle
To determine the distance from C to A, add up the recombinants (A is with c and a is with C): 2+3+50+45 = 100 100/1000=0.10
To determine the distance from C to B, add up the recombinants (B is with c and b is with C): 2+3+75+70 = 150 150/1000=0.15
Calculate interference. Expected DCO is 0.10×0.15×1000 = 15 Observed DCO is 2+3 = 5 I = 1 – (5/15) = 0.66
In strategy 2, you don’t know the middle gene. Calculate the distance from A to B (A – b; a – B) 50+45+75+70 = 240 240/1000=0.24
Parental vs recombinant

Mendelian genetic diseases
autosomal dominant
autosomal recessive
X-linked dominant or recessive
Can be rare, highly penetrant (typically due to alleles of a single gene and good phenotype to genotype correspondence), and little to no environmental component
Non-mendelian, complex traits (common) genetic diseases
Due to the combination of multiple genes and environmental influences
Can be common, variable, polygenic (with modest effects from multiple genes), heterogeneous with variable expressivity (different genetic factors, phenotypic expression is variable), environmental component
Mitochondrial (matrilineal) genetic diseases
This is non-nuclear inheritance; aka, extranuclear inheritance
Human genetic markers
Blood groups, serum protein electrophoretic variants, RFLPs (restriction site variation), microsatelites (size variation), SNPs (single nucleotide polymorphisms)
GWAS (Genome-wide association studies)
DNA sequence variation is “co-dominant” when the alleles differ. They may or may not directly affect a phenotype.
Ex. microsatelites and SNPs
SNPs
Found throughout genome
Used by geneticists to identify and locate related genes
Used to screen for diseases
In GWAS, mapping is to SNPs
Independent: each of the SNP alleles is equally likely to be found in both groups
Linkage: the SNP alleles show skewed distribution: one allele is more common in affected people
NOTE: look for threshold, chromosomes that go above should be looked into