Maps

0.0(0)
Studied by 0 people
call kaiCall Kai
Locked
learnLearn
examPractice Test
spaced repetitionSpaced Repetition
heart puzzleMatch
flashcardsFlashcards
GameKnowt Play
Card Sorting

1/12

encourage image

There's no tags or description

Looks like no tags are added yet.

Last updated 10:40 PM on 8/25/26
Name
Mastery
Learn
Test
Matching
Spaced
Call with Kai
Chat

No analytics yet

Send a link to your students to track their progress

13 Terms

1
New cards

Dot Distribution Map

A type of thematic map that uses dots to represent the presence or quantity of a phenomenon in a specific area. Each dot corresponds to a set number of cases or individuals, helping to visualize spatial distributions.
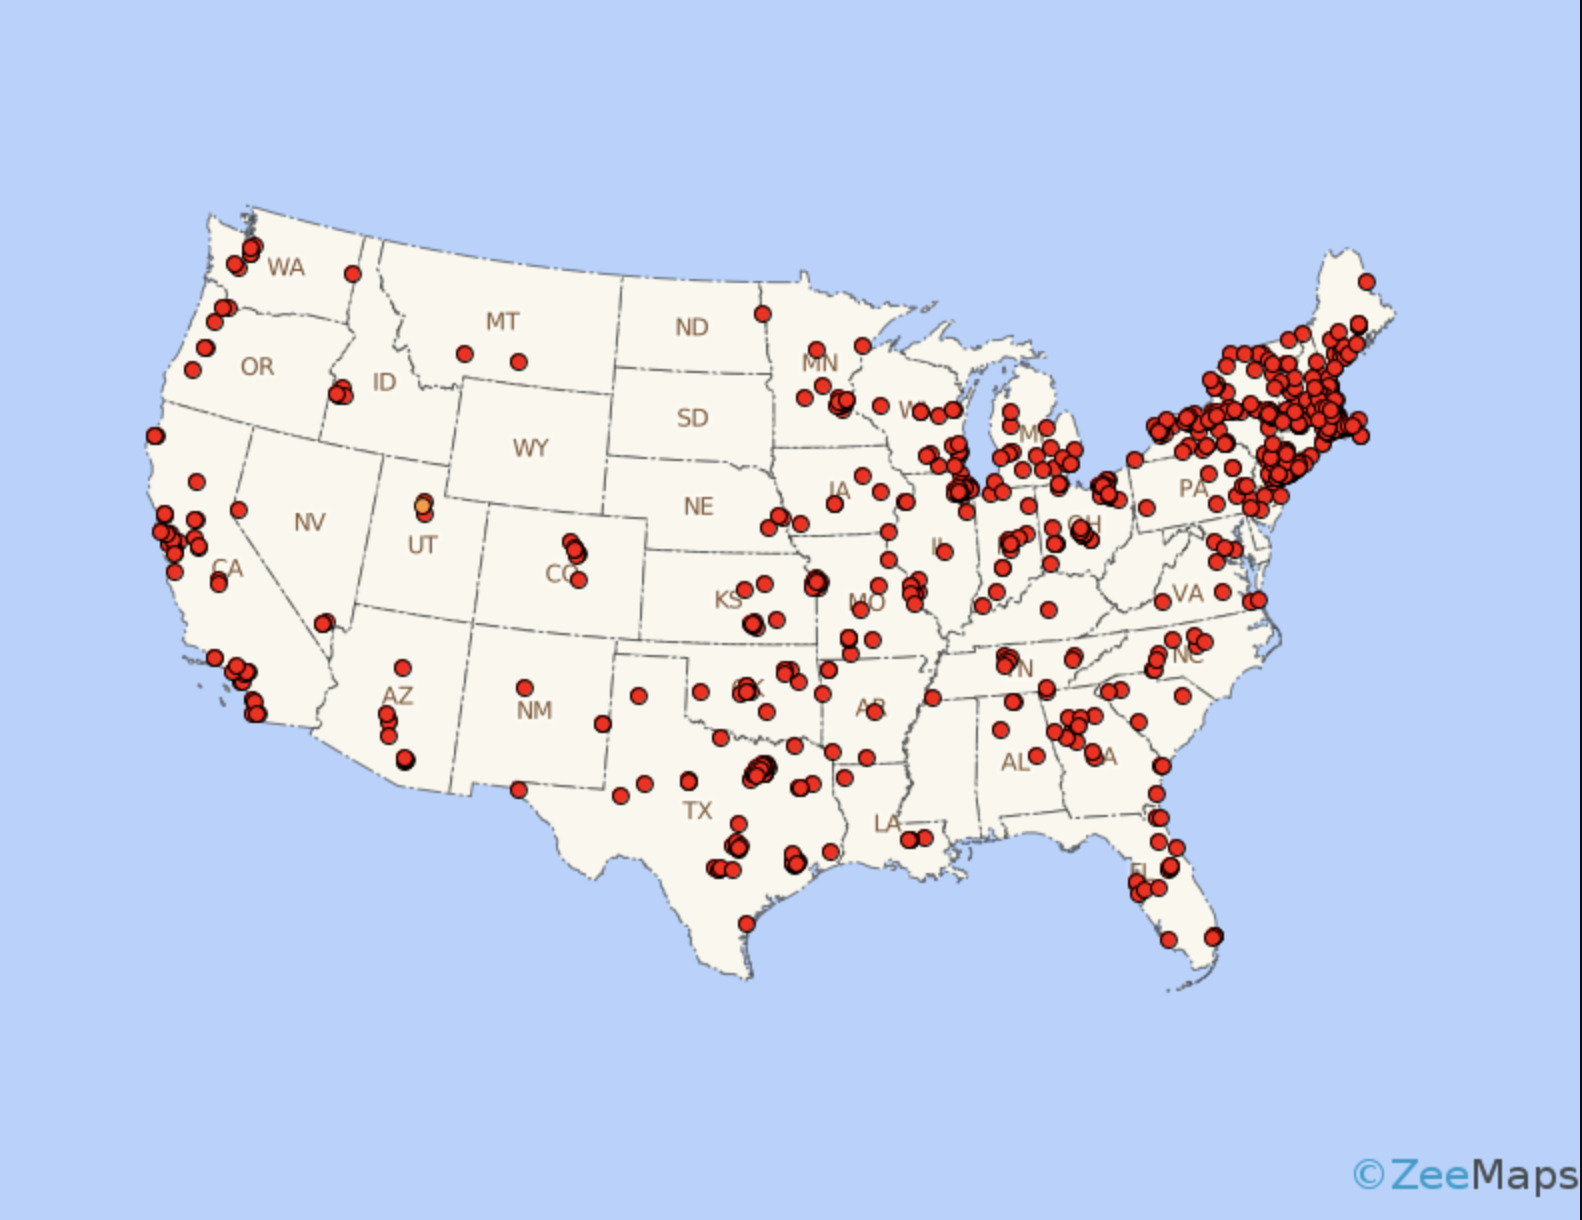
<p>A type of thematic map that uses dots to represent the presence or quantity of a phenomenon in a specific area. Each dot corresponds to a set number of cases or individuals, helping to visualize spatial distributions. </p>
2
New cards

Proportional Symbol Map

A thematic map that uses symbols of varying sizes to represent the magnitude of a phenomenon at specific locations, allowing for easy comparison of different areas.
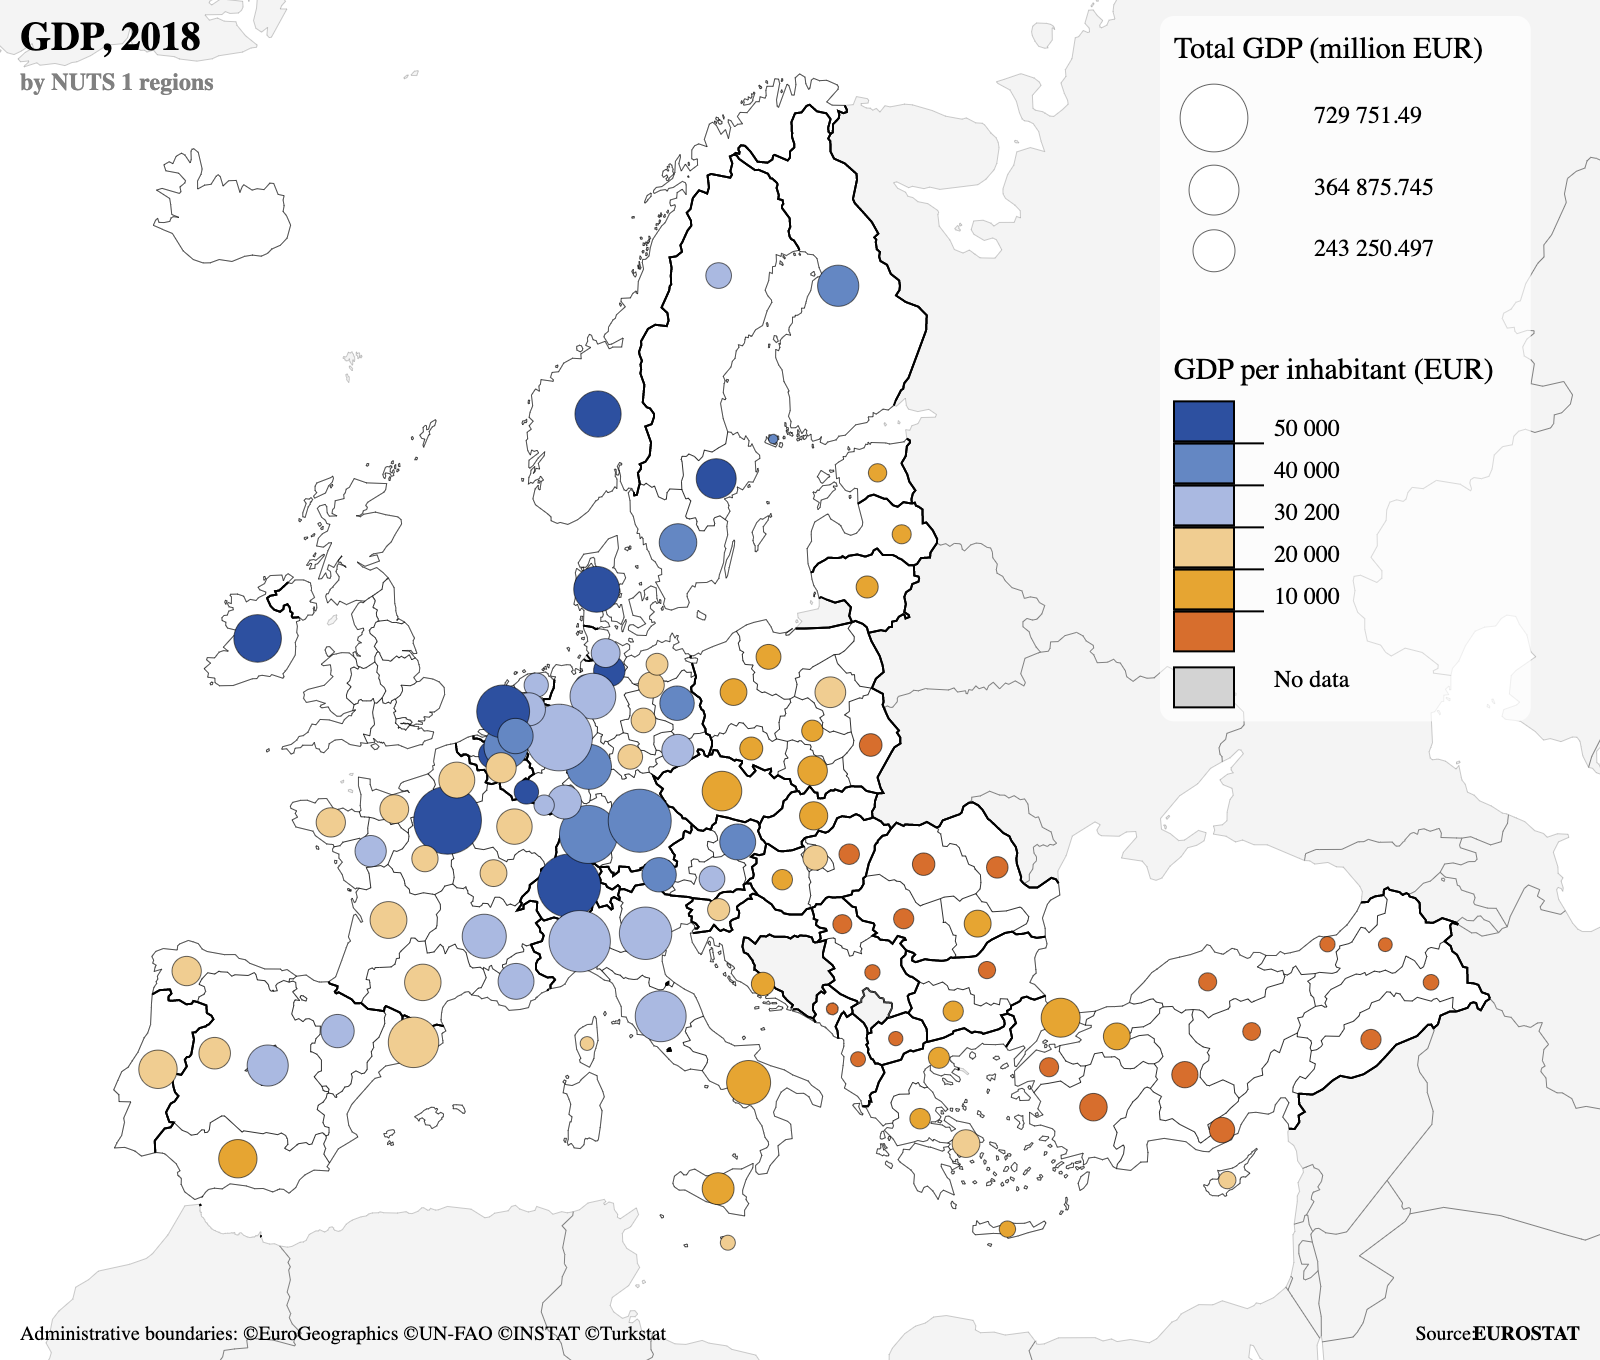
<p>A thematic map that uses symbols of varying sizes to represent the magnitude of a phenomenon at specific locations, allowing for easy comparison of different areas. </p>
3
New cards

Reference maps

Aptly named because they are designed for people to refer to for general information about places

<p>Aptly named because they are designed for people to refer to for general information about places</p>
4
New cards

Thematic maps

Show spatial aspects of information or of a phenomenon.

<p>Show spatial aspects of information or of a phenomenon.</p>
5
New cards

Mollweide Projection Map

Preserves relative land areas accurately across the globe. Useful for thematic mapping, but distorts shapes and angles near edges.

<p>Preserves relative land areas accurately across the globe. Useful for thematic mapping, but distorts shapes and angles near edges.</p>
6
New cards

Mercator Map

Used for Navigation so it has accurate directions and right ang;e longitude and latitude. Land masses near poles look large when they aren’t and distance between longitude and latitude looks constant.
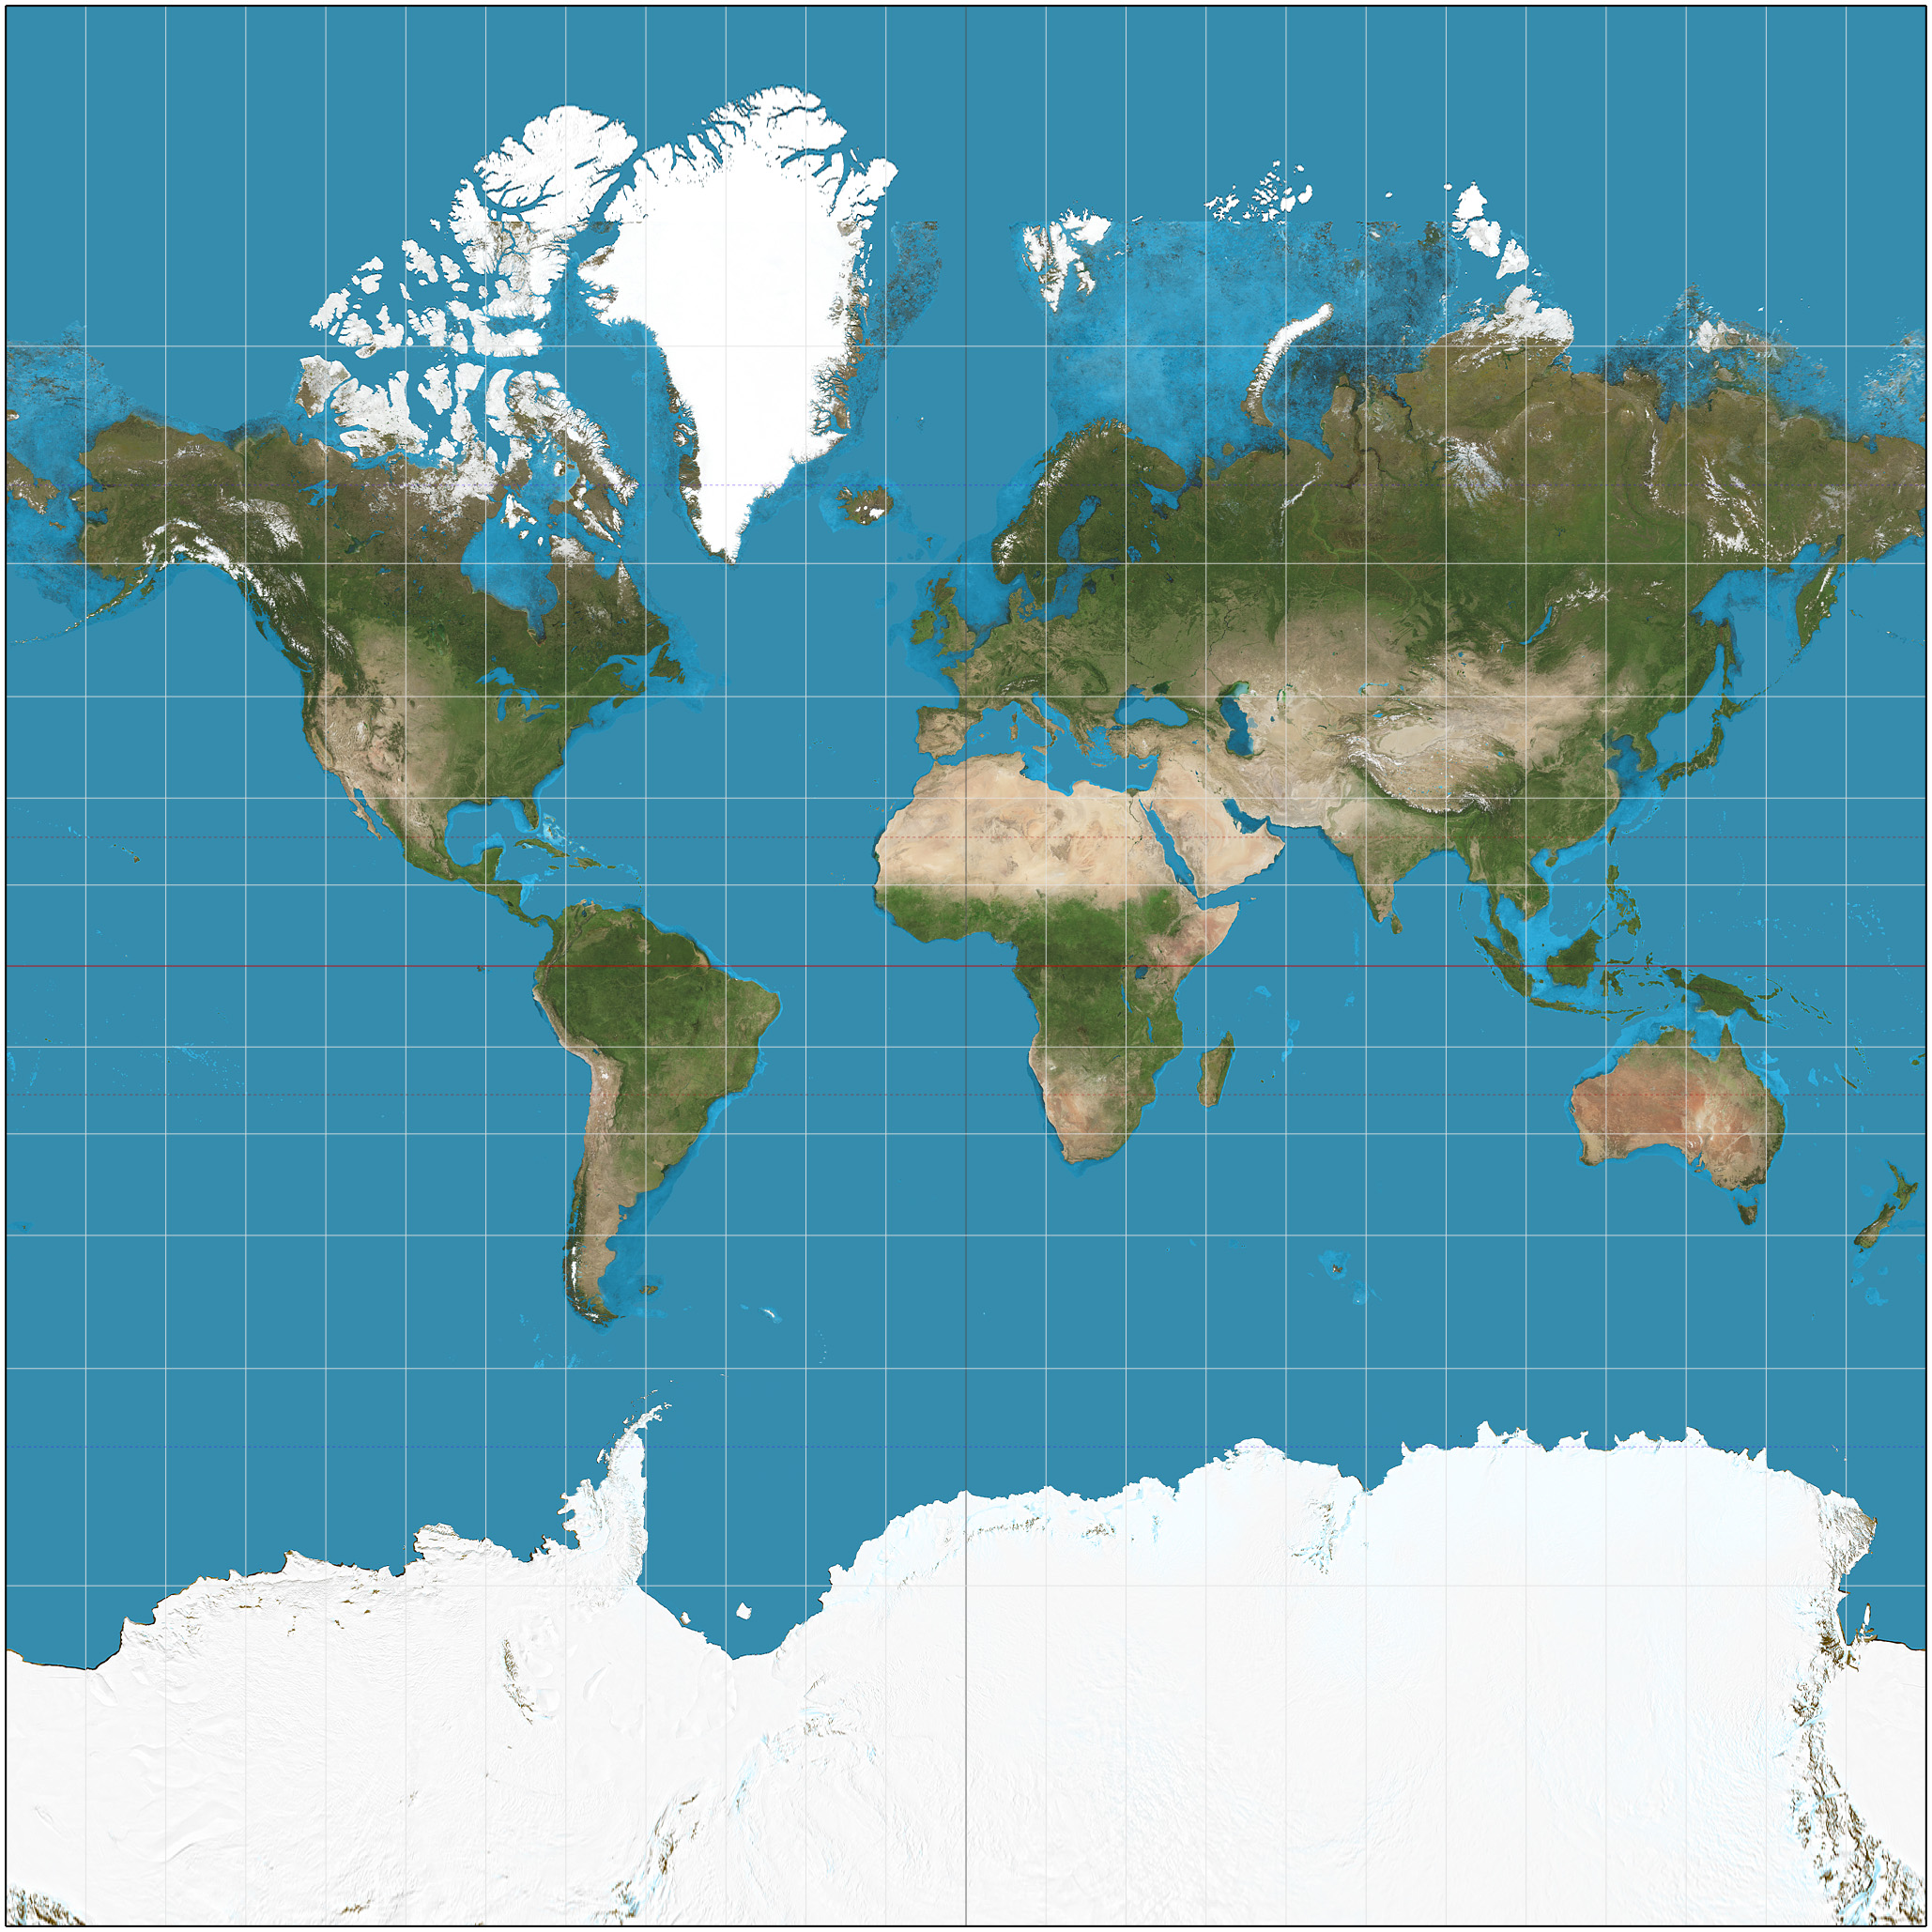
<p>Used for Navigation so it has accurate directions and right ang;e longitude and latitude. Land masses near poles look large when they aren’t and distance between longitude and latitude looks constant.</p>
7
New cards

Goode’s Interrupted Homolosine Map

Shows true land size by slicing the oceans. It is good for global data, but not for navigation.
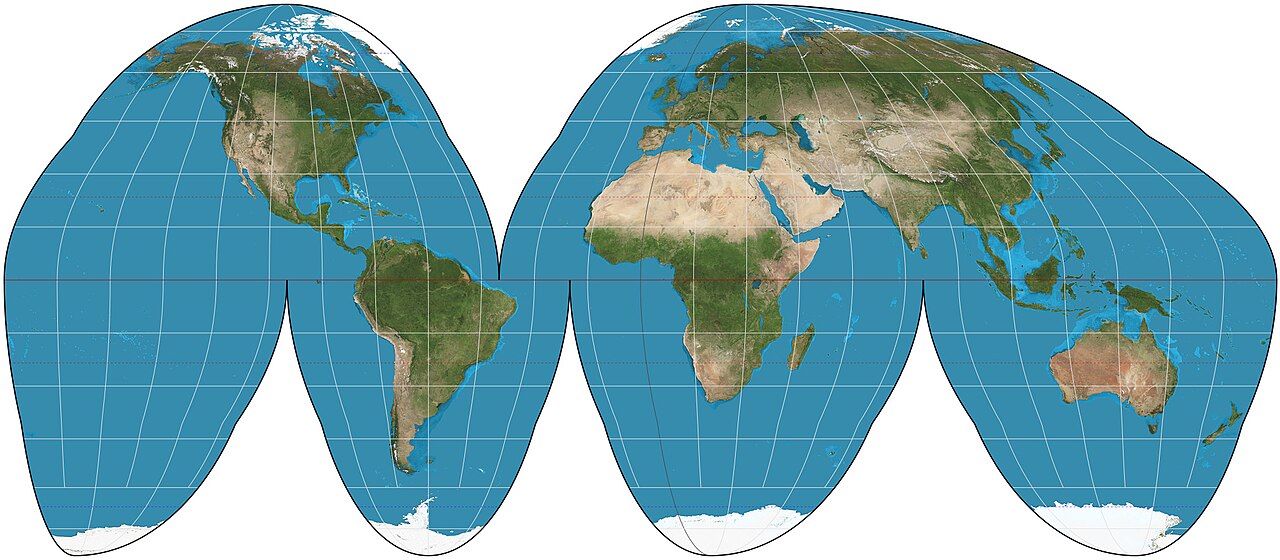
<p>Shows true land size by slicing the oceans. It is good for global data, but not for navigation.</p>
8
New cards

Sinusoidal Projection Map

Shows relative sizes accurately while distorting shapes and direction around the edge.

<p>Shows relative sizes accurately while distorting shapes and direction around the edge. </p>
9
New cards

Robinson Projection Map

Used for General use because it has no major distortion and looks more like a globe. Areas, shapes, and sizes, can be slightly distorted.
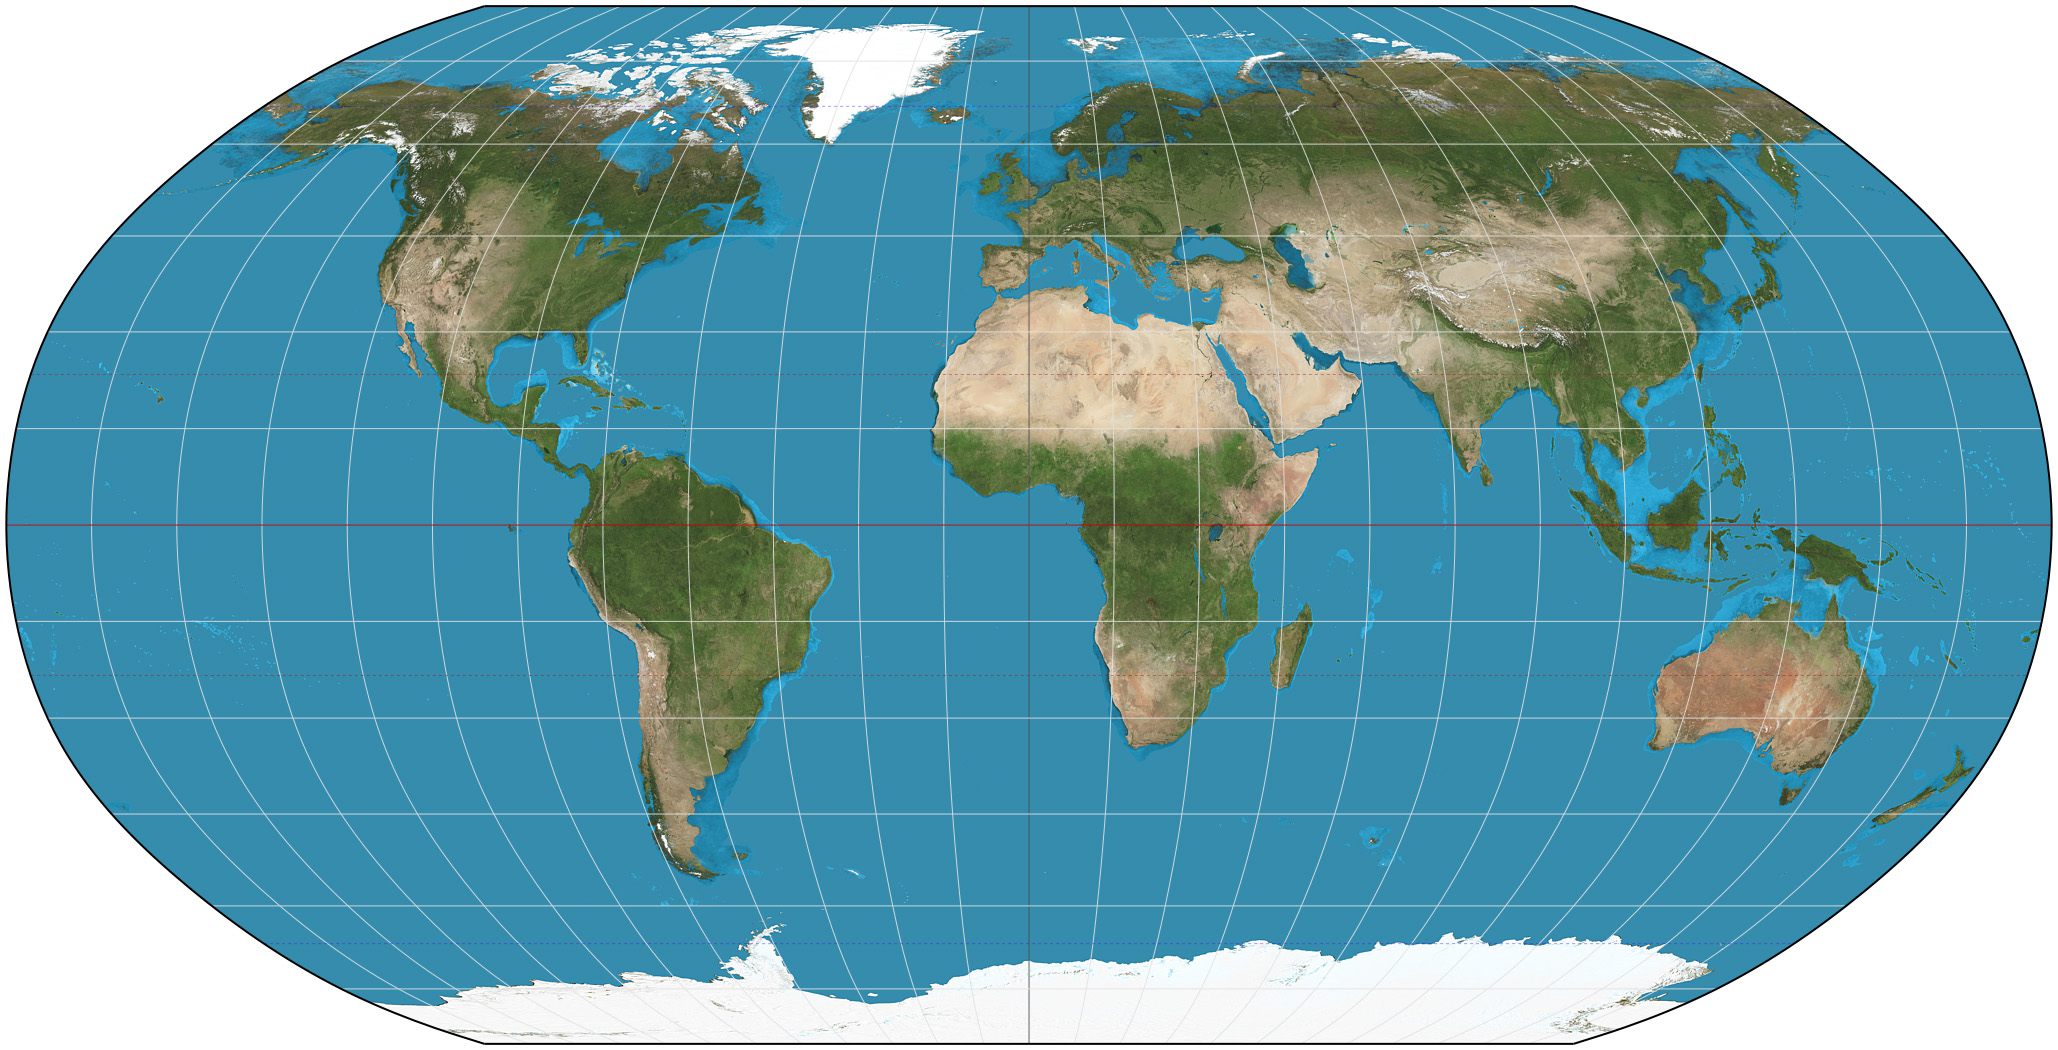
<p>Used for General use because it has no major distortion and looks more like a globe. Areas, shapes, and sizes, can be slightly distorted.</p>
10
New cards

Choropleth Map

Uses colors, shades, or patterns to show location and distribution of spatial data. Shows rates or other quantitative data.
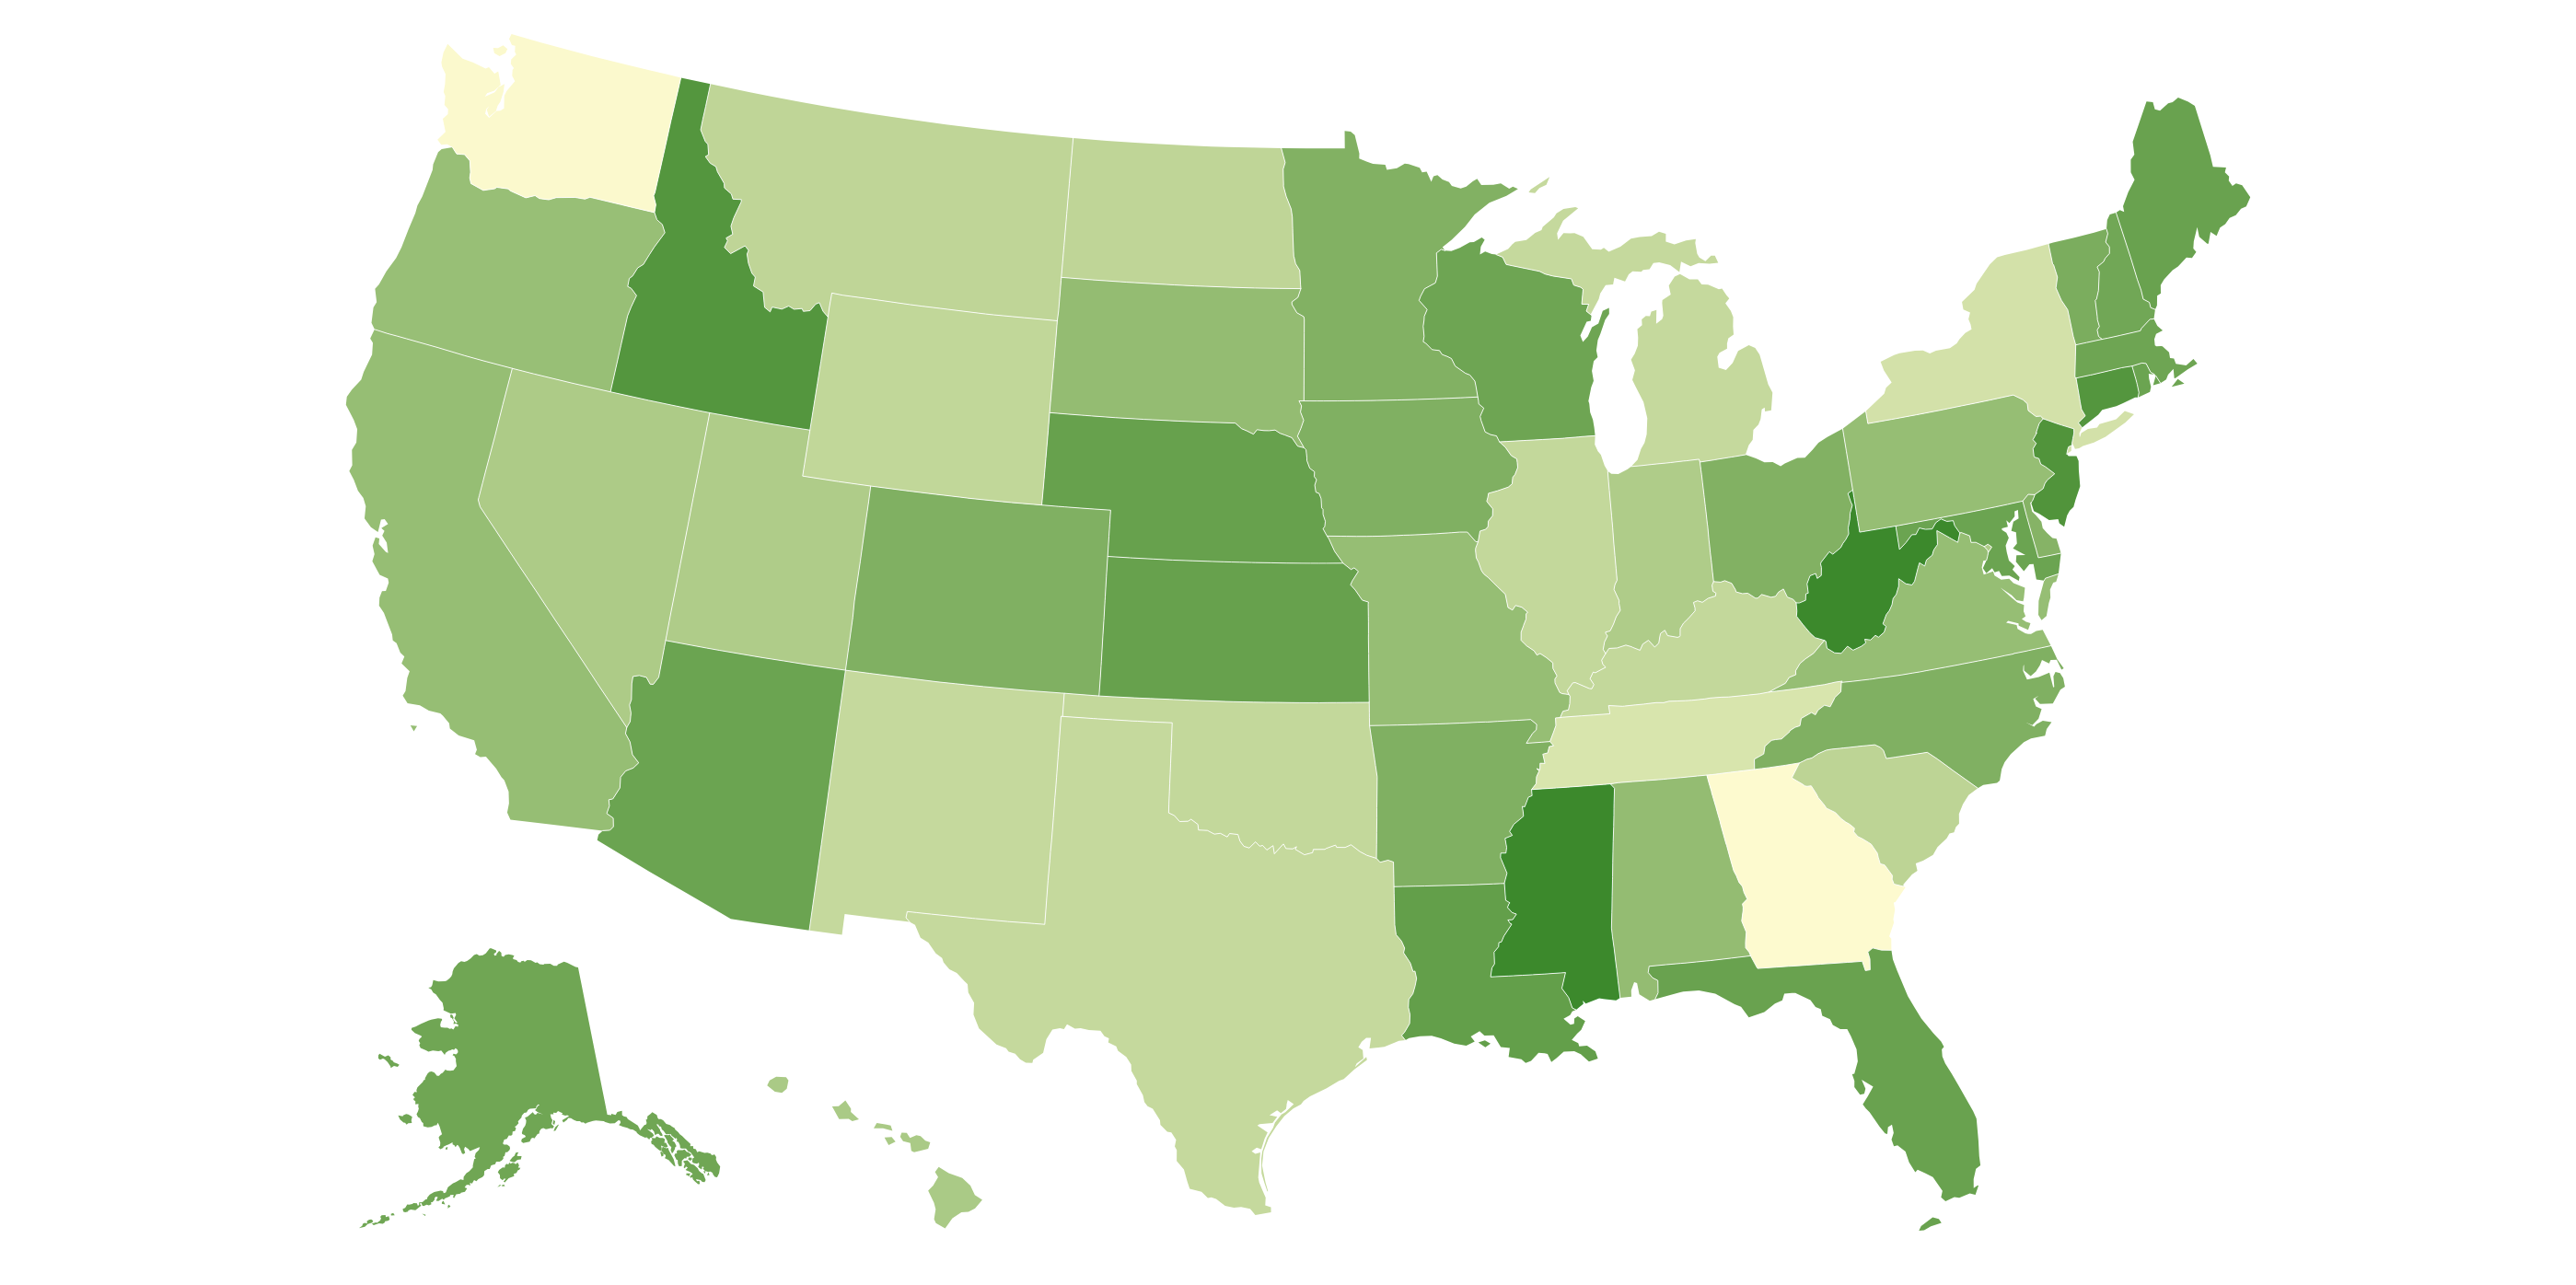
<p>Uses colors, shades, or patterns to show location and distribution of spatial data. Shows rates or other quantitative data.</p>
11
New cards

Cartogram map

Size of the units or land is porportional to the data represented. used to represent statistics such as political turnout or population density.

<p>Size of the units or land is porportional to the data represented. used to represent statistics such as political turnout or population density.</p>
12
New cards

Isopleth Maps

This type of map is ideal for showing gradual change over space. Temperature is a phenomenon that should be mapped using isopleth. Relief maps should always be in isopleth for this reason.
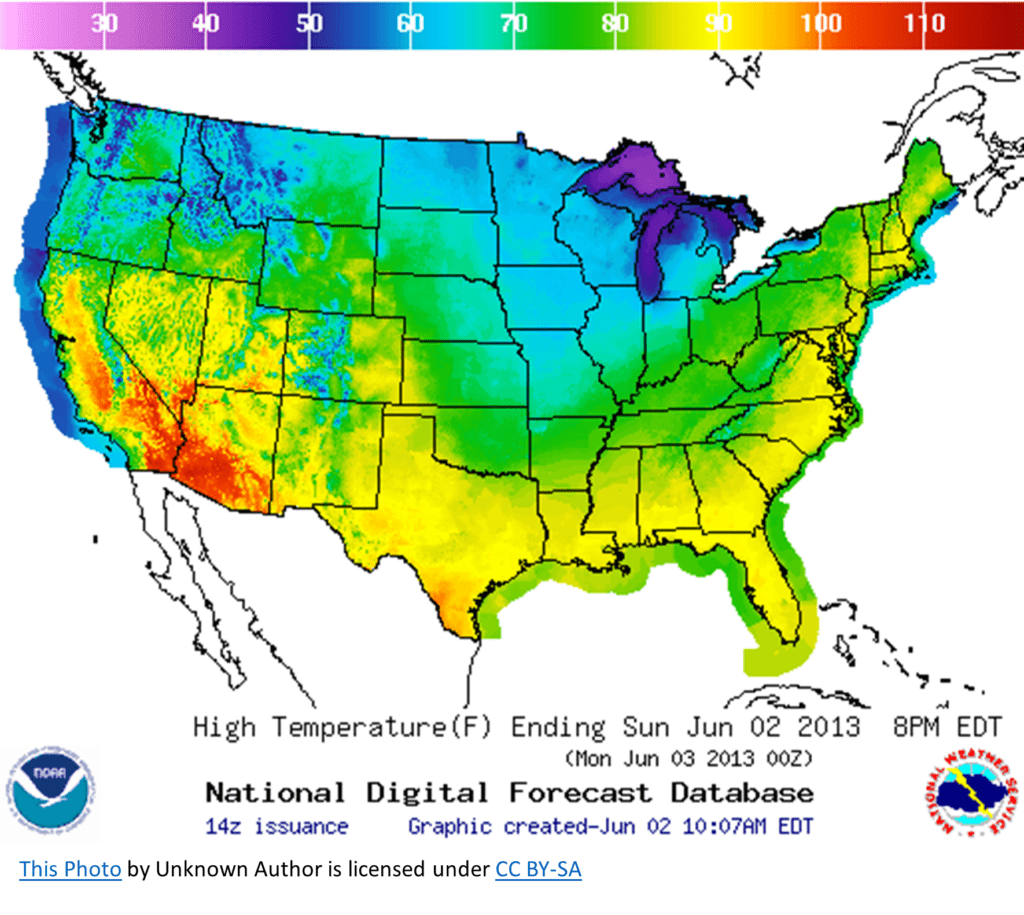
<p>This type of map is ideal for showing gradual change over space. Temperature is a phenomenon that should be mapped using isopleth. Relief maps should always be in isopleth for this reason.</p>
13
New cards

Flow Line Map

Combines geographic coordinates with flow diagrams to show movement.
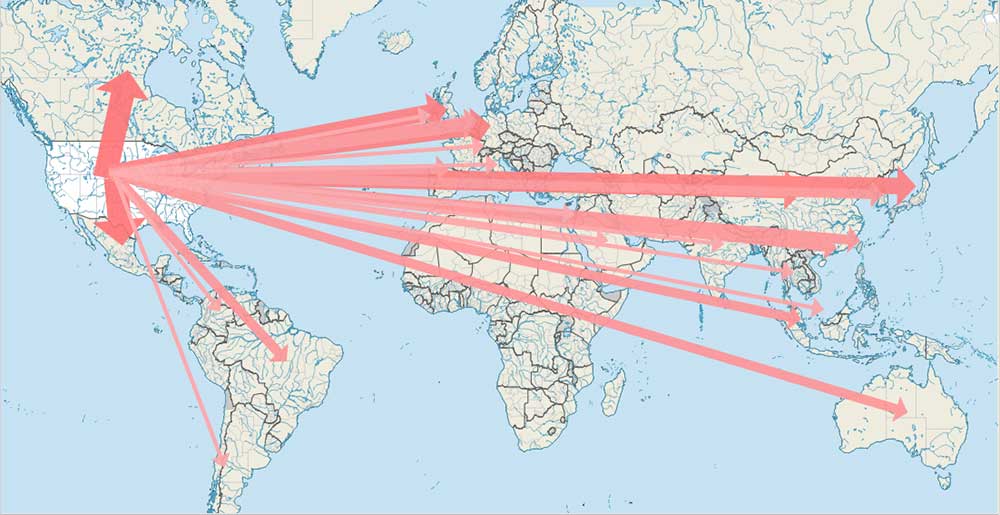
<p>Combines geographic coordinates with flow diagrams to show movement. </p>