Statistics and Modeling Exam 1 Review
 Call Kai
 Learn
 Practice Test
 Spaced Repetition
 Match
 Flashcards
 Knowt Play
1/39

There's no tags or description
Looks like no tags are added yet.
40 Terms
A high school senior is collecting data on the colleges in which she is interested. Identify the variables as either categorical or quantitative.
Type of college: Private or Public college
Categorical
A high school senior is collecting data on the colleges in which she is interested. Identify the variables as either categorical or quantitative.
Tuition: in thousands of dollars
Quantitative
A high school senior is collecting data on the colleges in which she is interested. Identify the variables as either categorical or quantitative.
State: the state in which the college is located
Categorical
A high school senior is collecting data on the colleges in which she is interested. Identify the variables as either categorical or quantitative.
Zip Code: the zip code of the part of the country in which the college is located
Categorical
A high school senior is collecting data on the colleges in which she is interested. Identify the variables as either categorical or quantitative.
5) Enrollment: the number of students enrolled at the college
Quantitative
A high school senior is collecting data on the colleges in which she is interested. Identify the variables as either categorical or quantitative.
Student-Faculty Ratio: the number of students divided by the number of faculty
Quantitative
A high school senior is collecting data on the colleges in which she is interested. Identify the variables as either categorical or quantitative.
Graduation Rate: as a percentage
Quantitative
A high school senior is collecting data on the colleges in which she is interested, including the following variables: Type of college, Tuition, State, Enrollment, Student-Faculty Ratio, Graduation Rate
What are the cases in the high school senior's dataset
Colleges
A high school senior is collecting data on the colleges in which she is interested, including the following variables: Type of college, Tuition, State, Enrollment, Student-Faculty Ratio, Graduation Rate
Refer to the variables collected by the high school senior looking at colleges. Identify a question we might ask about any one of these individual variables.
What is the average tuition for each college?
A high school senior is collecting data on the colleges in which she is interested, including the following variables: Type of college, Tuition, State, Enrollment, Student-Faculty Ratio, Graduation Rate
Refer to the variables collected by the high school senior looking at colleges. Identify a question that we might ask about relationships between any two (or more) of these variables.
Is higher tuition associated with a higher graduation rate?

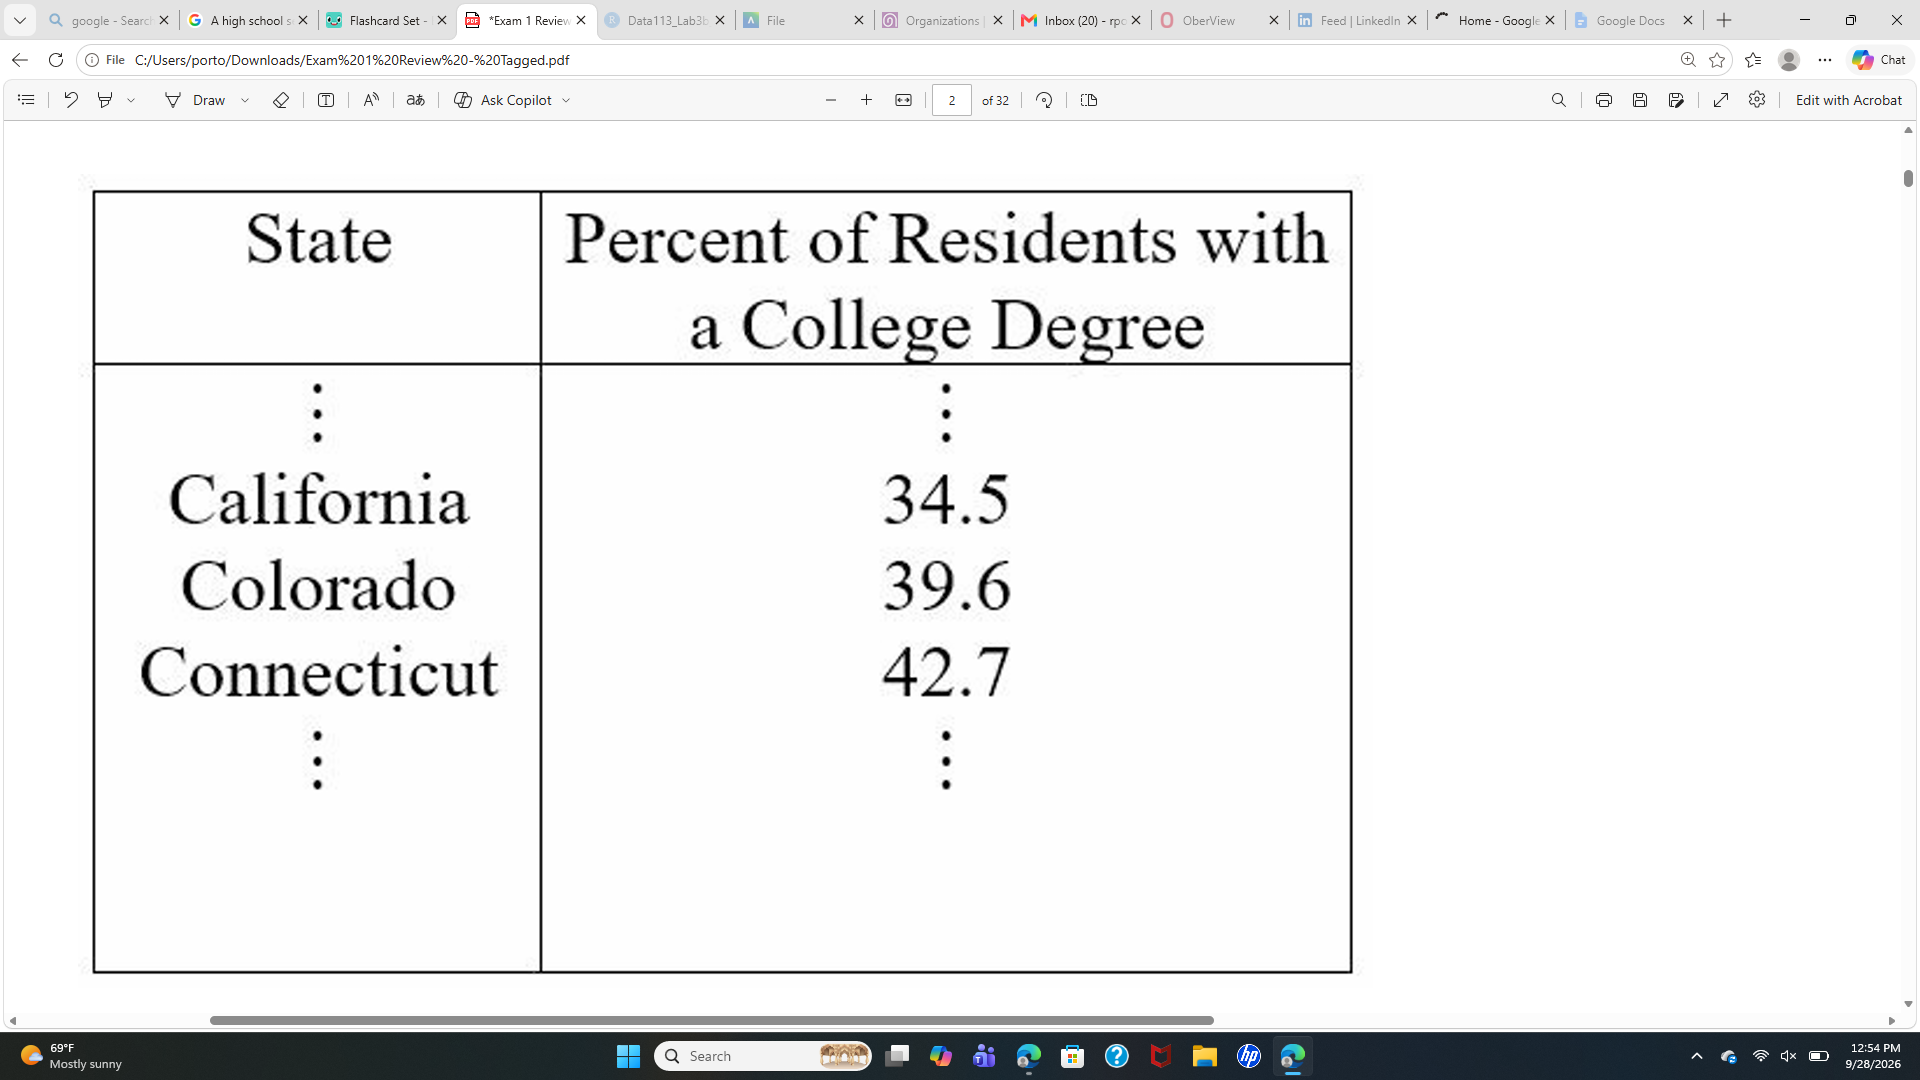
What are the cases in this dataset?
States

What variable from this dataset is displayed? Is it categorical or quantitative?
Variable = Percent of state residents with a college degree. This is a quantitative variable.

Data from the state of Connecticut were used to determine that 42.7% of state residents had a college degree. What were the cases from Connecticut used to arrive at this figure?
Resident of Connecticut

What variable was used to determine that 42.7% of Connecticut state residents have a college degree? Is it categorical or quantitative?
Variable = whether or not they have a college degree. This is a quantitative variable.
The ________ variable is used to understand or predict values of the ________ variable.
Blank 1 = Explanatory, Blank 2 = Response
State whether the data are best described as a population or a sample
The makers of M&M's state that when they package their candies they thoroughly mix the colored candies together and randomly put them into packages. A student purchases a bag of Milk Chocolate M&M's from the vending machine
Sample
State whether the data are best described as a population or a sample
A professor wants to schedule a review session for an exam. He asks all students enrolled in the course their preferred time, and they all respond.
Population
State whether the data are best described as a population or a sample
A researcher has identified a beach with a substantial number of driftwood logs. She randomly chooses 30 logs and takes core samples from those logs
Sample
State whether the data are best described as a population or a sample.
A football fan recorded the number of rushing yards for all NFL running backs who played last season.
Population
A tree enthusiast is interested in estimating the typical length of oak tree leaves. He chooses 30 leaves from the oak tree in his backyard.
What is the sample in this situation?
30 leaves
A tree enthusiast is interested in estimating the typical length of oak tree leaves. He chooses 30 leaves from the oak tree in his backyard.
What is the population in which the tree enthusiast is interested?
Oak tree leaves
A tree enthusiast is interested in estimating the typical length of oak tree leaves. He chooses 30 leaves from the oak tree in his backyard.
Is this a biased sampling strategy? Explain!
Yes because the enthusiast decides to choose 30 leaves from only one tree
In each situation, indicate whether the method of data collection is biased. Explain!
Ask the students at the gym on a Tuesday afternoon how many hours a week they work out to estimate the average amount of time students at the university work out.
Biased
In each situation, indicate whether the method of data collection is biased. Explain!
A professor asks her class of first year students if any of them consumed alcohol over the weekend.
Biased
In each situation, indicate whether the method of data collection is biased. Explain!
A campus bookstore is holding a drawing to give away five free textbooks (one per student). Students enter the contest by writing their name and contact information on an index card. The index cards were placed in a bowl, thoroughly mixed around, and five cards were selected. Those five students were contacted and received their free textbook.
Biased
In each situation, indicate whether the method of data collection is biased. Explain!
A professor is considering a new textbook for her introductory statistics class. She wants to choose a book that emphasizes graphing data. A book that she is considering has 530 pages. To estimate the proportion of pages in the book that have displays of data, she randomly generates 20 numbers between 1 and 530. She then records whether or not each selected page contains displays of data.
Not biased
In each situation, indicate whether the method of data collection is biased. Explain!
A reporter from the campus newspaper is writing an article about student opinions on Greek organizations (sororities and fraternities). For his article, he visits all of the Greek houses on campus and interviews a random sample of residents of each house.
Biased
A group of researchers investigated the effect of media usage (whether or not subjects watch television or use the Internet) in the bedroom on "Tiredness" during the day (measured on a 50 point scale).
Identify the variables described and whether they are categorical or quantitative.
Media usage in the bedroom = Categorical; "Tiredness" = Quantitative
A group of researchers investigated the effect of media usage (whether or not subjects watch television or use the Internet) in the bedroom on "Tiredness" during the day (measured on a 50 point scale).
Identify the variables as either explanatory or response variables.
Media usage in the bedroom = Explanatory; "Tiredness" = Response variable
A group of researchers investigated the effect of media usage (whether or not subjects watch television or use the Internet) in the bedroom on "Tiredness" during the day (measured on a 50 point scale).
To collect these data, the researchers randomly selected homes to visit and interviewed the adult member of the household whose birthday was nearest. Is this an experiment or an observational study?
Observational Study
A group of researchers investigated the effect of media usage (whether or not subjects watch television or use the Internet) in the bedroom on "Tiredness" during the day (measured on a 50 point scale).
Suppose that the researchers found that the individuals who use media in the bedroom tended to be more tired during the day than those who do not. Would it be appropriate for the researchers to conclude that using media in the bedroom causes tiredness during the day?
No
Association implies causation
False
In elementary school (Grades 1 through 6) there is a strong association between a child's height and reading ability. What is a possible confounding variable that would help explain this relationship? Explain briefly.
The child’s age
A sample of college age students shows an interesting association between hair length (in inches) and height (also in inches). On average, shorter students tend to have longer hair. What is a possible confounding variable that would help explain this relationship?
Sex/Gender
A recent study investigated the impact of psychological stress on men's judgments of female body size. The men were randomly assigned to one of two groups; one group was assigned to participate in a stressful task while the other group did not take part in the task. Then the men were asked to rate the attractiveness of female bodies varying in size from emaciated to obese.
What are the cases in this study?
Each man participating in this experiment
A recent study investigated the impact of psychological stress on men's judgments of female body size. The men were randomly assigned to one of two groups; one group was assigned to participate in a stressful task while the other group did not take part in the task. Then the men were asked to rate the attractiveness of female bodies varying in size from emaciated to obese.
Is this an experiment or an observational study?
Experiment
A recent study investigated the impact of psychological stress on men's judgments of female body size. The men were randomly assigned to one of two groups; one group was assigned to participate in a stressful task while the other group did not take part in the task. Then the men were asked to rate the attractiveness of female bodies varying in size from emaciated to obese.
Identify the explanatory variable in this experiment.
Type of task (stressful or not)
A recent study investigated the impact of psychological stress on men's judgments of female body size. The men were randomly assigned to one of two groups; one group was assigned to participate in a stressful task while the other group did not take part in the task. Then the men were asked to rate the attractiveness of female bodies varying in size from emaciated to obese.
Identify the response variable in this experiment.
Rating of the attractiveness of the female body sizes
A recent study investigated the impact of psychological stress on men's judgments of female body size. The men were randomly assigned to one of two groups; one group was assigned to participate in a stressful task while the other group did not take part in the task. Then the men were asked to rate the attractiveness of female bodies varying in size from emaciated to obese.
Is a control group used in this experiment? If there is, which one?
the men who did not take part in the stressful task