Ecology: Predation and Herbivory Part 2
 Call Kai
 Learn
 Practice Test
 Spaced Repetition
 Match
 Flashcards
 Knowt Play
1/36

There's no tags or description
Looks like no tags are added yet.
37 Terms

Explain the predator-prey population cycles in the graph. What trend occurs between predator and prey populations?
The prey population, hares, increases first. The predator population, lynx, lags behind, increasing second. As lynx population increases, they eat more hares, causing hare population to decrease. With fewer hares present, the lynx populations eventually decreases due to less food. With fewer predators the hares can recover, repeating the cycle.

Why, in the example of lynx and hares, do we see lagging with predators?
As hares increase first, predator populations take time to respond until they eventually increase due to abundance of food.
True or false: In predator-prey cycles, the pattern we see is busts and blow with the predator always lagging behind.
true
what was the initial hypothesis of researchers regarding how predator-prey populations cycle?
abiotic factors could cause the cycle
What experiment did the researchers conduct to figure out if abiotic conditions caused the cycle?
Created a controlled arena using rubber balls and oranges with two mite species. The citrus pest mites were the prey while the predatory mites, were the predators. The citrus mites increased due to the oranges and this increase in citrus mites caused predatory mites to increase due to more food.
What did the mites experiment prove about predator prey cycles?
internally generated by the effects of resources on the consumer population and consumers on resource population not the environment
What does the Lotka-Volterra model of prey-predators interactions tell us?
cycles between species where one consumes the other

The first equation in the Lotka-Volterra model tracks the abundance of the prey population. What does rN represent?
the rate of additions to the hare population

The first equation in the Lotka-Volterra model tracks the abundance of the prey population. What does c represent?
capture efficiency which tells us how effective the lynx are at eating the hares
If c is 0.1, what does that mean for the hare and lynx population?
when lynx and hare interact, 10% of the time lynx catch hares while 90% of the time hares don’t get caught

The first equation in the Lotka-Volterra model tracks the abundance of the prey population. What does the NP represent?
encounter rate

If you’re in a region where there’s 3 lynx and 3 hare, what is the encounter rate? If there’s a capture efficiency of 0.1, what does that tell us for the hare population?
The encounter rate is 9 encounters.
Since the capture efficiency is 0.1, 10% of those 9 encounters ends in a successful capture.
0.1×9=0.9→ 0.9
On average 0.9 hares are captured, meaning the hare population decreases by an expected 0.9 hares due to predation

The second equation in the Lotka-Volterra model tracks the abundance of the predator population. What does a represent?
conversion efficiency of prey into offspring

The second equation in the Lotka-Volterra model tracks the abundance of the predator population. If a is 0.2, what does that tell us regarding the lynx population?
for every 1 hare consumed the lynx can make 0.2 (20%) of an offspring

The second equation in the Lotka-Volterra model tracks the abundance of the predator population. Our a is still 0.2. If 10 hares are eaten by a lynx, how many offspring can be made?
10×0.2= 2
2 offspring can be made

The second equation in the Lotka-Volterra model tracks the abundance of the predator population. What does the m stand for? What does mP stand for?
m= predator mortality rate
mP= number of lynx that die (removed)

whats the 1st principle of the Lotka-Volterra model?
the differences between population additions and removals determines the rate of population change

whats the 2nd principle of the Lotka-Volterra model?
encounters between a predator and prey depend on their abundances

whats the 3rd principle of the Lokta-Volterra model?
predators need to eat many prey to gather enough energy to reproduce

whats the 4th principle of the Lokta-Volterra model?
predators can’t live forever
After using parameters given, you get dN/dt=1.81 and dP/dt= -0.31. What does that mean for the hare and lynx populations?
The hare should be increasing in population while the lynx should be decreasing in population
What kind of diagram can predator-prey abundances switch to?
phase plot
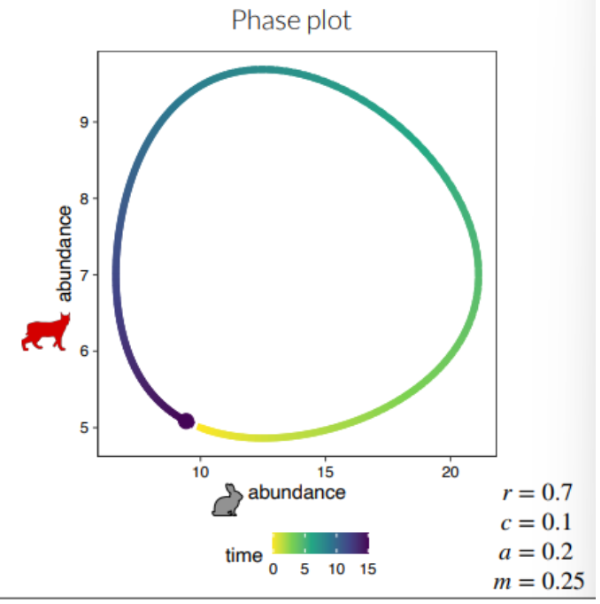

Lets take this timeseries plot here. At time 5, how many lynx and hare are there. At time 10, how many lynx and hare are there. Now check the phase plot. Do those numbers match up?
isocline
point where a populations growth rate is 0

In order to find the prey isocline, we set the hare growth equation to 0. If r=0.7 and c=0.1, whats the amount of lynx required so that the hare population is neither increasing or decreasing?
7 lynx are required to keep hare at equilibrium
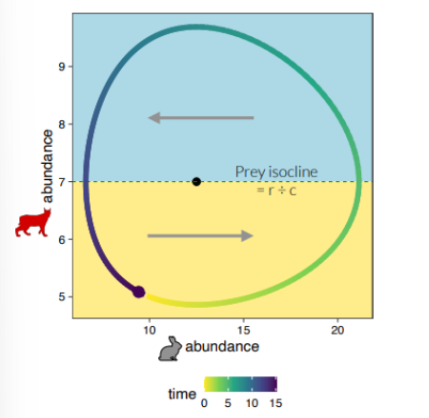
This graph shows what happens when we draw in the prey isocline. What happens when we go above 7 for lynx? What happens when we go below 7 for lynx? Remember, just focus on moving that prey isocline up or down.
If there are more than 7 lynx, the hare population decreases. If there are less than 7 lynx the hare population increases.

In order to find the predator isocline, we set the lynx growth equation to 0. If c=0.1, a=0.2, m=0.25, whats the amount of hare required so that the lynx population is neither increasing or decreasing?
12.5 hare are required to keep lynx population at equilibrium

This graph shows what happens when we draw in the predator isocline. What happens when we go above 12.5 for hare? What happens when we go below 12.5 for hare? Remember, just focus on moving that predator isocline left or right.
If there are more than 12.5 hares, lynx population increases. If there are less than 12.5 hares, lynx population decreases.
Joint equilibrium point
where the prey and predator isocline intersect meaning both hare and lynx population have a growth rate of 0

This graph shows what happens when you put both prey and predator isoclines together. It is broken into four sections. Describe what is happening in each section in terms of upper or lower and right or left.
upper right= hares are decreases while lynx are increasing
upper left= both are decreasing
lower left= hares are increasing while lynx are decreasing
lower right= both are increasing

Type I functional response
predators rate of prey consumption increases linearly with prey density until satiation
What model do we see type I functional response occur?
Lotka-Volterra model
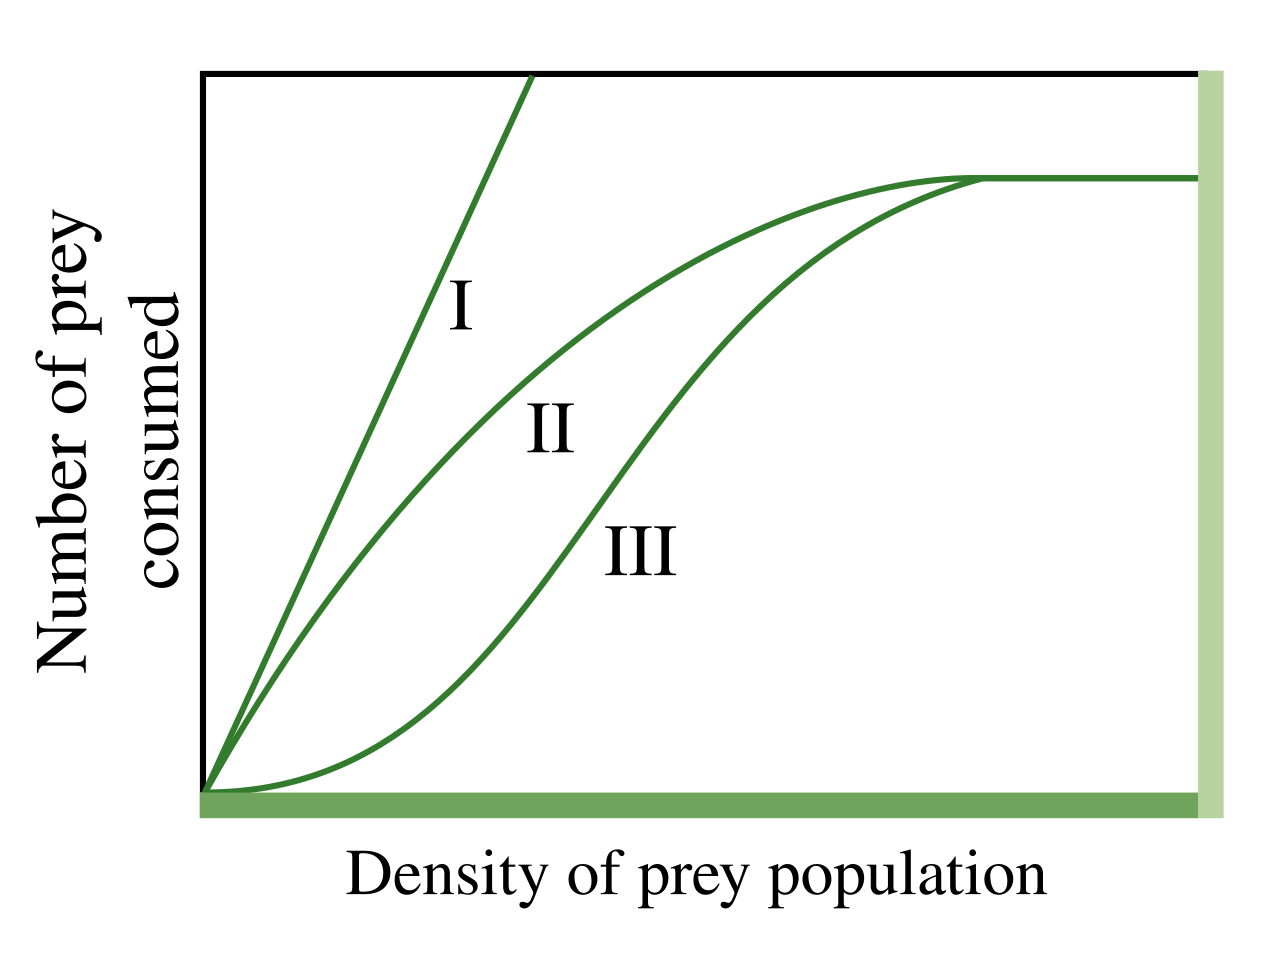
Type II functional response
predators rate of prey consumption increases linearly but begins to slow as prey density increases
Why are otters considered Type II functional response?
they have high prey handling time since they have to crush crab shells in order to eat them
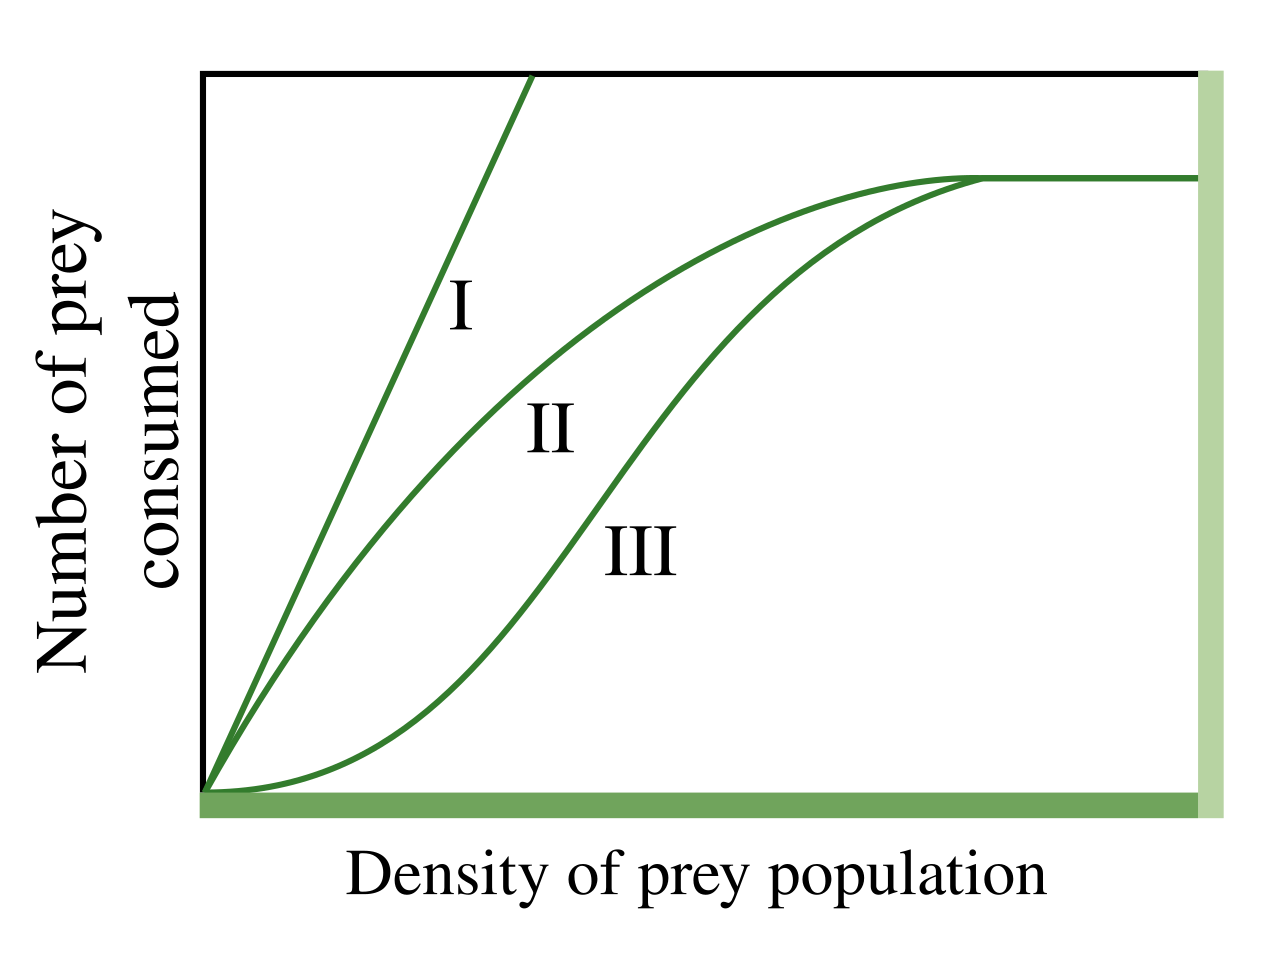
Type III functional response
predators rate of prey consumption is low then rapid then slows when prey become abundant
when do we see Type III functional response in real life?
when prey hides, when predators need practice, and when predators switch prey
Whats a numerical response?
an increase in predator density through population growth or migration