Chapter 8 - Molecular Orbital Theory
 Call Kai
 Learn
 Practice Test
 Spaced Repetition
 Match
 Flashcards
 Knowt Play
1/21

Earn XP
Description and Tags
14/11/2026
22 Terms
the idea behind molecular orbital theory
we know that all atoms have their own unique orbitals for their valence electrons, so when they come close together, there must be some kind of overlap between the orbitals
this is the idea behind molecular orbital, in which we work to combine existing atomic orbitals to make new ones that give better descriptions of where electrons are in whole molecules, using the concept of wave superposition
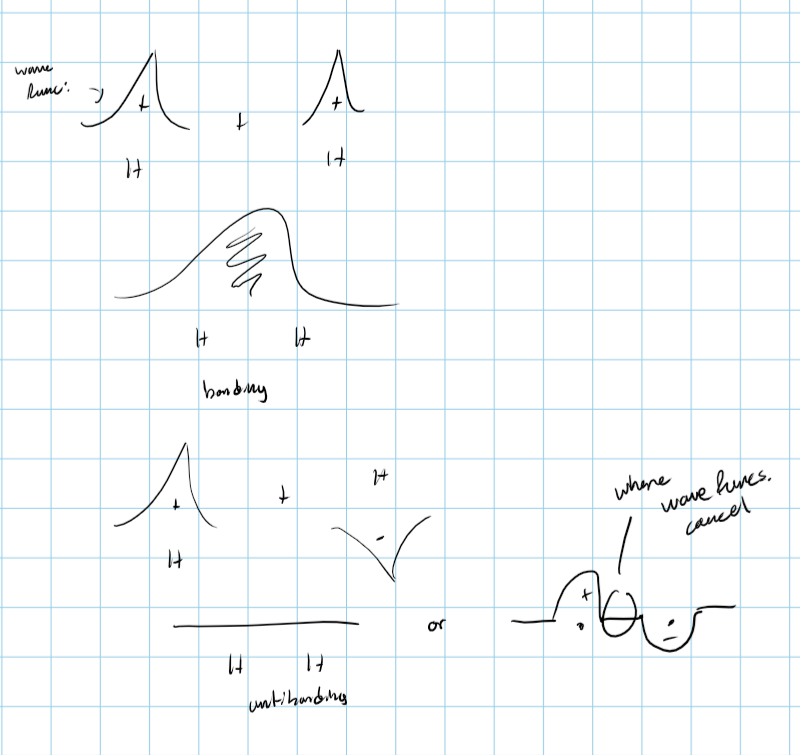
we started with H2
as atoms, each hydrogen has 1 e in their orbitals
if d reps the distance between the nuclei, at d = inf, there’s zero overlap between the orbitals of both hydrogens, and thus zero overlap in their wavefunctions
but, as they get closer (as H2 begins to form), their wavefunctions begin to overlap
if constructive interference occurs between the atomic orbitals (wavefunctions), a bonding molecular orbital forms between the two molecules, and increases the electron density between the nuclei
this increases stability by lowering the overall energy of the molecule
if destructive interference occurs, an antibonding molecular orbital forms, and reduces the electron density between the nuclei
this decreases stability, because it allows the nuclei to be more repelled by each other (because there’s less negative charge between them)

explain this graph
this graph displays the energy level of an H2 molecule at varying internuclear distances, and what it is showing is that the closer the two nuclei are, the more energy the molecule will have due to the greater overlap in atomic orbitals.
again, this is because the atomic orbital wavefunctions are out of phase, meaning that they do destructive interference when they overlap, and decrease the electron density between the two nuclei
that results in a higher amount of repulsion between the two nuclei, because there is less negative electrons between them, which makes the molecule unstable
also, this graph starts at 0 energy, because when the atoms are far apart, there’s no forces acting between them, and because antibonding molecular orbitals can only increase the energy

explain this graph
this graph displays the energy level of an H2 molecule at varying intermolecular distances, and what it is showing is that the closer the two nuclei are, the less energy the molecule will have due to the greater overlap in atomic orbitals.
again, this is due to the constructive interference occurring (they met each other while in phase) between the two atomic orbitals as they come close enough to overlap, and increase the electron density between the two nuclei
this results in a lower amount of repulsion between the nuclei, in fact, they are both attracted to the dense electron cloud in the middle, meaning they shrink the distance between them. this lowers the repulsion energy, and makes the molecule more stable overall
note that the energy caps at zero, because bonding molecular orbitals only lower the energy of a molecule, and because when the two H atoms are far enough apart to ot feel anything between them, there’s zero energy at all.
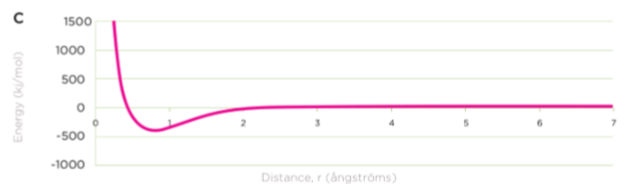
explain this graph
this graph depicts the potential energy between two hydrogen atoms as a function of the distance (in angstroms).
going from right to left, the potential energy begins at zero, because the atoms are still too far apart to have any overlap between their orbitals at all.
then, as they get closer, there’s a drop in potential energy, as the overlap begins to form a bonding molecular orbital (we know it is bonding, because had it been antibonding, they would’ve began to repel each other immediately, and there would never had been a dip in the energy.
the energy level continues to drop as the overlap increases as distance decreases, until we hit this sweet spot between 0-1 angstroms. then, the potential energy begins to rise sharply, as the two nuclei get so close that they over come the attraction they both have to the dense cloud of electrons between them, and then begin to repel each other.
summary of what these graphs tell us
for the top two graphs:
constructive interference (bonding MOs) lower energy (and instability), destructive interference (antibonding MOs) raise energy (and instability)
the greater the overlap of orbitals, the greater the energy gap b/w bonding and antibonding MOs
as the internuclear distance decreases, the energy of the antibonding orbital increases, and the energy of the bonding orbital decreases
for the bottom graph:
the potential energy of the H-H bond is a function of the nuclei distance , and includes the energy of the bonding orbitals and the repulsion between the nuclei. at a small distance, the repulsion dramatically raises the potential energy
energy minimum shows the nuclei distance for which a system has the lowest energy, and this is the ideal bond length. the energy of the molecule at this point is the ideal bond energy
nodes and molecular orbitals
for bonding orbitals, there is no node between the two atomic orbitals, (meaning they are in the same phase, and leading to the constructive interference)
and for antibonding orbitals, there is a node between the two atomic orbitals, (meaning they are not in the same phase, leading to the destructive interference)
beginning summary
the total number of molecular orbitals formed is always equal to the total number of atomic orbitals that are interacting
when two atomic orbitals are combined, the resulting bonding molecular orbital has fewer nodes than the resulting antibonding molecular orbital
only atomic orbitals of similar energy interact. (ex: 1s + 1s, not 1s + 2s)
they don’t have to be the same orbital, but they do have to be similar energy
what does an orbital interaction diagram look like for molecular hydrogen?
here:

how to fill an orbital interaction diagram with electrons
find total number of electrons in the atomic orbitals
fill the molecular orbitals with that many electrons
fil the lowest energy orbitals first (aufbau principle)
place a maximum of two spin-paired electrons in each MO (pauli exclusion principle)
place electrons in degenerate MOs singly, with the same spin, before pairing them (Hund’s rule)
also, spin has no effect on the interaction between two AOs
what would an excited orbital interaction diagram look like for molecular hydrogen
here:
note how exciting it can make the molecule less stable as raising the one electron to an antibonding (higher energy) orbital, will make the bond order 0 which means theres no bond.

how do you calculate bond order??
bond order =
(# of electrons in bonding MOs - # of electrons in antibonding MOs) / 2
also, reminder that bond order is the number of bonds b/w two atoms, not bond length (although a high bond order typically means a low bond length)
how can we label an orbital?
based on its symmetry: if the mo has cylindrical symmetry, we refer to it as a σ (sigma) bond. if it does not have cylindrical symmetry, we refer to it as a π bond.
we also label by bonding/antibonding: if it is an antibonding orbital, we include a star in the name.
we also label based on the AOs the MO is made out of
so an example: the antibonding orbital made out of two overlapping 1s orbitals, and that has its molecular orbital on the intermolecular axis of the question would be a σ*1s orbital
what does a molecular orbital interaction diagram look like when the two atoms have multiple shells?
as you can see, all of the shells are spaced apart, because in real life, these orbitals are far enough apart that no interaction occurs between them
additionally, you’ll see a greater energy gap between the bonding and antibonding orbitals of each shell as we go up, because the 1s orbital is always smaller than the 2s, which is smaller than the 2p, and at the ideal bond length, there will be more overlap between the bigger orbitals than the small ones, which we know leads to a bigger difference in energy between the bonding and antibonding orbitals.
also, you’ll notice the existence of pi bonds now. they have the same idea as the difference in energy as the shells. the orbitals that are on the internuclear axis will overlap head-on and more overlap means a greater energy difference
note that as the internuclear axis changes, so does which bond is the sigma bond and which are the pi bond.
as well, the energy differences this describes is only a qualitative measurement. there’s no numbers attached to it


important takeaways from this diagram
the π2py and π2pz orbitals are degenerate and the π*2py and the π*2pz are also degenerate. this is because other than their orientation. they experience the same amount of overlap, and thus have the same difference in energy
the spacing between the π2p and π*2p is smaller than the gap between the σ2p and σ*2p MOs because of the difference in amount of overlap.
the spacing between the σ1s and σ*1s orbitals is smaller than the spacing between the σ2s and σ*2s orbitals, this is again because of the overlap. the 1s orbitals are smaller, so they overlap less than the larger 2s orbitals.
aufbau principle applied to molecular orbital interaction diagrams that have degenerate orbitals
if they’re sitting beside each other, do hund’s rule and fill same spin one at a time.
if there’s just one orbital there, you follow all the rules filling as full as you can immediately.
sigma bonds and pi bonds and the intermolecular axis
any of the of the MOs formed by the interaction of shells that have multiple orbitals can have one of their orbitals be a sigma bond. the only thing that determines if a MO is a σ or π is the intermolecular axis, and which orbitals are on it.
HOMO and LUMO
the homo is the highest occupied molecular orbital
the lumo is the lowest unoccupied molecular orbital

explain this graph
for the second period, s/p mixing in the p block decreases from left to right. what this means is that up to and including N2, the diatomics of these elments have their p shell orbitals in a 2121 ascending order. this means that the sigma bond has less energy than the pi bonds, and that the sigma star bond has less energy than the pi star bonds. this happens for B2 C2 N2.
O2 and F2, their orbitals have a 1221 order, where the energy difference between the sigma and sigma star bonds is big enough to fully encapsulate the difference in energy between the pi and pi star bonds.
how to draw σ2px/y/z/σ*2px/y/z orbitals and π2px/y/z/π*2px/y/z orbitals
okay, so if you remember right, 2p orbitals only have one angular node. so youve got two lobes on either side of an axis. now. you can orient these lobes to face each other on the internuclear axis (INA), or face the same direction away from the INA (vertically perpendicular or depth perpendicular).
now. no matter the orientation, start to slide these two atoms together. if they’re in phase they’ll form a bonding MO and both of the lobes will merge into larger lobes.
if they’re out of phase, a new node will form between the approach lobes, and they will not bond. again, this image can be rotated around the axis, including into the page

important observations
MO energy levels decrease in energy from left to right across the period, the experimental fact may be rationalized by the increase in Z and Zeff from boron to fluorine.
between N2 and O2, a change in relative energies of the sigma and pi bonds of the 2p shell is observed. the actual explanation is complex.
but but a partial explanation is due to orbital penetration, and that because the 2s orbital has a lobe very close to the nucleus, the energy of that orbital decreases faster as it approaches the nucleus, than the 2p orbital which doesn’t have much of its area close to the nucleus. therefore, as Zeff goes up, the 2s will feel it more, and decrease faster than 2p
MOs and ionization energy
its technically graphically represented in the way we draw molecular orbital interaction diagrams, but the energy of any atomic orbital will always be lower than the energy of a bonded version of that atom with a bonding MO. (the antibonding MO will be higher tho. anyway. the higher your energy, the lower your ionization energy.