EXST 2201 EXAM 1
 Call Kai
 Learn
Learn Practice Test
 Spaced Repetition
 Match
Match Flashcards
 Knowt Play
 Podcast
1/334

There's no tags or description
Looks like no tags are added yet.
Name | Mastery | Learn | Test | Matching | Spaced | Call with Kai | Chat |
|---|
No analytics yet
Send a link to your students to track their progress
335 Terms
What is an effective way to think of data in the science of statistics?
as a column of numbers
Choose the answer below that correctly ranks the sizes of the following
population> sample> individual
A local cell phone store wants to know how much money, on average, their customers spend at the store. Using store records, they draw a sample of 450 customers and record the amount spent. The average of this data is calculated to answer the shoe stores question. Match each question with its answer below
A. the 450 customers
B. each customer
C. all customers at the store
What is the population, what is the sample, what is an individual?
all the customers at the store is the population, the 450 customers is the sample, and each customer is an individual
LSU wants to conduct a survey of high school seniors in Louisiana concerning their plans for future education. The survey asks three questions: gender, GPA, and number of siblings. Match each variable with its type below
A. discrete
B. qualitative
C. continuous
Gender
GPA
Siblings
gender is qualitative, GPA is continuous, siblings is discrete
Information about automobiles was collected and put into a data set with three columns. The columns contained information on: weight, number of seats, and body style. Match each variable with the type of data it contains below
A. continuous
B. discrete
C. qualitative
Weight
Number of Seats
Body Style
weight is continuous, number of seats is discrete, body style is qualitative
What type of variable is the focus of much of the science of statistics?
continuous random variables
A properly done random sample always results in a good sample of the population?
no, because random sampling does not guarantee a good sample
At a birthday party, teams are chosen by putting everyone’s name into a hat. Then names are drawn from the hat to make up each team. What type of sampling is this?
random sampling without replacement
In a data set used in statistics (imagine a MS Excel spreadsheet), match each type of information with its location below.
A. in a row
B. in the data set
C. in a column
Variable information
Individual information
All the information
variable information is in a column, individual information is in a row, and all the information is in the data set
The Gallup News Service sent out 2,000 questionnaires for a survey about climate change. 1,004 people responded to the survey and gave their opinion. What type of data study is this survey?
an observational data study
Which one of the following situations cannot be used as a data set in the science of statistics?
an image of the milky way
Statistics is the science of decision making using random selection of choices
no, statistics uses a random selection of individuals
A local cell phone store wants to know how much money their customers spend at the store. They decide to use the average as the indicator. Using store records, they draw a sample of 450 customers and record the amount spent. Match each question with its answer below
A. the amount of money spent
B. the average amount spent
C. each customer
What is an individual?
What is the variable measured?
What statistic answers this question?
each customer is an individual, the amount of money spent is the variable measured, and the average amount spent is the statistic that answers this question
A researcher is curious about the IQ of students at a local university. The entire group of students enrolled in the university is an example of what?
a population
What is the third step in the method to determine the type of data.
pick any two data values
can they be ranked on the real number line?
are there more than fifteen possible data values?
What type of data is the time in a 500 meter ice skating speed race?
continuous data
What type of data is the time in a 500 meter ice skating speed race?
continuous data
If simple random sampling does not guarantee a good sample, representative of the population, why use simple random sampling at all?
because there is no better way to get a sample
IQ tests are standardized so that the mean score is 100 for the entire group of people who take the test. However, if you select a group of 50 people who took the test, you probably would not get a sample average of 100. What statistical concept explains the difference between the two values?
sampling error
At a local seminar, every attendee was given a ticket having a number. During the seminar, numbers were randomly calculated, and a small gift was given to the attendee with that number. Is it possible for an attendee to get more than one gift?
yes, because this is sampling with replacement
Sampling with replacement can give a sample size larger than the population, but does sampling with replacement give more information about the population?
no, because the same information is being reused
Are columns of data values that are constants allowed in a data set used in the science of statistics?
yes, but they might not be used in the statistical analysis
What is the source of the information contained in the columns of a statistical data set?
variable information
What type of study of data is putting cages of fish in different areas of a large lake and measuring their growth rate?
both of these other answers
Is statistics the science of making random decisions?
no, statistics is a science based on randomly selected data
What is the actual purpose of statistics?
to get information from data to help make better decisions
IQ tests have a population mean score of 100 IQ-points. If you select a sample of 50 people who took the test, their sample average would likely not equal 100. What statistical concept explains the difference between this population mean and sample average?
sampling error from probabilistic data
The average age of students enrolled in last Fall’s statistics class was found to be 24 years of age. What type of statistics does this statement describe?
descriptive statistics
A statistical method indicated that the population mean age of students enrolled in last Fall’s statistics class was 25 years old. What type of statistics does this statement describe?
inferential statistics
The distribution of a column of data values is given by what three characteristics of the column of data values?
shape, location, and spread
Do location and spread measure the same characteristic in a column of data values?
no, location measures middle and spread measures width
In this course, is the mathematical distance between two points usually greater than the statistical distance?
yes, the larger the standard deviation, the smaller the statistical distance
In this course, is the mathematical distance between two points usually greater than the statistical distance?
yes, the larger the standard deviation, the smaller the statistical distance
In this course, what does the concept of close mean for two values?
the two values are close together under a normal curve
Why can the science of statistics determine the relationship between two variables, but cannot determine the causation?
because of the potential presence of a lurking variable
Abstracting information out of a question is the first step in what type of thinking?
analytic thinking, because this starts breaking the problem into pieces
The science of statistics includes organizing data into columns
true, as it makes it easier to deal with large amounts of data
What kind of data is the science of statistics designed to work with?
probabilistic data, because this kind occurs frequently in nature
Which of the following is NOT a descriptive statistic?
a confidence interval giving population information
Which of the following is NOT a common way to see a distribution?
a pie chart, showing all the relative sizes of each category
In the science of statistics, and in this course, how is the mathematical distance between two values found?
by taking the difference between the two values
In the science of statistics, and in this course, how is the statistical distance between two values found?
by subtracting the two values, then dividing by the spread of the data
Which of the following is NOT a part of the process of statistical abstraction
writing down the question in fewer words
The distribution of a column of data values measures what three characteristics of the column of data values?
the shape, location, and spread of the column of data values
Match the following data summaries with the characteristics being measured in a column of data values
A. Shape
B. Spread
C. Location
The pattern of data values when graphed
The middle of the data values
The width of the data values
the pattern of data values when graphed is the shape, the middle of the data values is location, and the width of the data values is spread
Which of the following choices is NOT used as a graphical summary in the science of statistics?
a take-over plot
What is the difference between a parameter and a statistic based upon?
population data versus sample data
What is the importance of the Central Limit Theorem state?
it gives the conditions where the sample average has a normal shape
What characteristics of a column of data values is degrees of freedom related to?
size of the column of data values
What type of statistical method extracts the most information about a characteristic out of a column of data values?
efficient statistics
What is the major advantage of using resistant statistics when describing a column of data values?
they are not strongly affected by extreme values
For qualitative data, match the characteristic of a column of data values with the best statistic that measures it
A. Mode
B. Bar Chart
C. Number of categories
D. Count of the data values
Size
Shape
Location
Spread
size and count of the data values, shape and bar chart, location and mode, spread and number of categories
Why is it important to look at the data first, before you look at the statistics?
because the overall shape, and the exceptions, can affect the values of the statistics
Which one of the following choices is NOT true about a parameter?
a parameter can be calculated from a column of sample data values

What type of plot is in the image below?
a bar chart
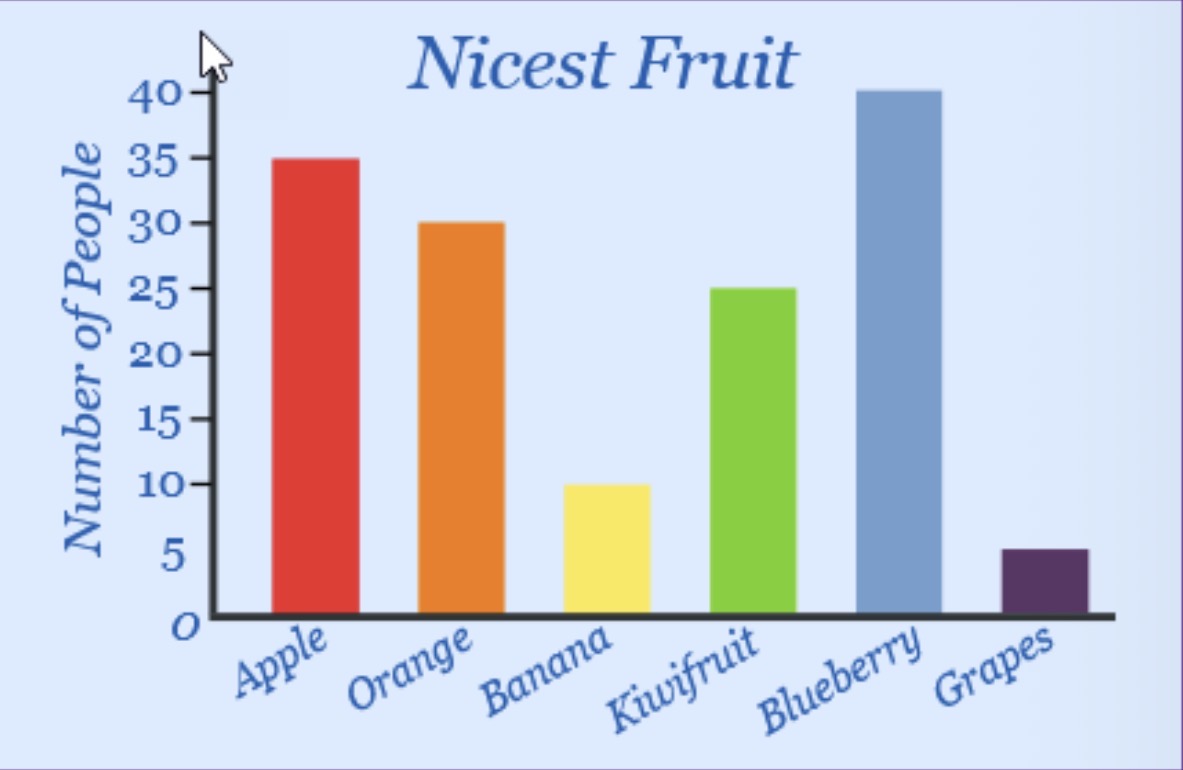
What type of data is depicted in the plot in the image below?
a bar chart

What is the size of the data set depicted in the image below?
145

What is the mode of the plot in the image below?
blueberry

What is the spread of the plot in the image below?
6
Why should you always look at a graph to get shape information instead of just looking at summary numbers for shape?
graphs contain a lot more detail about shape than summary numbers
How do you find frequency in a column of data values?
the number of times a value occurs in a column of data values
Match the columns in a frequency table with their meaning below
A. A partial sum of the Relative Frequency column
B. The proportion of times a value occurs
C. A partial sum of the Frequency column
D. The number of times a value occurs
Frequency
Relative Frequency
Cumulative Frequency
Cumulative Relative Frequenct
frequency is the number of times a value occurs, relative frequency is the proportion of times a value occurs, cumulative frequency is a partial sum of the Frequency column, and cumulative relative frequency is a partial sum of the Relative Frequency column

In the frequency table of 160 data values shown below, what is the relative frequency for the category Mar (march)?
0.1563

In the frequency table shown below, what are the cumulative frequency and the cumulative relative frequency for the category Jun?
160 and 1.0
What two characteristics do you look at to analyze the shape of a column of data values?
overall shape and exceptions
What type of graph is most appropriate to display the shape of qualitative data?
a bar chart, where the bars do not touch each other
Can any, and all, bar charts be changed into a Pareto chart?
yes, because the categories are not over a real-number-line and can be arranged
What type of graph is most appropriate to display the shape of discrete data?
a histogram where the bars do touch each other
In a histogram for discrete data, what characteristic is plotted on the x-axis and on the y-axis?
the value of the data values, and the frequency of each data value
What is the major difference between a histogram for continuous data, and a histogram for discrete data?
the data values are grouped into bins
To use the data value shown below in a stem-and-leaf plot, what is the stem, what is the leaf?
Data Value= 37
the stem is 3, and the leaf is 7

In the boxplot of continuous data shown below, what is the value of the first quartile, the median, and the third quartile?
17.5, 27.5, 37.5
Why is it important to LOOK at the shape of a column of data values BEFORE interpreting any statistics calculated from a column of data values?
to see that the shape of the data values meets the assumptions of the statistical method
What is the general strategy used to analyze the information in a histogram?
step 1: look at the overall shape, step 2: look for exceptions

In the frequency table of 160 data values shown below, what is the frequency for the category May (May)?
40
Which of the choices below is NOT one of the overall shapes?
a modal shape
In a histogram for continuous data, what does a skewed-left shape mean?
a stretched out left tail
Skewness in a histogram is a property of what part of the histogram?
it is a property of the tails of the histogram
Which of the following answers is NOT an exception when analyzing a histogram?
the presence of any distance in the data values
In a histogram for continuous data, how is a gap exception distinguished from an extreme value exception in the histogram?
a gap fits into the overall shape, while an extreme value is outside the overall shape
What is the purpose for binning in a column of continuous data values?
to make a reasonable number of categories

In the histogram shown below, what would be an appropriate analysis for this histogram?
a unimodal, symmetrical overall shape, with a gap to the right

In the histogram shown below, what would be an appropriate analysis for this histogram?
a unimodal, symmetry overall shape, with no exceptions

In the histogram shown below, what would be an appropriate analysis for this histogram?
a unimodal, skewed-left overall shape, with no exceptions

In the histogram shown below, what would be an appropriate analysis for this histogram?
an overall shape to be analyzed in this course
In the stem-and-leaf plot for the 17 data values shown below, what is the data value that gives the circled number four (4)?
84

In the boxplots of continuous data values shown below, what percent of the data values lie inside each box, and what percent lie outside each box?
50% and 50%

In the boxplot of continuous data shown below, what is the value of the mean, and the standard deviation?
not able to determine from this information

Is a boxplot an appropriate graph to display the shape of the data values in the situation shown below?
no, a bar chart is appropriate for qualitative data values

In any boxplot (an example is shown below), the width of the box shows what characteristic of the data values?
a resistant measure of the spread of the data values
Match each characteristic of a distribution of a column of data values with the appropriate efficient statistic below.
A. Standard deviation
B. Mean
C. Histogram
Shape
Location
Spread
shape is histogram, location is mean, and spread is standard deviation
Efficient statistics use what aspect of a column of data values in their calculations?
the values of the data values
Is the sample average a statistical mean?
yes, it is the statistical mean of a column of sample data values
Why is the value of the mean often thought of when considering the information in a column of data values?
because the mean is a single number that best represents all the values in a column of data values
To calculate the sample average, the data values must first be ranked lowest to highest?
false, as the values in a sum can be in any order
What is the value of the sample average for the following six data values?
9 -1 3 8 0 2
3.50
What is the value of the sample average for the following ten data values?
3 4 8 2 -8 2 -10 8 6 -4
1.10
What is the importance of the deviation of a data value in the science of statistics?
it is the basic measure of the spread in a data value
What is the sum of the deviations for the following five data values?
9 -1 4 6 2
0