PT 780 - Anatomy of a research article part 7 (Inferential analysis, results and interpretation)
 Call Kai
 Learn
 Practice Test
 Spaced Repetition
 Match
 Flashcards
 Knowt Play
1/156

There's no tags or description
Looks like no tags are added yet.
157 Terms
What is inferential statistics?
Brach of statistics concerned with testing hypotheses and using sample data to make generalizations concerning populations
Inferential statistics allow you to make which estimates from sample data?
Estimates about pop characteristics from sample data
Which two important concepts of statistical reasoning is inferential statistics based on?
Probability and sampling error
What is probability?
Likelihood that any one event will occur, given all the possible outcomes
When looking at probability of a coin flip or rolling a dice what assumptions are made about the coin and die?
That they are unbiased and not fixed to have one outcome be more common over the other
How can you apply probability to a normal distribution?
Selecting one individual from random you would know the probability that they would fall within X standard deviations of the mean

When applying probability to a normal distribution, does this reflect each individual event?
Not necessarily for a given event but does apply to over the long run

For a sample to be free from sampling error, what assumptions are made about the sample being used?
Estimation of population characteristics from sample data is based on assumption that samples are random and valid representatives of the population
Even in a truly random sample, what is still a possibility?
Cannot be sure that the sample characteristics are identical to those of the population
What is sampling error?
Tendency for sample values to differ from population values
What is the formula for sampling error of the mean?
(x̄-μ)
sample mean - pop mean
If you were to randomly draw an infinite number of samples from a pop, would all the means of each sample be identical?
No there would be varying degrees of sampling error (means would be different)
What is a set of sample means called?
Sampling distribution of means
What are the characteristics of a sampling distribution of means?
It will be normally distributed
Mean of distribution is equal to pop mean
SD of distribution is equal to pop SD

What is the name of the theory that assumes that a plot of all the different sample means creates a normal distribution?
Central limit theorem

The standard deviation of a sample distribution of means is called what? And what is the formula for this?
Standard error of the mean
sx̄ = s/√n
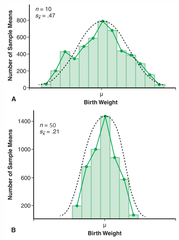
What happens to standard error as sample size increases? And what effect does this have on the plot of sample means?
Standard error decreases
Makes the plot more narrow
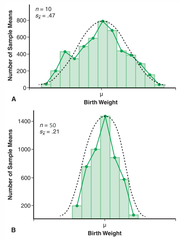
Statistics are stronger when a sample is larger or smaller?
Larger
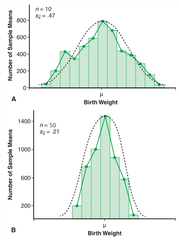
What is a confidence interval?
Range of values within which a population parameter is estimated to fall and the percent confidence it is in those values
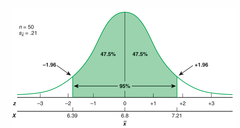
What is the typical confidence interval percent?
95%

What is the formula for a 95% confidence interval?
95% CI = x̄ ± (1.96 × sx)

What is the correct interpretation of a 95% confidence interval in terms of taking multiple samples?
If we took multiple samples, 95% of them would capture the true population mean in the standard error

Would you still see differences between groups even if the experimental treatment is not effective?
Yes random chance and sampling error would create differences even if the new treatment is not creating them
How do you decide if an observed effect is or is not likely to be chance variation?
Through hypothesis testing
What does the null hypothesis suggest?
Group means are not significantly different and observed differences are due to chance
What is the formula for the null hypothesis?
H0 : μA = μB
(H0 : μA - μB = 0)
Which hypothesis suggests that observed differences are sufficiently small to be considered pragmatically zero?
Null hypothesis
What does the alternative hypothesis suggest?
Group means are significantly different and differences are too large to be due to chance (or likelihood of difference is too small)
What would the statistical test for a non-directional alternative hypothesis be called?
Two tailed test
What is the formula for a non-directional alternative hypothesis?
H1 : μA ≠ μB
(H1 : μA - μB ≠ 0)
What would the statistical test for a directional alternative hypothesis be called?
One tailed test

What is the formula for a directional alternative hypothesis?
H1 : μA > μB
(H1 : μA - μB > 0)
H1 : μA < μB
(H1 : μA - μB < 0)

What are the two different decisions that hypothesis testing always results in?
Either:
-reject the null hypothesis
-fail to reject the null hypothesis

If the null hypothesis is true but we reject it, what type of error is this called?
Type I error
(fire alarm goes off with no fire)

If the null hypothesis is false but we fail to reject it, what type of error is this?
Type II error
(fire alarm does not go off when there is a fire)

What is a p value?
Probability that observed effect occurred due to chance
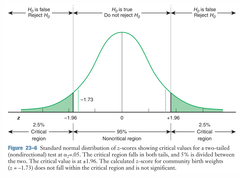
How do you interpret a p value if it is 0.02 or 0.10?
0.02 = 2% probability that observed differences are due to chance
0.10 = 10% probability that observed differences are due to chance
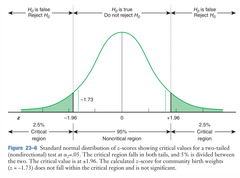
What is level of significance?
Maximum probability level that can be achieved in a statistical test to reject the null hypothesis
(Probability that the null is true, if p is less than 5% then reject null)

Conventionally what is the alpha level that is used?
α = 0.05

What is level of significance also referred to as?
Also referred to as α level

If a p value is less than or equal to 0.05 do we reject the null hypothesis?
Yes we reject the null hypothesis

If a p value is greater than 0.05 do we reject the null hypothesis?
No we fail to reject the null hypothesis

Is a p value of 0.001 more significant than a p value of 0.04?
No if it is less than or equal to 0.05 it is significant, does not matter how much lower it is

When is the alpha level set when collecting data?
Prior to collecting data

What is the symbol for a type II error?
β
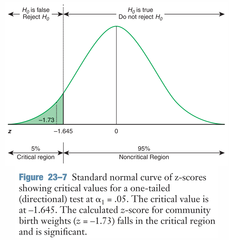
What is a type II error?
Probability of failing to reject a false null hypothesis (H0)
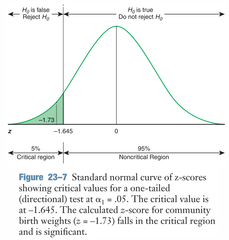
Conventionally what is the probability of a type II error?
0.20 (20%)
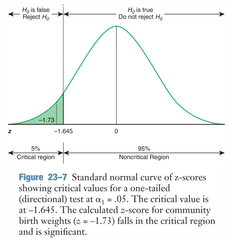
What is formula for statistical power?
1 - β = statistical power

What is statistical power?
Probability that a test will lead to rejection of the null hypothesis
(complement of β error)

If a statistical test has 80% power, what does that indicate about the null hypothesis?
80% chance we would correctly demonstrate a statistical difference and reject the null
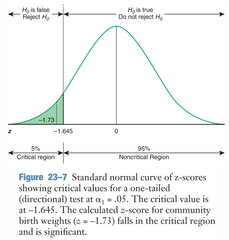
As statistical power increases, what happens to the likelihood of a type II error?
Likelihood decreases

What is the mnemonic for remembering the four interdependent concepts of power analysis?
PANE

What are the four interdependent concepts of power analysis?
P = power (1- β)
A = alpha level of significance
N = number of subjects (sample size)
E = effect size

What type of analysis would you do to determine the sample size in study?
A priori analysis
What type of analysis would you do to determine the statistical power in a study?
A post hoc analysis
What is effect size?
Magnitude of difference between treatments or relationship between variables
(ex. difference between mean of treatment group vs control)
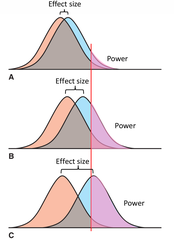
What happens to power of a statistical test as the effect size increases?
Power increases as effect gets larger and variance is reduced
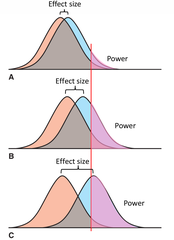
What is effect size index?
Unitless standardization value that allows comparison of effect size across different studies
(proportional relationship of difference to variance)
Cohen's d is the effect size index for what?
Comparing two groups (difference between means divided by pooled standard deviation)
Eta squared (η2) is the effect size index for what type of tests?
ANOVA (analysis of variance)
Standardized mean difference (SMD) is analogous to what?
Effect size index, d
An effect size index of 0.20 is considered what size?
Small
An effect size index of 0.50 is considered what size?
Moderate
An effect size index of 0.80 is considered what size?
Large
If a test is statistically significant does that indicate that the results are clinically significant?
No lower probability does not indicate a larger effect size
(ex. even if there is a statistically significant difference in the test (significance level), the actual difference between treatment and control might be so small there is no clinical significance)
What is a type I error (α)? (review)
When you reject the null when its true
What is a type II error (β)? (review)
When we do not reject the null when it is false
What is power (1-β)? (review)
Probability that a test correctly rejects the null when the alternate is true
What is sample size? (review)
Number of participants/observations
What is variance? (review)
Measure of variability (s2)
What is effect size? (review)
Magnitude of observed difference
If the null hypothesis is true, for points A and B on the picture, do we reject the null or fail to reject the null? And is there an error?
A: Fail to reject null (correct)
B: Reject null (Type I error)

If the null hypothesis is false, for points C and D on the picture do we reject the null or fail to reject the null? And is there an error?
C: fail to reject (type II error)
D: reject null (correct)
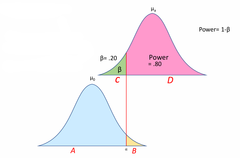
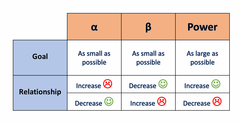
How are level of significance (α), type II error probability (β), and power related?
If one changes then the others are affected

If level of significance (α) were to decrease, what would happen to type II error probability (β) and power?
As level of significance (α) decreases (good):
- Type II error probability (β) increases (not good)
- Power decreases (not good)

If level of significance (α) were to increase, what would happen to type II error probability (β) and power?
As level of significance increases (α) (not good):
- Type II error probability (β) decreases (good)
- Power increases (good)

Summary of relationship between level of significance, type II error probability and power.
As sample size increases, what happens to variance and power?
Variance decreases and power increases
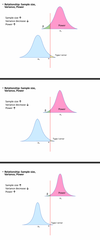
As effect size increases, what happens to power?
Effect size increases and power increases

Parametric tests use what kind of information?
Sample statistics such as mean, standard deviation and variance
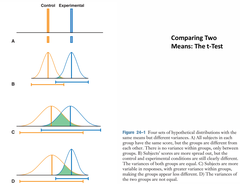
What are some examples of parametric tests?
T-tests
ANOVAS
Certain correlation and regressions

What are the three assumptions when performing parametric tests?
1) Normality
2) Homogeneity of variance or homoscedasticity
3) Interval or ratio

What tests would you perform to determine the normality (samples drawn from normal pops) before a parametric test?
Kolmogorov-Smirnov (KS)
Shapiro-Wilk (SW)
What test would you perform to determine homogeneity of variance or homoscedasticity before a parametric test?
Levene's Test
A nonparametric test uses what kind of information?
Rank or frequency information
What are some examples of nonparametric tests?
Mann-Whitney
Wilcoxon rank sum
Wilcoxon signed-rank
Chi-square
Kruskal Wallis
Certain regression or correlation
What assumptions are made when performing a nonparametric test?
None about the distribution
Just that its nominal or ordinal data
The inferential test option used generally depends upon which 5 factors?
- Type of difference or relationship
- Nature of data (nominal, ordinal, etc.)
- If parametric assumptions are met
- If samples are independent or dependent
- Number of groups being compared
Why would a test of differences be used?
To compare mean scores from two or more groups of subjects or repeated scores from the same subjects
The significance of the difference between two group means is judged by what?
Difference between group means vs variability within groups

What test would you use when performing a parametric test comparing means from two independent groups?
Independent t-test/Unpaired t-test

What statistic and value do you get from an independent t-test/unpaired t-test?
T-statistic and p-value

What test would you use when performing a parametric test comparing 3 or more independent group means?
One-way ANOVA (analysis of variance)

For a one-way ANOVA what statistic and value do you get?
F-statistic and p-value

If a one-way ANOVA was statistically significant, does it tell you which group is more significant than the others?
No you would need to do a post hoc to determine differences between specific groups
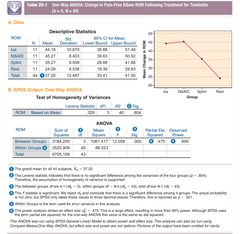
As F or t ratio increases, the p value decreases. What does this mean?
Difference is less likely to have occurred by chance
Which test would you use when performing a nonparametric test of two independent samples?
Mann-Whitney U
Wilcoxon Rank Sum tests

The Mann-Whitney U and Wilcoxon Rank Sum tests do not rely on what?
Do not rely on normal distribution

What do a Mann-Whitney U and Wilcoxon Rank Sum tests calculate?
Probabilities based on sums of the ranking of scores, not the scores themselves

What test would you use when performing a nonparametric test of three or more independent samples?
Kruskal-Wallis
