Cog Sci research methods 2-3
 Call Kai
 Learn
 Practice Test
 Spaced Repetition
 Match
 Flashcards
 Knowt Play
1/23

There's no tags or description
Looks like no tags are added yet.
24 Terms
What is the difference between inferential and descriptive statistics
descriptive - use what we know about world → summarize to data
inferential - use those data → learn about larger group in world
Almost every question in psychology is second kind (inferential statistics). We study a few people because we want to learn about many.
What is population, what does it summarize and can we see it?
Population - Everyone we want to draw conclusions about
it summarizes- Parameters (we want to learn them)
Can we see it - almost never
What is sample, what does it summarize and can we see it?
The people we actually measured
Use stats to summarize
it summarizes - by using stats, to calculate
Can we see it - Yes: it is our data file
What does error mean in sampling error
error means randomness not mistake
Example
Three random samples of adults with clinical depression, all from the same
Population:
Mean symptoms: 8.73, 6.45, 9.44
Correlations between two variables from one population can also vary:
+.24, −.04, +.15.
What is the law of large numbers and what does it imply for sample sizes?
As a sample grows, its mean tends to move closer to the population mean
More data = better/stricter estimates
What is statistical testing and what does it ask
A statistical test turns your data into one number, called a test statistic, and asks how surprising that number would be if the null hypothesis were true.
Test statistic - Number about data

Sum of squares Calculation - add all xs Result - 17.50 |
Variance 17.50/6 Result - 2.92 |
SD of one die Calculation - sq root of variance √2.92 Result - 1.71 |
√n (5 dice) - Calculation - sq root of data points in sample √5 Result - 2.24 |
SE = SD ÷ √n Standard error = standard deviation/ √n Calculation - 1.71 ÷ 2.24 Result - 0.76 |
Give example of sampling distribution
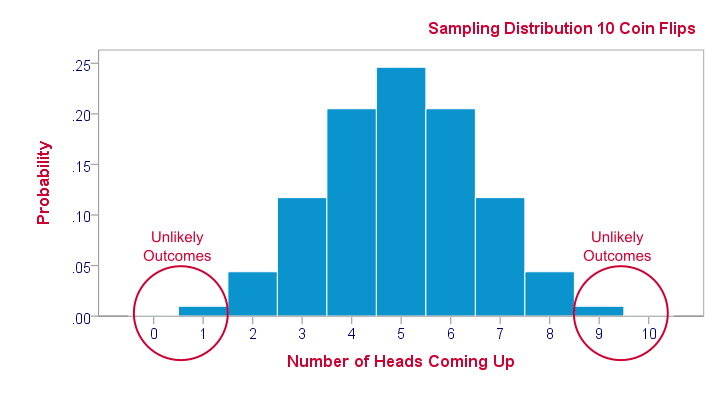
What does a low vs high p value mean
Low p: probably an actual result from ur experiment - surprising if only by chance
the lower the p - decreases type 1 error, increases type 2 error
High p: your result is prob by chance
higher p - increases type 1 error, decreases type 2 error
Example
Ten students take a 5-question true/false quiz. Pure guessing averages 50%.
Their mean score: 61%.
Result: t(9) = 1.94, p = .084
If everyone were guessing, a mean this far from 50% would occur about
8% of the time.
not significantly significant though - would be if it was
p = .05 or p = 5%
p = .84 not enough to tell that they knew what they were doing
This is the literal explanation of the p-value. If the true reality is that people are just blindly guessing (a 50/50 shot), there is still an 8.4% chance that you would get a result this high (or this low) purely due to random variation.
Alpha (α) -
cut-off we choose before seeing the data.
By convention, α = .05
p ≤ .05
reject H₀. The result is “statistically significant.”
If p is less than the .05 you’ll reject the null hypothesis because it shows that there was that small space for it to be due to chance
p > .05
retain H₀ (also called “fail to reject”).
If p is more than the .05 you’ll accept the null hypothesis because it shows that there was that larger space for it to be due to chance
We never “accept” the null - bc its the default
Retaining it only means there is not enough evidence to reject it yet.
We dont have enough evidence to accept it → just fail to reject it
Back to the quiz
Quiz result: p = .084
.084 is greater than .05, so we retain H₀. We cannot rule out that the students were guessing.
Same decision another way: t = 1.94 is less extreme than the critical value of 2.262 for these data.
, it means your study did not find a statistically significant result, and you fail to reject the null hypothesis
One tailed and two tailed tests
Two tailed
Asks: Is there any difference, in either direction?
Critical t (df = 4, α = .05): ±2.78
±2.78: if absolute value of test result over 2.78 then reject null hypothesis’
The numerical cutoff values. The "±" (plus or minus) confirms this is a two-tailed test, meaning you are looking for a significant difference in either direction (much higher or much lower), rather than predicting just one direction
4 degrees of freedom - The number of values in a final calculation that are free to vary. Ex: N-1
here 5-1
Trade off: Harder to pass, but catches surprises
One tailed
Asks: Is there a difference in the direction I predicted?
Critical t: 2.13
Trade off: Easier to pass, but blind to the other direction
1 tailed vs 2 tailed w/ examples
1 tailed - difference in 1 direction
predict there will be a .5 increase in heart rate → only measure in 1 direction - positive
Any difference in both direction - 2 tailed
negative difference in heart rate vs positive difference in heart rate
Test statistic =
effect ➗error
t test - difference between means
One sample
One group vs. a known value
Question: Does this mean differ from a set value?
Does this t in 1 group different to a set value
Ex: Quiz scores vs. 50% guessing
Paired
Same people measured twice
Question: Does the mean difference score differ from 0?
Ex: Infants’ looking time before vs after a song
Tip: a paired t test is a one sample t test on each person’s difference score |
ANOVA
Use one-way ANOVA to compare three or more group means from separate groups.
F = variability between groups ÷ variability within groups
Why not several t-tests? Each one carries a 5% risk of a false positive, so the risk grows with every extra test.
A significant F says the means are not all equal. Follow-up (post hoc) tests show which ones differ
What p < .05 does and does not mean
It Does mean:
If H₀ were true, a result at least this extreme would happen less than 5% of the time
By the convention we chose in advance, we reject H₀
It does not mean:
There is less than a 5% chance that H₀ is true
There is a 95% chance the effect is real - doesnt prove effect is real
The effect is large or important
p > .05 proves there is no effect
NHST (null hypothesis significance testing)
- Assume no effect, ask how surprising the data are, then decide.
Window of chance -
Chance produces a predictable range of results; bigger samples narrow results
p and α
p measures that surprise(result we get) ; we reject H₀ when p ≤ α (.05).
Reject null when p less than or = to alpha of (.05).
The tests
t-tests and ANOVA all compute effect ÷ error
you are testing whether an observed phenomenon (the "effect") is real or just a result of random chance (the "error").