Portfolio Construction
 Call Kai
 Learn
 Practice Test
 Spaced Repetition
 Match
 Flashcards
 Knowt Play
1/106

There's no tags or description
Looks like no tags are added yet.
107 Terms
4 ways to segment portfolio
Size and Style
Geography
Economic activity
Equity indexes and benchmarks
Fundamental weighting
weighting on sales, income, dividends
philosophy: market prices eventually converge to a level implied by the fundamentals
Cash-flow matching (liquidity based mandate)
attempts to ensure all future liability payouts are matched by CFs from bonds (no need for for reinvestment or bond sales)
Duration matching (liquidity based mandate)
immunization approach
match the duration of the assets and liabilities
assets and liabilities should be affected similarly by a change in rates
Derivatives overlay (liquidity based mandate)
close duration gaps between assets and liabilities or alter risk exposures of the assets
You added derivatives to portfolios to make sure the durations equal
Contingent immunization (liquidity based mandate)
Combines active management with liability immunization
The manager actively seeks excess returns while portfolio assets exceed the cost of immunizing liabilities.
If assets fall to a predetermined safety threshold, active management stops and the portfolio is immunized to ensure liabilities can be met.
Pure indexing (total return mandates)
Match benchmark return and risk as closely as possible
Match weights, risk factors and turnover as close as possible to the benchmark
Enhanced indexing (total return mandates)
Objective is for modest outperformance (~20-30 bps) of benchmark
Small deviation in weights from the benchmark
Most risk factors are closely match to the benchmark with slightly higher turnover than benchmark
Active management (total return mandates)
Objective is higher outperformance of benchmark (~50pbs) with higher active risk levels
Portfolio weights have significant deviations form benchmark
Large risk deviations from benchmark and considerably higher turnover than benchmark
Highest management fees
Macaulay Duration (MacDur)
The weighted average time until a bond's cash flows are received, where each payment's weight is its share of the bond's total present value (price).
The investment horizon at which the effects of interest rate changes can approximately offset each other.

Modified Duration (ModDur)
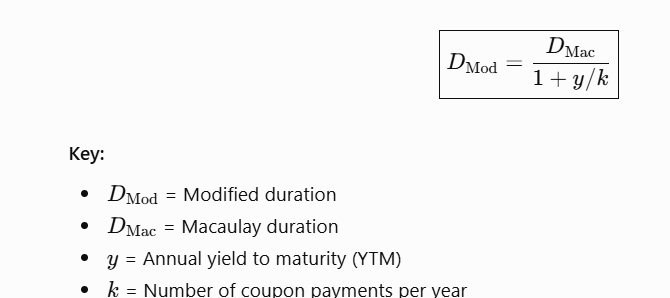
Modified Duration is Macaulay duration divided by one plus the yield per period.
Estimates the bond's price change for a 100 bps change in yield
Effective Duration (EffDur)
Measures how sensitive a bond’s price is to a parallel shift in the benchmark yield curve
Useful for complex bonds with uncertain future cash flows (options)

Key Rate Duration (Partial Duration)
Measures how sensitive a bond’s price is to an interest rate change at a specific point on the yield curve
Changes in the shape of the yield curve (steepening, flattening, or curvature) affect the bond’s price.

Empirical Duration
Measures a bond’s interest rate sensitivity using historical market data.
Calculated by running a regression of bond price returns against changes in a benchmark interest rate.
Example: Regress a 10-year corporate bond’s returns against changes in the 10-year government bond yield.
No formula it is observed
Money Duration
Measures a bond’s price sensitivity to interest rate changes in currency units, rather than percentages.
Can be expressed per 100 of par value or for the actual position size in a portfolio.
Commonly called dollar duration in the US.
Formula: Money Duration = ModDur * PV full
Spread Duration (SD) (Portfolio Statistic)
measures a bond’s price sensitivity to changes in its credit spread, holding the benchmark interest rate constant
Duration Times Spread (DTS) (Portfolio Statistic)
DTS = spread duration * credit spread
Increase credit risk exposure:
longer maturity bonds
lower quality bonds
Portfolio dispersion (Portfolio Statistic)
Variance of time to CF with respect to MacDur
Weighted variance
higher dispersion → higher convexity
Total expected return E(R)

Current Yield (coupon Income)

Rolldown Return
Change in price by the passage of time
%ΔPV assuming an unchanged yield curve over the strategy horizon

Curve Effect - View of benchmark yields
Δcurve = expected average change in the benchmark yield to maturity

Credit spreads - View of yield spreads

Views of currency value changes

Rolling Yield
Rolling yield = coupon income (% of current price) + rolldown return
Rolldown return = (Bond price end - Bond price beginning) / Bond price beginning
Leveraged Return

Separately Managed Account (SMA) / Fund-of-One
very high minimum investments
greater operational challenges for both manager and investor
may be disadvantage if GP has other funds with higher fees competing for the same limited investment opportunity, usually the GP invests in the funds as well but it this case doesn’t therefore they have less of an interest in it.
Monte Carlo Simulation (Asset Allocation Approaches)
may be used to:
generate return scenarios that deviate from normality
returns now ready for MCVaR optimization
estimate long-term risk profile and return potential of an MVO allocation
Optimization techniques (Asset Allocation Approaches)
MVO will typically over allocate to Al due to underestimation of risk (stale or infrequent pricing) or assumption of normality of returns
Therefore:
establish limits on AI allocations
use optimization methods that incorporate downside risk (mean - CVaR optimization)
2 options:
MOV with/without constraints
Mean-CVaR optimization
Mean-Variance Optimization (MVO)
Determines optimal asset allocation based on:
Expected returns
Volatility (variance)
Correlations
Objective → find the portfolio that:
maximizes expected return for a given risk or
minimizes risk for a given expected return
Limitations
highly sensitive to inputs
over allocation to AI
concentrated portfolio
estimation error
assumes variance measures risk
Mean-CVaR
Determines optimal asset allocation based on:
Expected return
CVaR
correlations and downside risk
Objective:
maximizes expected return
minimizes CVaR
Strengths:
Alternative investments
non-normal returns
Limitations:
sensitive to tail estimates
Requires substantial data
Estimation error
Model dependence
Risk-factor based approaches (Asset Allocation Approaches)
Stale pricing and unsmoothing
Skewness and fat tails
Value at Risk (VaR)
The minimum loss over a given period of time.
Example: 95% daily VaR of $1 million means there is a 5% probability of losing more than $1 million in one day.
Conditional Value at Risk (CVaR)
Also called Expected Shortfall (ES).
Measures the average loss when losses exceed VaR.
Captures the severity of extreme losses (tail risk).
Traditional Approach (Investment Opportunity Set)
The usual - growth, income, safety, diversification
says lets start with what asset classes we want to invest in and then diversify from there
Strengths:
easy to communicate
relevance for liquidity management and operational considerations
Limitations
over-estimation of portfolio diversification
obscured primary driver of risk
groups assets together based on a few shared characteristics
Risk-Based Approach (Investment Opportunity Set)
Exposure to risk factors -” equity market risk, size, value, liquidity, duration, inflation, credit spread, currency, etc.
Strengths:
common risk factor exposure identification
integrated risk framework (more reliable risk quantification)
Limitations
sensitivity to the historical look-back period
implementation hurdles
converting risk factor targets to actual investment mandates -” manager selection, rebalancing
sensitive to inputs
Financial wealth
All public and private financial assets representing claims on assets or future cash flows, excluding family-operated businesses classified as productive wealth.
Productive wealth
Assets that can be used to generate income through production and business operation
ie - family business
Investable net wealth
financial assets readily available for investment
PNW often focuses on investable wealth

Real assets
Tangible assets excluding personal assets
Investable Net Worth
Liquid assets - short term liabilities
chequing account usually excluded from liquid assets
Economic net worth
net worth + PV(human capital) + PV(some pension) - PV(future consumption)
economic net worth includes resources that can be used to fund future consumption
Gini Co-efficient
a measure of inequality
the lower, the more equal

Human Capital (HC) formula

Background and Investment Objectives (Parts of the IPS)
Market value of the portfolio and relevant accounts
Any other investment assets outside of the portfolio + any cash flows from external sources
Investment objective:
objective (ie based on facts)
include
required rate of return (nominal or real)
relevant inflation target
with reasonable level of risk (state the risk % if given
sometimes you add time frame too (does not mean the fund is ending just maybe the review period in the IPS)
ex required real return of 6% plus the relevant inflation target with a reasonable level of risk
Investment Parameters (Parts of the IPS)
risk tolerance
investment time horizon
asset classes used
other investment preferences (eg ESG, legacy holdings etc)
liquidity preferences
constraints
Risk Tolerance (Investment Parameters)
ability and willingness to take risk
Investment Time Horizon (Investment Parameters)
Length of time until invested funds are needed
long > 15 years
short < 10 years
Asset Classes Used (Investment Parameters)
The types of assets included in the investment portfolio
e.g., equities, fixed income, real estate
Other Investment Preferences (Investment Parameters)
Personal investment preferences, such as ESG considerations, retaining legacy holdings, and non-advised holdings.
Liquidity Preferences (Investment Parameters)
The investor’s desired cash reserves and anticipated cash needs
Constraints (Investment Parameters)
Restrictions that limit the investments or investment strategies available to the portfolio manager.
Portfolio management (Parts of the IPS)
Discretionary authority
Rebalancing
Tactical changes
Implementation
Duties and Responsibilities (Parts of the IPS)
Wealth manager responsibilities
IPS review
IPS appendix (Parts of the IPS)
modelled portfolio behaviour
capital market expectations
Norway model
traditional styles
60/40 equity/FI
very few AI
largely passive
tight error tracking limits
Benefits:
low cost, transparent, suitable for large scale, easy to understand
Drawbacks:
limited value-add potential
Endowment Model
high AI exposure, active management, out sourcing
suitable for long-term investment, low liquidity needs, skill in sourcing AI
Benefits:
high value-add potential
Drawbacks:
expensive, difficult to implement for very large funds/small funds
Canada Model
high AI exposure
active management
insourcing (Canada model is essentially the endowment model with insourcing instead)
Benefits:
high-value add potential, development of internal capabilities
Drawbacks:
potentially expensive, difficult to manage
Liability-driven investing (LDI) model
focus on hedging liabilities and interest rate risk by using duration-matched FI exposure
may also include a growth component
Benefits:
explicit recognition of liabilities as part of the investment process
Drawbacks:
certain risks (longevity, inflation) may not be hedged
Defined Benefit vs Defined Contribution Pension Plan

Pension liquidity needs are driven by:
proportion of active to retired
age of workforce
plan funded status
participant switching/withdrawals
Budget Stabilization Funds (Sovereign-Wealth Funds)
insulate the budget and economy from commodity price volatility and external shocks
Development Funds (Sovereign-Wealth Funds)
allocate resources to socio-economic projects, typically infrastructure
Saving Funds (Sovereign-Wealth Funds)
To share wealth across generations by transforming non-renewable assets into diversified finacial assets
Reserve funds (Sovereign-Wealth Funds)
Reduce the negative carry costs of holding reserves or to earn a higher return on ample reserves
Pension reserve funds (Sovereign-Wealth Funds)
meet future outflows (shortfalls) with respect to pension liabilities
Endowments vs Foundations

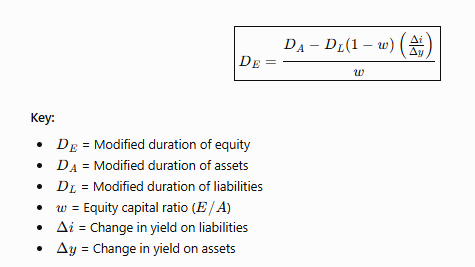
Equity Capital Ratio

Bank’s Modified Duration Equity Formula
L/E = A/E - 1
Quoted spread
The difference between the best ask price and best bid price
Quoted spread = Pask - Pbid
Effective spread
Twice the absolute difference between the actual execution price and the midpoint of the bid–ask spread
Effective spread = 2 * | Ptrade - Pmid |
Works well if there is one trade but does not capture market impact with multiple trades
Implementation Shortfall
Overcomes problems with using effective spread
Captures all explicit and implicit costs of trading
commissions
delay
opportunity
market impact
You take the cost of paper it should have cost, and subtract what it actually cost to get your implementation shortfall

Advantages of Electronic Trading
lower costs for traders and exchanges
execute with perfect discipline
keep perfect records
support/enhance anonymity/privacy
24-hour capability
no need for actual location
Types of Electronic Traders
Electronic new traders
algorithmically scan news releases
use market orders
Electronic dealers
post both bids and asks
Electronic arbitrageurs
Electronic front runners
low latency traders that use artificial intelligence to look for large traders or many small traders on the same side of the market
also look for relation between trades and types of events
Electronic quote matchers
buy if they believe current bids will not be cancelled
sell if they believe current ask prices will not be cancelled
They then buy in on the opposite side hoping for appreciation but if they don’t get that they can sell a few seconds later at a small transaction cost if the bid/ask are firm and not cancelled
Pinging
Submitting small orders to detect hidden liquidity or large institutional orders.
Leapfrogging
Detecting a large order and trading ahead of it to profit from the anticipated price movement.
Flickering
Rapidly posting and cancelling orders, causing displayed liquidity and quotes to change frequently.
Wash Trading
create the impression of market activity at certain prices
Spoofing
Placing trades on the wrong end of the market
Ex placing a large sell order to drive down movement then cancel the order and buy
Bluffing
pump and dump, short and distort
Manipulating prices or investor expectations through misleading activity or information
Gunning the market
selling/buying to trigger stop loss orders
Trigger automatic buying or selling
Squeezing/Cornering
Creating or exploiting a shortage of available securities to pressure traders
Force traders to buy or deliver at unfavourable prices
Targets short sellers who need to cover postions
Explicit Transaction Costs
Brokerage commission
taxes (incl regulatory fees)
exchange fees
Implicit Transaction Costs
bid-offer spread
market impact
delay costs (slippage)
Geography - Portfolio Segmentation
typically based on the stage of market’s macroeconomic development & wealth
developed
emerging
frontier
Benefits:
global diversification
Drawbacks:
specific market indexes may not be as local as desired
currency risk
Segmentation by Size and Style - Portfolio Segmentation
Size: Market Cap
Style: Based on some scoring system (P/B, P/E, div yield, earnings growth etc.)
Benefits:
simplified portfolio construction
no loss of diversification within a style/size category
help define an appropriate benchmark
help keep managers within their style
Drawbacks:
have no clear standardized definitions
may be defined differently among investors
Economic Activity - Portfolio Segmentation
market-oriented
groups companies based on the markets they serve, the way revenue is earned, and the way customers use companies’ products
production-oriented
groups companies that manufacture similar products or use similar inputs in their manufacturing process
e.g. coal company
basic material (production)
energy sector (market)
Segmentation of Equity Indexes & Benchmarks - Portfolio Segmentation
Combine elements of the other 3 portfolio segmentation types
eg:
geography + size/style
geography + industry/sector
Investment approaches
ESG
Private Equity Secondary Market
A market where investors buy and sell existing interests in private equity funds.
Secondary investments are typically seasoned (more mature), resulting in a reduced J-curve effect, shorter remaining investment horizons (often less than 10 years), and earlier capital distributions compared with primary private equity investments.

Key May Risk - Qualitative Due Diligence AI
Dependence on specific individuals; their departure could negatively affect performance.
Style Drift - Qualitative Due Diligence AI
Manager deviates from the stated investment strategy or mandate
Risk Management - Qualitative Due Diligence AI
Inadequate processes for identifying, measuring, and controlling investment risks.
Client Turnover - Qualitative Due Diligence AI
High client departures may signal dissatisfaction or organizational problems
Client Profile - Qualitative Due Diligence AI
Concentration in a few large clients or clients with unstable capital can create liquidity and business risks
Alignment of Interests - Qualitative Due Diligence AI
Alignment of interests issues can be from the complexity of the organization, structure of management fees, compensation of investment professionals, growth in assets under management, and the amount of capital the key professionals have committed to the funds that they are managing
Service Providers - Qualitative Due Diligence AI
Investors should ensure that the fund manager has engaged independent and reputable third-party service providers, including administrators, custodians and auditors
Herfindahl–Hirschman Index (HHI)
measures concentration within a market or investment portfolio, it can be used to assess how diversified a portfolio is across its holdings

Dividend Capture
A short-term trading strategy where an investor buys a stock before its ex-dividend date and sells it on or after the ex-dividend date to collect the dividend without holding the stock long-term.
Upside: When the dividend received exceeds the stock price decline after the ex-dividend date, net of transaction costs and taxes
Downside: Market should reflect the dividend price and you would lose in transaction costs.
Liability-driven investing (LDI) classes of liabilities

Smart Order Routing (SOR)
An automated trading system that directs orders to the trading venue offering the best available execution