ILRST 2100 Prelim 2
 Call Kai
 Learn
 Practice Test
 Spaced Repetition
 Match
 Flashcards
 Knowt Play
1/65

There's no tags or description
Looks like no tags are added yet.
66 Terms
When you _______ the population standard deviation you should use the z-test, when you _________ the sample standard deviation you should use the t-test.
know; estimate
Chapter 7, 7.4 - Checking for Normality and Normalizing Distributions
One way to see whether an assumption of the population normality is possible is to construct a _________ _________ plot of the data
normal probability
a normal probability/quantile plot is a scatterplot of the ( __________ _______, _________ ____________) pairs
normal score, observed value

a strong _________ pattern in a normal probability plot suggests that population normality is plausible
linear
systemic departure from a straight-line pattern such as curvature in the plot indicates that it is ____ _______ to assume that the population distribution is normal
not reasonable
correlation coefficient formula
(Cov of X and Y) / [(STD of X) x (STD of Y)
the correlation coefficient r is used as a quantitative measure of the extent to which the points in a scatterplot fall close to a straight line. a value of r close to 1 indicates a _________ linear relationship in the normal probability plot. If r is too much _________ than 1, normality of the underlying distribution is questionable
strong; smaller
if sample size n is small, an r value somewhat below 1 is _____ __________ even when the population distribution is normal; but if n is __________, only an r value very close to 1 supports the assumption of normality
not surprising; large
if r __ critical r for corresponding n, it is not reasonable to assume that the population distribution is normal
<
Chapter 8.1 - Statistics and Sampling Variability
statistic
any numerical measure computed from a random sample
the observed value of a statistic depends on the particular sample selected from the population and it will _______ from sample to sample. This __________ is called sampling __________
vary; variability; variability
a density histogram visually conveys information about the sampling variability in the statistic x bar, or __________ ________ . It provides an approximation to the distribution of x bar values that would have been observed if we had considered every different sample of size 5 in this population
sample mean

The actual sampling distribution comes from considering ____ possible samples of size n
all
the distribution that would be formed by considering the value of a sample statistic for every possible different sample of a given size from a population is called its ________ _________
sampling distribution
Chapter 10: Hypothesis testing
a hypothesis test has 5 key steps
1. specifying a null hypothesis (Ho)
2. specifying an alternative hypothesis (Ha)
3. calculating a test statistic (z or t test (use either x bar/mu or p hat/p)
4. Finding the p-value of the test
5. making a decision about the null hypothesis
The null hypothesis has p-value of
0.10
The normal distribution is a symmetric, bell-shaped distribution for _________ random variables with mu = _______ as the mean of the distribution
sigma^2 = __________ is the variance of the distribution
continuous
E(x)
Var(x)
Normal random variables (X) can be standardized through the z formula: z = ?
(X (value) - mu (mean))/sigma(st deviation)
p(a < x < b) =
P((a - mu)/sigma < z < (b-mu)/sigma
= P(a* < z < b*)
given a percentile that corresponds to a particular z-score z*, the corresponding value of the unstandardized normal is...
x* = mu + sigma(z*)
in a normal quantile plot, data that are skewed to the right will have a curvilinear pattern with points at the tails ________ this line
data that are skewed to the left will have a curvilinear pattern with points at the tails _________ this line
below; above
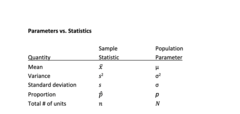
a random sample of size n...
is a sequence of n independent random variables X1, X2, ..., Xn that follow the same probability distribution that has mean mu and variance sigma^2
statistics are...
numerical measures computed from a random sample
parameters are...
corresponding numerical measures computed from a population

while values of a statistic are _______ from the sample, population parameters....
known; remain unknown
review page 4 of review sheet
2 rules for a random sample X1, X2, ... where each X is normally distributed with mean mu and variance sigma^2
1. the sampling distribution of X bar is also normal with
2. mean mu and variance sigma^2/n
central limit theorem tells us that a sufficiently large sample size is _______,
n is greater than or equal to 30
central limit theorem also tells us that (two things)
1. sampling distribution of X bar is normal with
2. mean mu and variance sigma^2/n
we can standardize the sampling distribution of x bar so that the standardized variable Z is
(x bar - mu)/(sigma/sqrt(n))
Sampling distribution of a proportion:
the sample proportion of successes p hat can be viewed as the sample average number of successes in the n trials, or p =
X/n
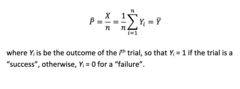
in a sample mean, it will follow a normal distribution with E(p hat) =
p
because trials are independent:
Var(p hat) =
(p(1-p))/n
Chapter 9: single sample estimation
estimation of parameters include
point estimation
interval estimation
sample statistics are _________ for the population parameters. The standard deviation of an estimator is called the ________ _______
estimators; standard error
we prefer estimators that are...
unbiased and have small sampling variability
statistics that are biased have a bias given by REVIEW
B(theta hat) = E(theta hat) - theta
the bound on error of estimation (margin of error) is given by...
B = z(alpha/2) * (sigma/sqrt(n))

Confidence interval formula
P(mean +- z*(sigma/sqrt(n)))
confidence interval is simplified to
x hat +- z(sigma/sqrt(n))
margin of error is given by
b = z(sigma/sqrt(n))

when sigma is not known, the 100(1-a)% confidence interval for mu is...
x hat +- t(sigma/sqrt(n))
Interval estimation for the population proportion, p
standard deviation(p hat) is
sqrt((p(1-p))/n)

z score for an interval estimation for the population proportion p
z = P hat - p/sqrt((p(1-p)/n)
- this follows the standard normal distribution

the Wald (1-alpha)% confidence interval is
p hat +- z(sqrt(p(1-p)/n)

the sample size needed to estimate the population proportion WITH a desired margin of error B is...
n = p(1-p)* (z alpha/2)^2)/(B)^2

we can choose p = 0.5 to get...
n = 1/4*((z)^2)/(B)^2

for finding the test statistic t when sigma is not known, we have
t = (x bar - mu)/(S/sqrt(n))
t = p hat - po/ (sqrt(po(1-po)/n)

when the stated alternative hypothesis has the test statistic as not equal to the value actually observed, the p-value is
2 * P(T > (x bar - mu)/(s/sqrt(n))

reject the null hypothesis when...
the p-value is less than or equal to the significance level (alpha)
for a one sample t-test for a population mean, a random sample of size n comes from a _________ random variable X
continuous
for a large sample hypothesis test for a population proportion, a random sample of size n comes from a _______ categorical variable X
binary
a sample size must be sufficiently large so that...
np is greater than or equal to 10
n(1-p) is greater than or equal to 10
if sampling without replacement, the sample size is not larger than 10% of the population
when we do not reject Ho and the Ha is true, what kind of error is it?
type ii error
when we reject Ho and Ho is true, what kind of error is it?
type i error
to control Type II error, we should increase sample size so that we have sufficient power, where power =
1 - B
critical value of the test is c =
mu + z(sigma/sqrt(n))
the difference in the sample mean and mu is "statistically significant" when
the confidence interval does not contain mu
practical significance is a statement that the difference between the sample mean and mu is of large enough strength that one would be willing to make...
an economic decision as a result
does statistical significance imply practical significance/vice versa?
No
When the sample size is small (n
similar