Natural Resource Conservation- Riparian Zones - Rangelands
 Call Kai
 Learn
Learn Practice Test
 Spaced Repetition
 Match
Match Flashcards
 Knowt Play
1/21

There's no tags or description
Looks like no tags are added yet.
Name | Mastery | Learn | Test | Matching | Spaced | Call with Kai | Chat |
|---|
No analytics yet
Send a link to your students to track their progress
22 Terms
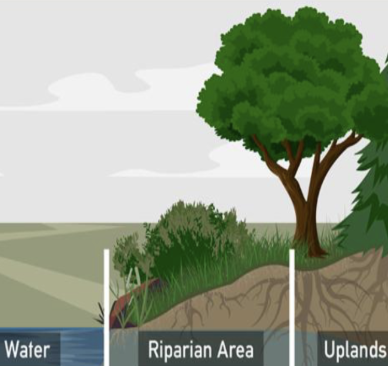
Riparian Zone
Transitional area of land directly alongside a river/stream edge
Experiences periodic flooding
Soils- usually more moisture than in uplands
Vegetation evolved for these conditions
Ex. Willows
Size depends on the system, essentially encompasses what the floodplain might be or a little less
Riparian Zone Functions
Streambank Stabilization and Channel Morphology
Plant roots anchor soil- physical barrier to erosion, reduce water velocity
Strengthened banks create narrower, deeper channels
Nutrient and Sediment Interception
Water passing over veg gets slowed down, giving time for roots to take up nutrients and sediments
Good riparian zone can remove 50-90% of the nitrate
Thermal Regulation and Baseflow Maintenance
Riparian zones can provide canopy cover which keeps streams cool
Water infiltrating increases base flow
Allochthonous Energy Inputs
Good riparian zone introduces C material into system
Add woody debris that dissipates flow energy
Wildlife Corridors and Habitat
Diverse transitional zone
Facilitates movement
Urban Stream Syndrome
Consistent suite of symptoms in streams draining urban/suburban watersheds (Walsh et al. 2005)
Increased impervious surfaces lead to increased runoff
Flashy Hydrology- quick rise and recession of water
Erodes stream bed
Flash floods
Simultaneous pollutant inputs
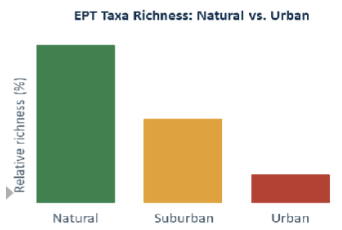
Biotic Simplification- EPT taxa decline, tolerant generalist fish dominate
Agricultural Nonpoint Pollution: The Tile Drain Problem
Conventional Tillage
P attach to soil particles
Surface runoff → particulate P (bound to FE)
Riparian buffer captures sediment
Less bioavailable P → algae can’t use it
Conservation Tillage and Tile Drain
P accumulates in upper soil layer
Tile drain → dissolved reactive P (DRP)
Bypasses riparian buffer entirely
Most bioavailable form → direct HAB fuel
Tile Drain Short-Circuit
Tile Drain Short-Circuit
Conservation tillage reduced erosion (good result) but unintentionally made P loading worse (Ex. Lake Erie)
With tilling, P becomes mixed with the soil profile and binds to soil particles
Without tilling, P stays at the surface and becomes dissolved in rain
Tile Drain Problem on the National Scale: Gulf of Mexico
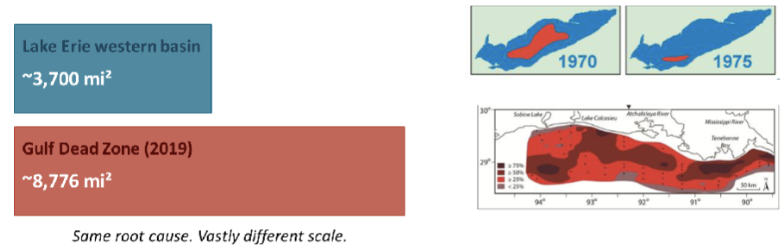
Same mechanism as Lake Erie- eutrophication from agricultural nutrients
Mississippi-Atchafalaya basin drains ~41% of the contiguous US
2019 hypoxic zone- ~8,776 sq miles (size of New Jersey)
Corn Belt nitrogen loading drives massive Gulf primary production
Decomposition of that production consumes all bottom oxygen
Annual monitoring- NOAA Gulf of Mexico Dead Zone Program
Great Lakes Region
180+ non-native species established since European settlement
More invasive species than any other freshwater water body in the world
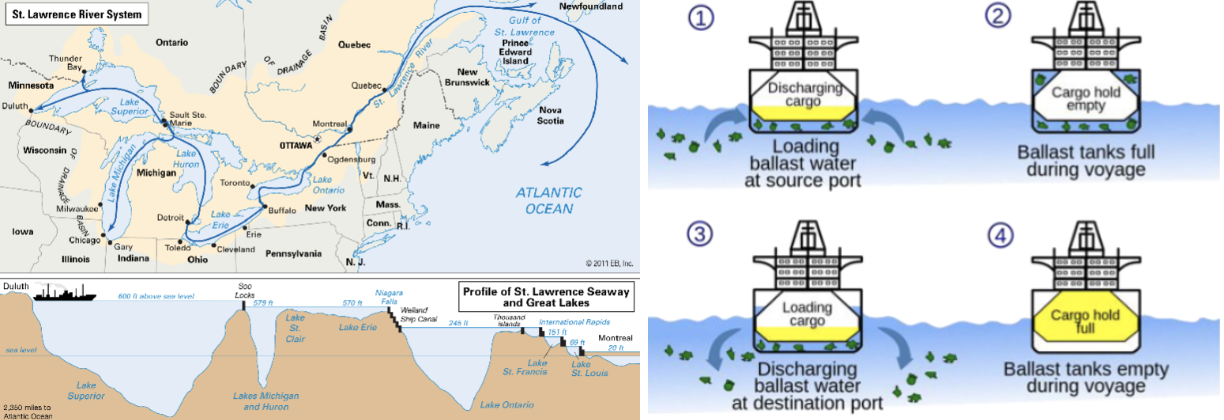
Primary Vector- ballast water discharge from oceangoing vessels transiting the St Lawrence Seaway
Ballast water- chambers in boats that fill with and empty water, helps with weight distribution/stability
Carry veligers (larvae) and adult organisms
Opened in 1959
Primary modern entry route
Dreissenid mussels ranked most impactful (#1 and #2)
Usually spread in veliger form
Zebra Mussel- first spotted in 1988 in Lake St Clair
Quagga Mussel- first documented in 1989, more cold tolerant and can colonize deeper water- ended up outcompeting zebra mussels
Other Major Invaders- sea lamprey, round goby, Asian carp, Eurasian water milfoil
Dreissenid Mussels: 5 Major Issues
Filter Power- ~1L/day per mussel
Changes the food web of the lake
Food Web Restructure- strips energy from the pelagic zone and transfers it to the benthos zone
Process called benthification
Favorable for bottom dwellers
Larval fish face food limitation
Clarity Paradox- more light → explosive Cladophora algae growth → beach fouling and light blocking
Quagga Expansion- colonize soft substrate and deep water
Displaced zebra mussels by 2000s, with quagga mussels making up about 98% of mussels found
Recorded 540ft depth
Economic Cost- $1B/year in infrastructure damage to pipes, water intakes, and cooling systems
Sea Lamprey: A Management Success Story (with Limits)
1829- Welland Canal opens full access to upper Great Lakes
Only native to Atlantic Welland Canal 8 locks by Niagara Falls
1945-1960- lake trout populations collapse in Lakes Michigan, Huron, and Superior
Sea lamprey attach to fish (parasites), bore through scales/skin, and feed on blood and body fluids
When another stressor present, 1/7 survive
One adult lamprey can destroy 40 pounds of fish
1954- Great Lakes Fishery Commission established- US and Canada treaty
1960s- TFM lampricide + barriers + trapping program begins
Control Methods
Spawning stream barriers
Trapping
TFM lampricide- selectively toxic to lamprey larvae at controlled doses
Binational coordination (US + Canada)
Today- ~90% reduction in sea lamprey from peak and lake trout partially recovered
Rangeland
Uncultivated land on which indigenous vegetation is predominantly grasses, grass-like plants, forbs, or shrubs, and which are managed as a natural ecosystem
Uncultivated- not used for growing crops
Croplands and foraging pastures are not rangelands
Provides necessities of life for grazing/browsing animals
Grazing- consumption of free-standing forage (grasses and forbs) (e.g. cattle)
Browsing- consumption of edible leaves and twigs from woody plants (trees and shrubs) (e.g. deer)
Biomes Considered Rangelands
All areas of the world that not barren deserts, farmed/cultivated, or covered by bare soil, rock, ice, or concrete
Desert- landscape where little precip occurs (<10” per year)
Except barren deserts
Tundra- cold, dry, treeless landscape (arctic, Antarctic, high elevations)
All tundras
Wetland- semi-aquatic landscape with permanent or seasonal flooding of groundcover
All vegetation surrounding water bodies
Savanna- mixed woodland/grassland landscape (trees widely spaced; open canopy)
All savannas
Shrubland- landscape dominated by shrubs (woody plants, 3-5cm)
All shrublands
Forest- tree dominated landscape
Only open forests where grass and forbs can grow
Grassland-landscape where vegetation is dominated by continuous cover of grasses
All grasslands
Why Pastureland is NOT Rangeland
Forage Pasture- lands cultivated for agricultural animal production
Vegetation Type
Pastureland- often introduced or non-native veg (often annual plants)
Rangeland- supports native veg (often perennial plants)
Can also have introduced/non-native species
Management
Pastureland- managed by agronomic input rather than ecological principles
Irrigated
Often seeded for introduced or native plant sp
Rangeland- land is managed as a natural ecosystem
Primarily by grazing and fire
Distribution of Rangelands
70% of world’s surface area is rangeland
2.1 billion people (35% of the world’s population) live on or depend directly on rangelands
Rangelands store 10-30% of all soil organic carbon
Rangelands represent 91% of global surface devoted to livestock production
Important Areas- map uses more conservative definition of rangelands in which they make up 50% of world’s surface
The Sahel- Africa
African Savannas that support the last megafauna
Mongolian Step- Central Asia
Tibetan Plateau- Central Asia
Patagonian Shrublands- Southern Argentina/Chile
Argentine Pampas- Central Argentina
Center of Australia- largely uninhabited desert, 70% of continent rangeland

Rangelands in the US
Rangelands account for 61% of US land surface area
US has 15 Rangelands Types:
Grasslands- majority, 6 types, among the most productive rangeland types
Tundra- 1 type
Desert Shrublands- 2 types
Shrubalands, Woodlands, and Subtropical- 3 types
Forests- grazed understory, 3 types
Michigan- used to have tallgrass prairie but almost completely converted to agricultural
About ⅔ of all US rangelands are privately owned
Management is completely voluntary on private land
Includes tribal nations and private ranchers
About ⅓ of all rangelands federal and state owned
Managed by BLM, USFS, NRCS
Believe rangelands should be mutli-use- used for grazing and other things
Condition of Rangelands in the US
Historic Loss- 272 million acres converted from rangeland
Current Condition- 54 million acres failing health standards
Livestock overgrazing is the primary driver
Cause of subpar standards on 72% (40 million acres) of failing lands
Taylor Grazing Act of 1934- put regulations for grazing on public land
Ecological Characteristics of Rangelands
High Precipitation Variability
Within rangelands annual rainfall variation
Between year variability is dangerous with inflexible stocking rates, cannot support same number of animals from good year to bad year
Across rangeland types
Disturbance Adapted- native vegetation has evolved with fire and resistance to drought
Occasional fire and drought good for system
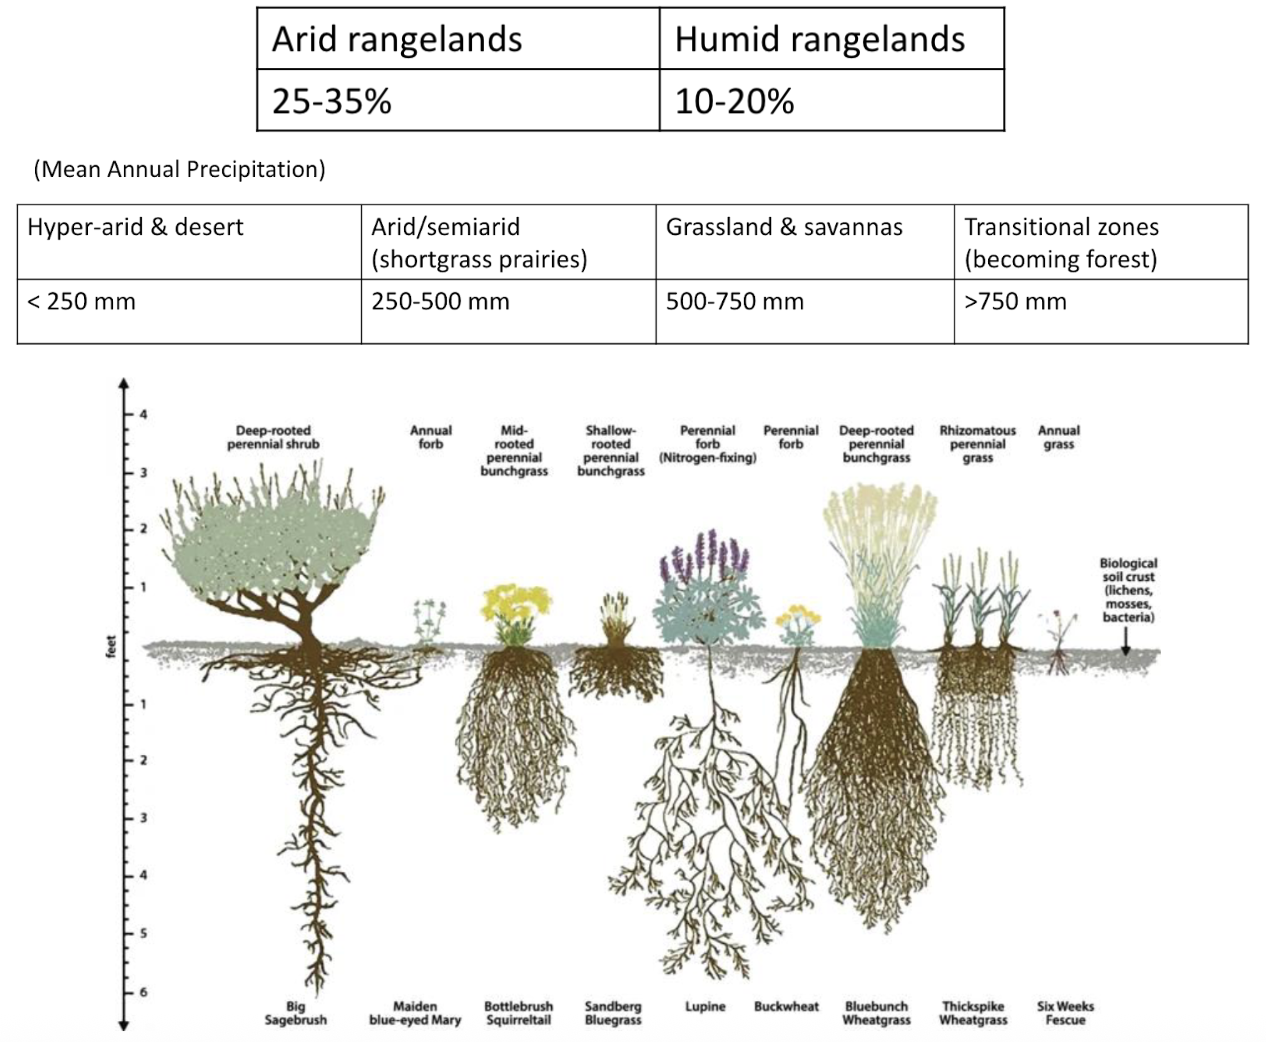
Deep Root Systems- anchors soil, allows plants to access groundwater, can sequester carbon, and allows fire/drought resistance
Roots make up most of biomass
Taproot- deep growing dominant root, one primary root grows very deep, important for accessing groundwater, allows soil pores for form
Fibrous Root- deep expansive network of roots, not as deep as taproot but wider expanding, holds soil in place
Annual forbs and grasses- super tiny roots, don’t want
Biodiversity
Rangeland Dependent Species- adapted to live only on rangelands, need rangelands to survive and thrive
Ex. Bison, prairie chicken, sage grouse
Rangeland Services
Livestock Forage- food and fiber from rangeland forage
Ex. Wool, leather, meat, etc.
Carbon Storage
10% terrestrial biomass carbon- stored in living matter
30% global soil organic carbon
Watershed Function- help water quantity and quality
Infiltration, groundwater recharge, base flow
Rangeland Management Strategies
Proper grazing management
Fire as an ecological process and tool
Water development to reduce overgrazing and protect riparian zones
Grazing Management Core Principles
Stocking Rate and Livestock Type
Number of animal units per an area per unit time
1 animal unit = 1,000lb cow/calf
1 animal unit = amount of forage needed to feed one 1,000 cow and her calf
Used to standardize stocking rate
Timing- season
More susceptible to overgrazing in spring- plant regrowing after winter, little plant matter to do photosynthesis and using energy stores to regrow
Distribution
Fences- prevent animals from going to certain pastures/areas
Water- animals will go 1-2 miles away from water source to graze, surrounding veg suffers
Duration and Rest- amount of time animals are out in a specific area
50% Utilization Rule- remove (graze) no more than 50% of above-ground forage/plant production in any given area per year
More than 50%- plants pull energy from roots to regrow, resulting in risk from drought/fire
Fire as an Ecological Process
Removes accumulated litter and allows nutrients to cycle
Controls woody plant encroachment- one of the biggest threats to rangelands
Wildlife habitat enhancement
Clears things like dense veg
Water Development and Riparian Management
Water development to reduce overgrazing
Protect riparian zones- cattle naturally congregate around riparian zones, trampling it
Can fence them off or move water from riparian area to cattle trough
Threats/Challenges to Rangelands
Climate Change
Increased aridity
Drought intensification
Fire regime changes
Invasive species facilitation
Woody Plant Encrochament
Brush and woody plant in rangeland is not necessarily bad
Becomes bad when they push out grassland