Econ Data Analytics Midterm 1
 Call Kai
 Learn
Learn Practice Test
 Spaced Repetition
 Match
Match Flashcards
 Knowt Play
1/92

There's no tags or description
Looks like no tags are added yet.
Name | Mastery | Learn | Test | Matching | Spaced | Call with Kai | Chat |
|---|
No analytics yet
Send a link to your students to track their progress
93 Terms
Numeric variable — categorical/nominal
the numeric value doesn’t mean anything, but is rather a place holder/replacement instead of putting a character variable. Example: Assigning codes like 1 for male and 2 for female.
Numeric variable — ordinal
numeric value has an order. Example: 1=less than HS diploma, 2=HS diploma, 3=more than HS diploma
Numeric variable — continuous
weight, height, etc. The data collected has no gaps, it can take on any value.
Numeric variable — discrete
limited values between two points on the graph. Example, number of children
Numeric variable — binary
Takes a value of 0 or 1, symbolizing yes or no. Consider dummy variables
Character variables
Variables with data that consists of letters
Time series data
data collected over time, with regular/equally spaced intervals
Cross sectional data
data collected on different individuals at one point in time, like a census report
Pooled data
Mix of time series and cross sectional data
Panel/longitudinal data
Type of pooled data. Its information for which the same cross sectional sample is repeated. Some data points remain constant, like race, but other variables are collected over time, like earnings.
Surveys
questions asked to different respondents. multiple surveys for different periods of time (baseline and follow up), different respondents(employers/employees)
administrative data
data collected by agencies related to their programs to help administer and monitor programs
Extant data
data already available from organizations, not collected for analysis purposes but may have valuable information
client data
data that firms collect on themselves (revenue, sales, output, etc)
Data security/confidentiality is important because
want to keep data from exposing individuals
public use data files
at the end of studies, data may be made open to the public
before release to public, public use data files must first…
strip away all personally identifying information, outliers, and rounding continuous variables
personally identifying information
names, address, phone number, etc
restricted use data files
at the end of studies, some data may be made available on request
difference between data in restricted use data files and public use data files
rudf will have only some PII stripped, not outliers and others. done so to keep data precise
to get access to data in restricted use data files…
provide research question, specify records needed, variables needed, and agree to security requirements
data codebooks
info on the list of variables, their defintions, all possible values, and frequency of variables including missing data
exploratory analysis
initial look at data, understanding its structure and quality, summarizing data, identifying potential patterns.
in exploratory analysis you check for…
outliers and duplicates, making sure to address them
in exploratory analysis, the techniques you use are…
visual, like histograms, box plots, line and bar graphs
descriptive analysis
answers “who what where when to what extent”. it identifies undocumented things, improving understanding of important stuff, patterns in data, and diagnosing problems in need of addressing
steps of descriptive analysis…
develop research question; consider important features; identify constructs; determine if there are observable pattern in data; communicate patterns, rethink and iterate data and findings
quantitative data
low inference and assumption methods, like central tendency, frequencies, and variation
subgroups
smaller groups within the sample that has meaningful categories
qualitative data
focus groups, observations, interviews, and write in responses. in depth and open ended, using software to find key words to find themes, challenges, and lessons learned. can give context for quantative findings
inferential analysis
cant collect data on the full population, so you use the sample and expand the findings to the population
estimation of parameters
true value of population based on the sample
analysis file
file that is fully cleaned and prepped for analysis
specifications document
written document outlining all the work needed to be done before analysis, like data cleaning, analysis, tables and reporting, variable construction, etc
Good specifications document will…
start with background info and motivation of the work, be clearly organized and written, provides specific instructions, and be consistently edited to reflect all decisions made
append data files
copy and paste. You have same variables on separate files but different people. you want all the people in the same file. rows on different files
merging
you have separte files with different observations by the same sample group. have to merge the data
1-1 merge
the key variable is unique in both dataset A and B. each single row in the first file linkes to exactly one row in the second file. its like you just add another column on one of the data sets with the extra column on the other data set. So if A has person 1 is 16, B has person 1 is girl, then you put it together to get person 1 is 16 and girl.
1-many merge
The keyvariable is unique in one dataset, but repeats across multiple rows in the other data set. So if data sat A has Rutgers has 1 math department, and data set B has that math department has Sally, math department has Barny, then you put it together to get that Rutgers has 1 math department with sally and rutgers has one math department with barny. I don’t know like the image in my notes makes sense
many-many merge
key variable repeats multiple times in both the master and the using dataset. so if data set A has the rutgers has math dep and chem dep, and data set b has that math dep has amalia and fabeha, and chem dep has marissa and marika, then overall, combined, rutgers has math dep with amalia, rutgers has math dep with fabeha, rutgers has chem dep with marissa, ad rutgers has chem dep with marika. check computer for the graphs, they make more sense…
collapse
may collapse records to get the right unit of observation, usually but summing information acrossing records. think like revenue across 4 quarters, you collapse to get summed revenue of 1 year
transpose
transpose records to get right unit of observation, or to make it clearer what we are working with. May make data go wide to long or long to wide. think of it exactly like matrices, you are reordering the data to make it clearer, like for exam results, dont have it all in one line, transpose to show first exam, then second exam to make it clear what improvements there are in exams
conditional formatting
create you own rule to identify and address outliers
top code
upper outlier you just set to the next highest value, bottom code is the next lowerst value
data that is missing completely at random
probability of data missing is completely independent of both observed and unobserved data. happens by chance, no bias
missing at random
probablility of data missing is not random, but the missingness can be explained by other observed variables, like younger people less likely to report income, but age is reported so it explains it
missing that depedns on unobserved characteristics
probability of a value missing depends on the unobserved/missing value itself (or on an unmeasured/hidden characteristics). ex: high income earners not reporting their salary
can handle imputations by…
inputting the mean, use last value in a preobservation and carry it forward, regressions, value of relation observation like someone else in the household
exploratory analysis
describe data visually with histograms and bar charts
descriptive analysis
describe data in two key ways: middle/center and spread
central tendancy/middle
mean, median, mode
variation/spread
range, variance, standard deviation
range
highest-lowest
variance

standard deviation
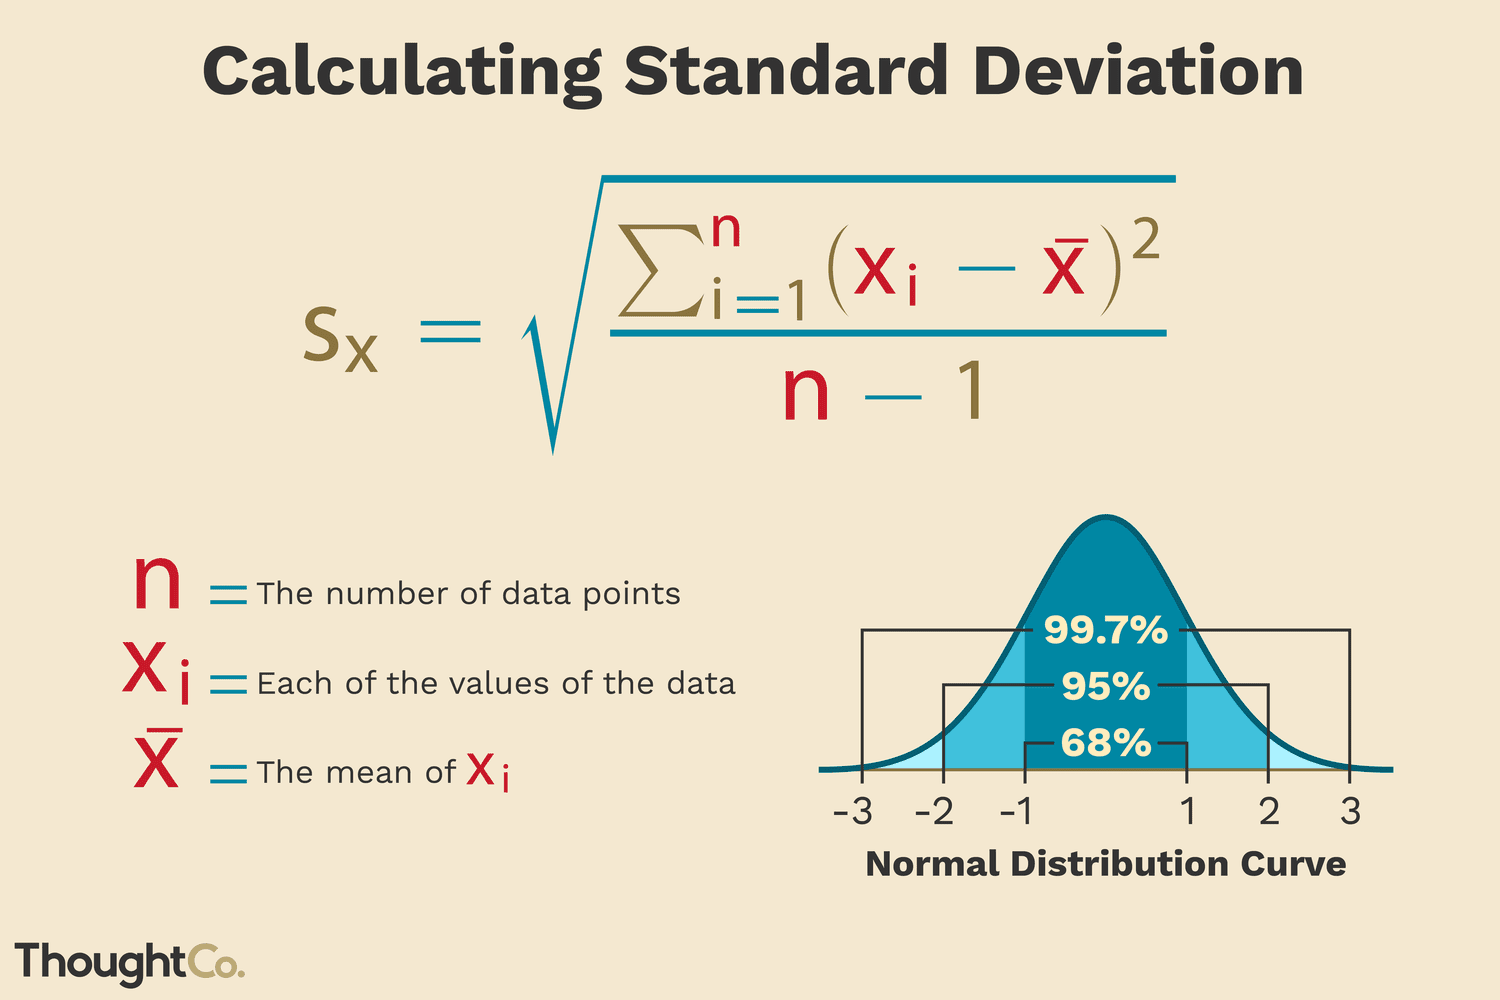
why is std dev better to use than var?
std dev has same unit as the mean
distribution
all possible values for a variable and how often they occur. measured by avg value, variability, skewness, and kurtosis
skewness
measure of lack of symmetry in distribution
no skewness
symmetrical distribution
positive skewness
mean> median, few observation at the high end
negative skewness
mean<median
pearson’s coefficient of skewness

kurtosis
measure of how flat or peaked the distribution is
mesokurtosis
=3, bell shaped and medium tails
platykurtic
<3, relatively flat curve
lotokurtic
>3, peaked in the middle, tightly pushed together
cummulative frequency distribution
final value of the total number of observations in the data points

correlation
how variable relate to one another, ranges from -1 to 1, close it is to absolute value 1, the stronger the correlation
0.0-0.2; 0.2-0.4; 0.4-0.6; 0.6-0.8; 0.8-1
no relate; weak relate; moderate relate; strong relate; very strong relate
spurious correlations
two random associations that have nothing to do with one another and may have another involved variable (in the summer, more people commit crimes and more people purchase ice cream)
reliability tries to answer…
“how do i know that the measurement i use works every time”
reliability is a measure of…
consistency
validity tries to answer…
“how do i know that the measurement actually measures what it is supposed to“
validity is a measure of…
accuracy
nominal level measurement, precision of it
named categories and outcomes that fit into only one cateogry, like blonde, brunette, etc. Least precise because we dont know how the categories relate to one another, only that the cateogries are distinct
ordinal level measurement, precision of it
ordered categories, like ranking top 10 places to visit. but consider if the first 2 places are muuuuch better than other 8, so we know that the cateogires are different and there are rankings, but we dont know how different these rankings are
interval level measurement, precision of it
equal ordered groupings, we know how the categories are different, how they rank, and the difference between categories
ratio level
similar to interval level, but has absolute zero on scale of measurement, so good for physical and biological characteristics with like no light or no movement or whatever. not was great for knowledge based tasts, as having a 0 on spelling test doesnt mean you know no spelling)
observed score vs true score
observed—score an indv achieves
true—what an individual actually knows (can never really be known)
error score
error = true - observed
test-retest reliability test — what does it determine, how does it look, what should it yield
used to determine if a test is reliable over time. same test and people at 2 different times. SHOULD yield close to the same score each time, o want high correlation between 2 test scores
parellel forms reliability test — what does it determine, how does it look
determines the equivalence between two different forms of the same test to ensure the same ideas are being tested. one set of questions divided into two equivalent sets that are meant to measure the same concept
internal consistency reliability test — what does it determine
used to asses the consistency of results across items within a test
interrater reliability test — what does it determine
used to determine the degree to which different observes/judges give the same score/value to an observed event. think olympics. when humans observe, there always a chance for error
interrater reliability
number of agreements / number of possible agreements
2 main goals for reliability coefficients
need to be positive/direct
need to be as large as possible, 0 means pure measurement error, 1 means no error at all
reliability coefficient
0.00 to 1.00—that quantifies the consistency, stability, and precision of a test or measurement instrument
relibailty coefficient formula
Var(true score) / Var (observed score)
content validity
determines if a samplr of items truly reflects an entire universe of items in a certain topic, like achievement tests
criterion validity
determine if a test score is systematically related to other variables/criteria that indicate the test taker understands material
concurrent validity
is the measure similar to an existing measure? correlate the score for the test with some other measure that is already valid and asses the same abilities
construct validity
determine if a test measures some underlying psychological construct. coreelate the set of test scores with some theorized outcome that reflects the construct for which the test is designed.
think the construct of depression. its not a physical thing we can measure, but rather a construct that we can ask questions that collect info on symptoms and indicators