Applying the IS/ LM model 5a
 Call Kai
 Learn
 Practice Test
 Spaced Repetition
 Match
 Flashcards
 Knowt Play
1/9

There's no tags or description
Looks like no tags are added yet.
10 Terms
What do each the IS and LM curve represent
The IS curve represents equilibrium in the goods market
The LM curve represents equilibrium in the money market
What is the government spending multiplier
change in gov spending / 1 - Mo=oc
What is a decrease tax multiplier
change in tax * mpc / 1 - mpc
What shifts the IS curve
Changes in AD (Changes in demand for goods and services)
What shifts the LM curve to the right
Fall in price
Fall in Money demand
Rise in Money supply
Why does the IS curve slope the way it does
It is almost AD (As the factors affecting IS are changes in AD)
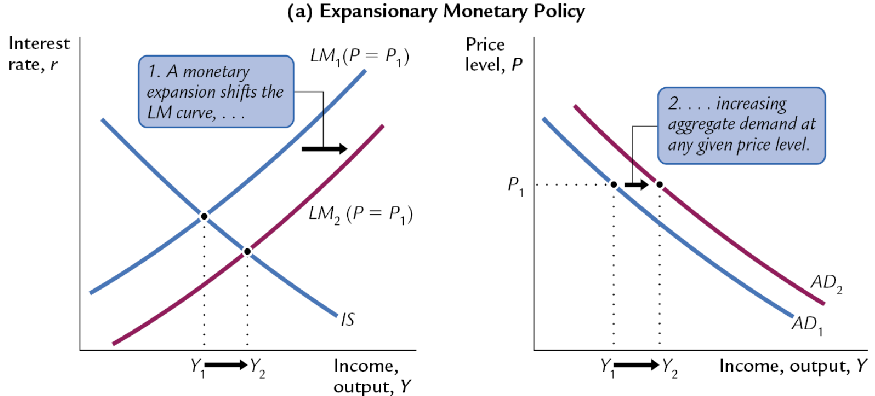
Link AD to IS and LM
Increase in price shifts LM curve inwards - decreases output so price rising will cause output to fall and vice versa
A change in any factor of AD shifts IS so will also shift AD
Explain the extreme assumption that all prices are fixed at a pre-determined level
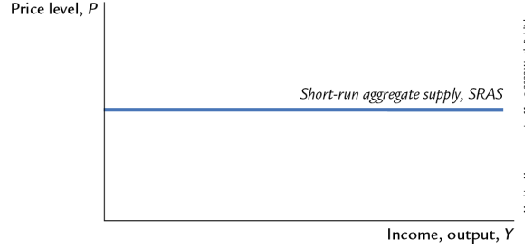
If price is fixed firms will attempt to sell to as much as possible
So with this theory (Bullshite one) SRAS will be horizontal
In this theory changes in AD shift output however there is no change to prices as prices are sticky
What about in the long run
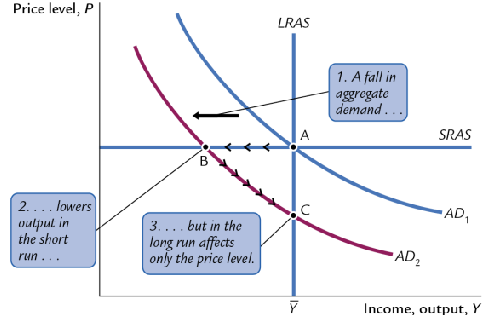
In the long run according to this theory output is determined by AS and so changes to AD only change price
Draw a diagram according to this theory showing the effect of AD falling in the short and long run