(L13, L14) IMED2003 - Statistical Testing I and II

0.0(0)
Studied by 0 people
call kaiCall Kai
learnLearn
examPractice Test
spaced repetitionSpaced Repetition
heart puzzleMatch
flashcardsFlashcards
GameKnowt Play
Card Sorting

1/84

encourage image

There's no tags or description

Looks like no tags are added yet.

85 Terms

1
New cards

What are the three learning outcomes for Statistical Testing I?

1. Describe the types of variables and samples in research, including independent, related, categorical and continuous.

2. Describe, apply and interpret key hypothesis tests including:

- Independent t test

- Paired t test

- Mann-Whitney U

- Wilcoxon signed-rank

- Chi-square

- Fisher's exact

3. Understand the Bonferroni approach to multiple significance testing.

Lecturer emphasis:

The lecturer said the goal is not heavy calculation; the important skill is choosing and interpreting the appropriate statistical test.

2
New cards

What are the four broad steps in hypothesis testing?

1. Formulate hypothesis/null-hypothesis statements using PICO/PECO elements.

2. Collect data from samples and calculate sample statistics such as the sample mean and SEM.

3. Approximate where the true population mean lies using confidence intervals for continuous data, compare samples, or compare variables.

4. Make a conclusion about the null hypothesis, usually guided by the p-value:

- p ≤ 0.05 → reject H0

- p > 0.05 → fail to reject H0

3
New cards

Why is 'fail to reject the null hypothesis' different from 'accept the null hypothesis'?

Failing to reject H0 means the study has not found sufficient evidence to reject it.

.

It does NOT prove that there is no difference.

Lecturer explanation:

The lecturer stressed that "accepting" H0 would be a stronger, more conclusive statement than the evidence supports.

4
New cards

What is the role of p-values in probability testing?

Statistical tests can assess:

- Whether group means are similar or different at a specified probability level

- How tightly variables are associated

.

These tests generate p-values.

In medical sciences, p = 0.05 is commonly used as the significance threshold.

5
New cards

Why should p = 0.05 not be treated as a rigid black-and-white boundary?

Values immediately either side of 0.05 can be very similar in practical terms.

Lecturer example:

- p = 0.049 and p = 0.051 are numerically very close even though one meets the conventional threshold and the other does not.

.

Lecturer emphasis:

Interpret the data rather than simply searching for which side of 0.05 the p-value falls on.

6
New cards

What is the main skill required when there are many possible statistical tests?

You do NOT need to learn every statistical test.

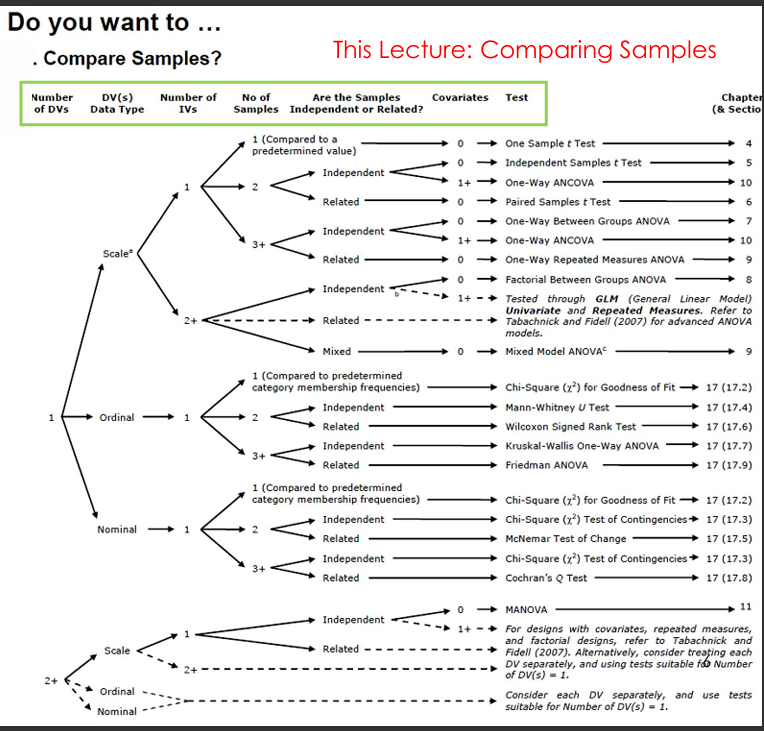
You do need to know what questions to ask to decide which test is suitable for the samples and variables being compared.

A statistical decision flow chart can be used to guide test selection.
7
New cards
<p>What information must be identified before choosing a statistical test for comparing samples?</p>

What information must be identified before choosing a statistical test for comparing samples?

Identify:

- Dependent variable(s) (DV)

- Independent variable(s) (IV)

- Number of samples/groups

- Whether samples are independent or related/paired

- Relevant covariates

- Data type

- Whether test assumptions are satisfied

<p>Identify:</p><p>- Dependent variable(s) (DV)</p><p>- Independent variable(s) (IV)</p><p>- Number of samples/groups</p><p>- Whether samples are independent or related/paired</p><p>- Relevant covariates</p><p>- Data type</p><p>- Whether test assumptions are satisfied</p>
8
New cards
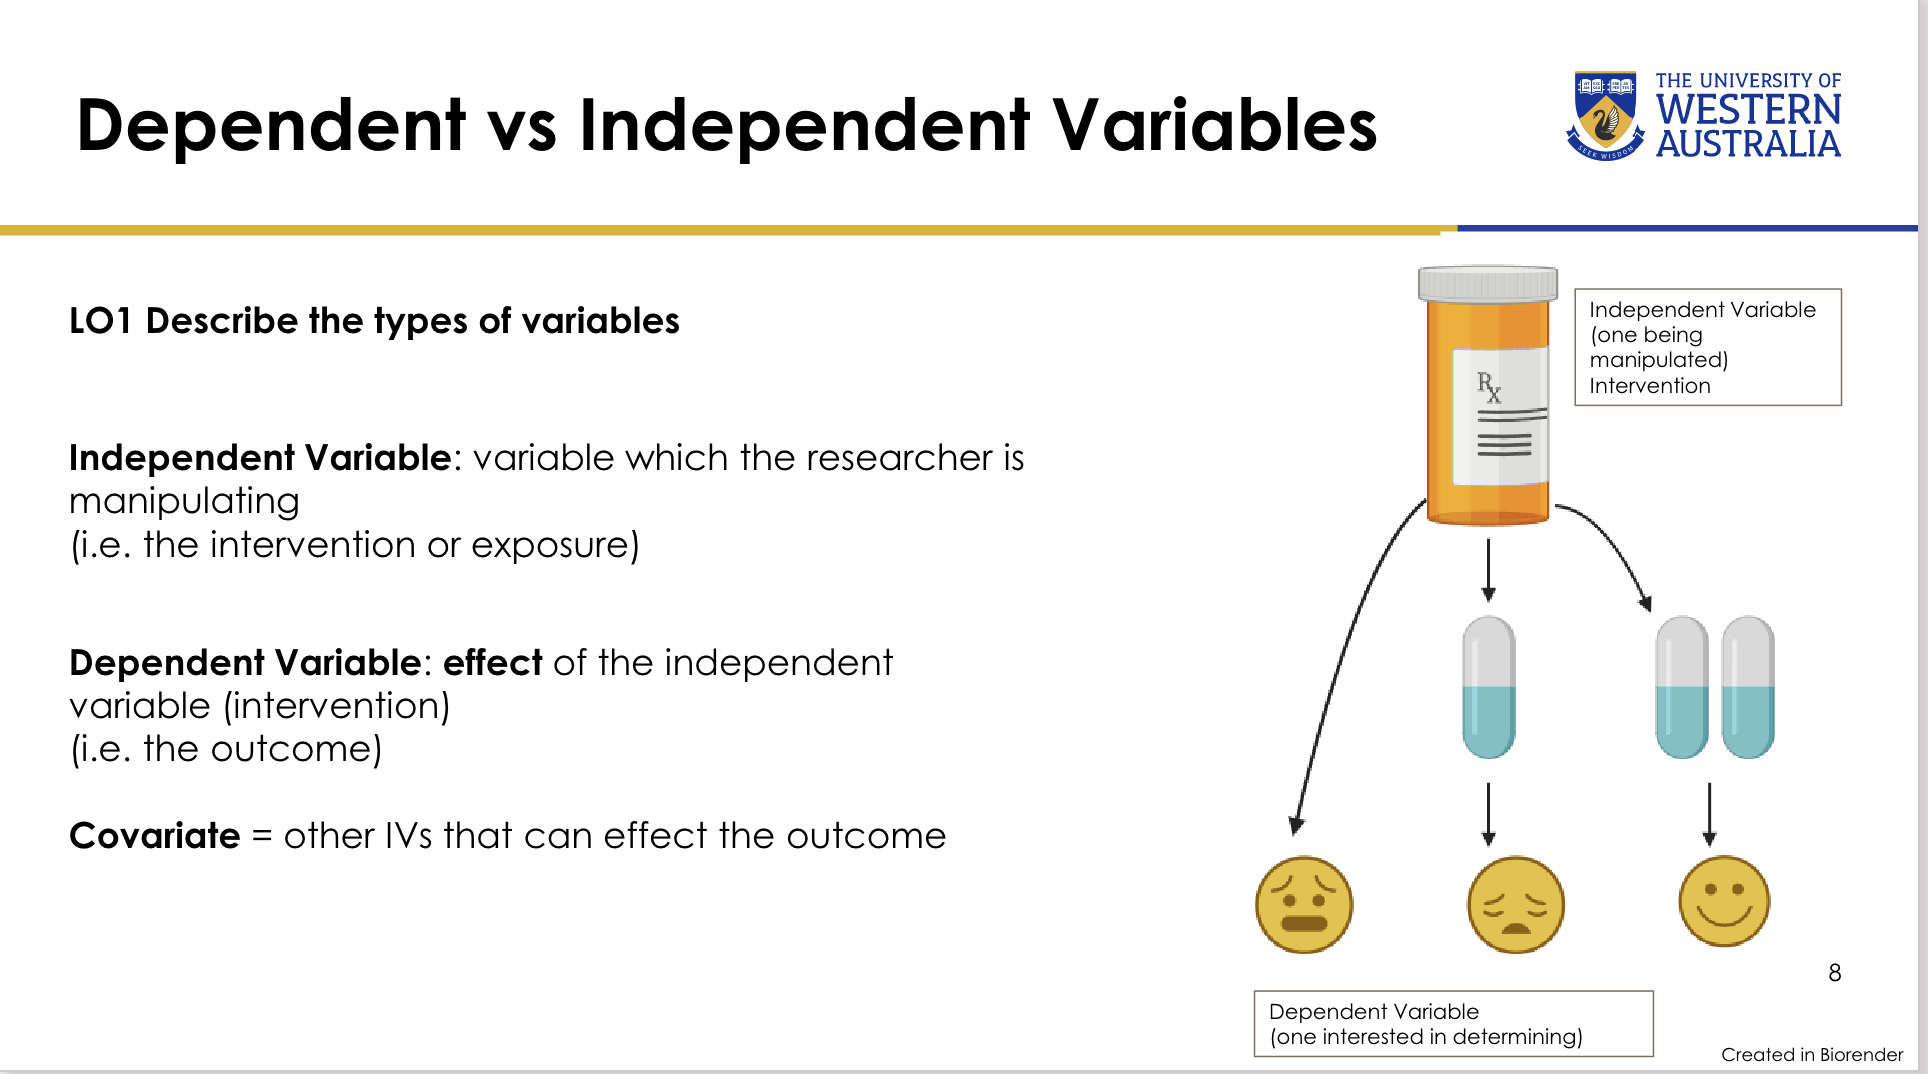
<p>What is a covariate?</p>

What is a covariate?

A covariate is another independent variable that can affect the outcome/dependent variable.

Lecturer examples for mood:

- Sleep

- Weather

- Food

- Physical activity

In study design, researchers try to control important covariates so groups are as comparable as possible at baseline.

<p>A covariate is another independent variable that can affect the outcome/dependent variable.</p><p>Lecturer examples for mood:</p><p>- Sleep</p><p>- Weather</p><p>- Food</p><p>- Physical activity</p><p>In study design, researchers try to control important covariates so groups are as comparable as possible at baseline.</p>
9
New cards
<p>What was the purpose of the statistical-test overview diagrams in Statistical Testing I?</p>

What was the purpose of the statistical-test overview diagrams in Statistical Testing I?

The diagrams show that many different tests exist and that test selection depends on the structure and type of the data.

The lecture specifically focuses on tests for comparing samples; Statistical Testing II focuses on relationships between variables.

<p>The diagrams show that many different tests exist and that test selection depends on the structure and type of the data.</p><p>The lecture specifically focuses on tests for comparing samples; Statistical Testing II focuses on relationships between variables.</p>
10
New cards
<p>What is an independent variable (IV)?</p>

What is an independent variable (IV)?

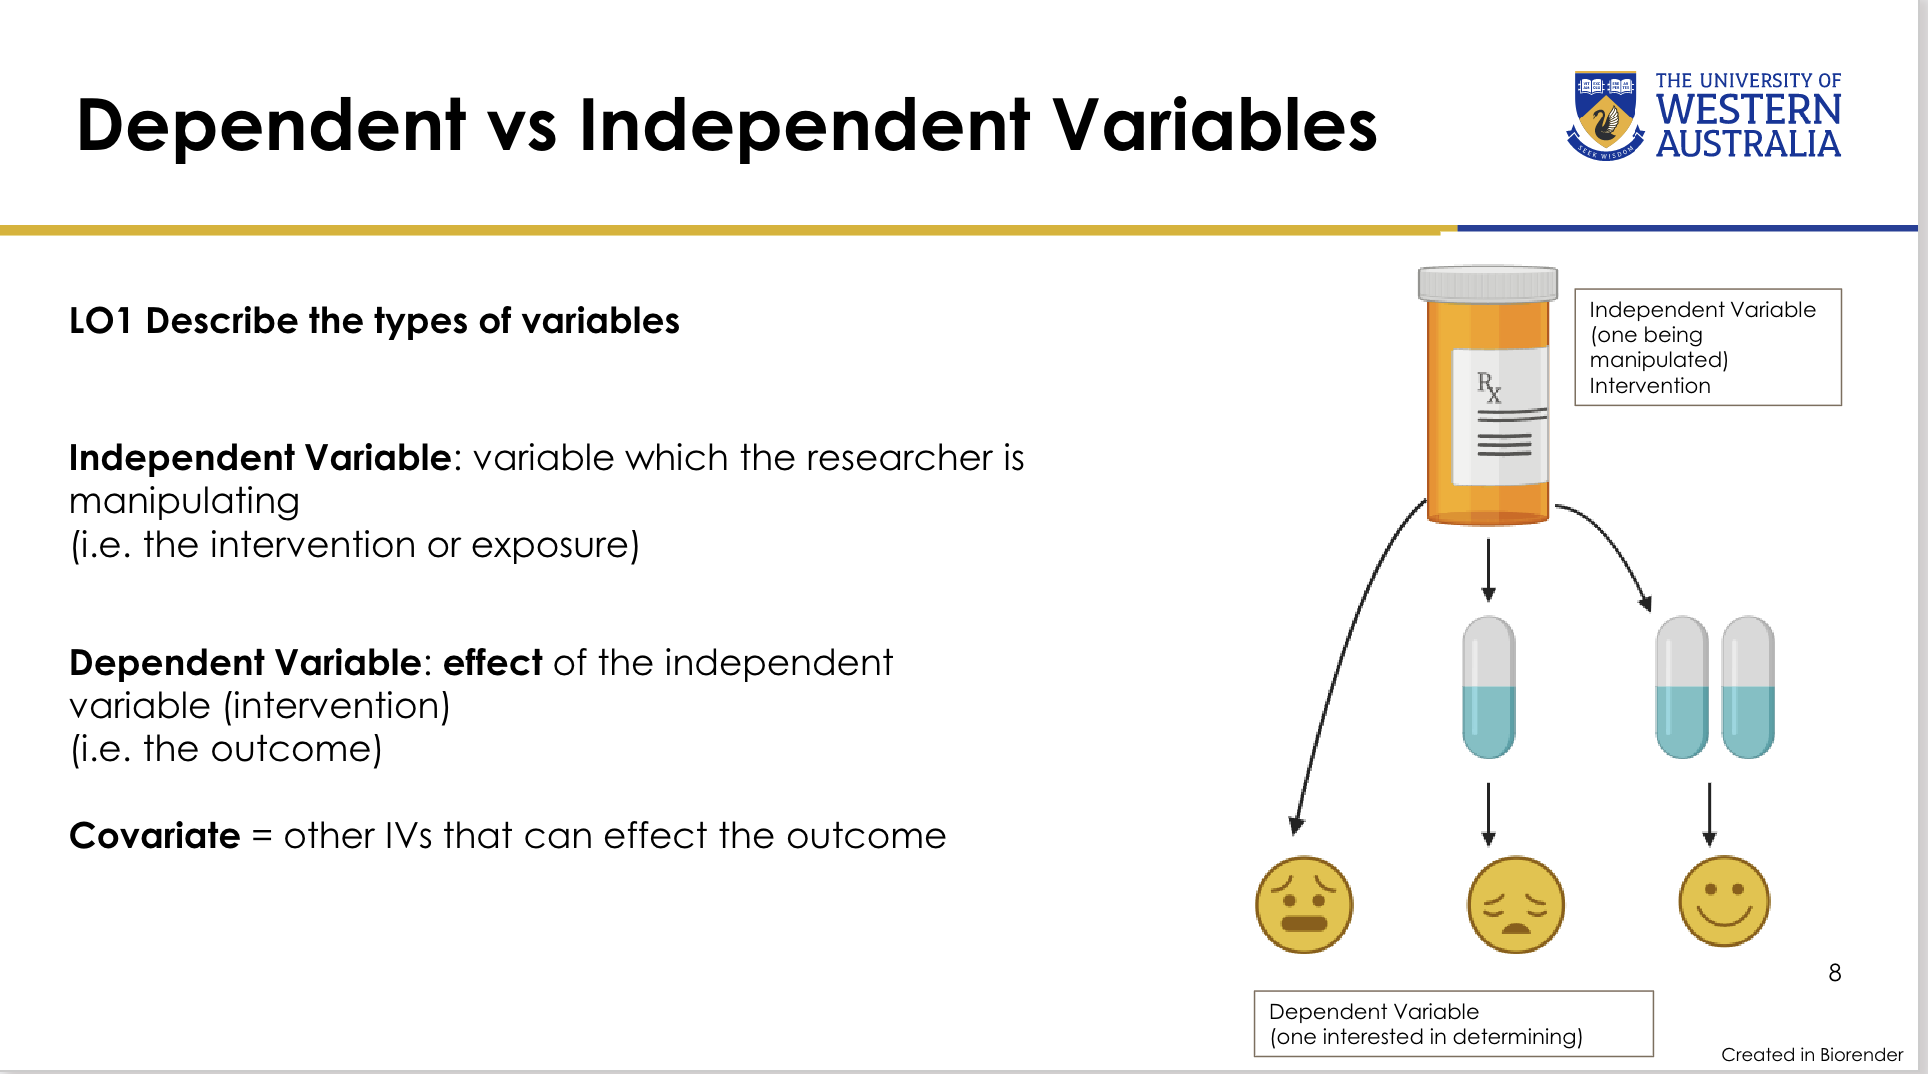
The independent variable is the variable the researcher manipulates or the exposure being investigated.

In PICO terms, it commonly corresponds to the intervention/exposure.

<p>The independent variable is the variable the researcher manipulates or the exposure being investigated.</p><p>In PICO terms, it commonly corresponds to the intervention/exposure.</p>
11
New cards
<p>What is a dependent variable (DV)?</p>

What is a dependent variable (DV)?

The dependent variable is the effect or outcome of the independent variable.

It is the outcome the researcher is interested in determining.
<p>The dependent variable is the effect or outcome of the independent variable.</p><p>It is the outcome the researcher is interested in determining.</p>
12
New cards
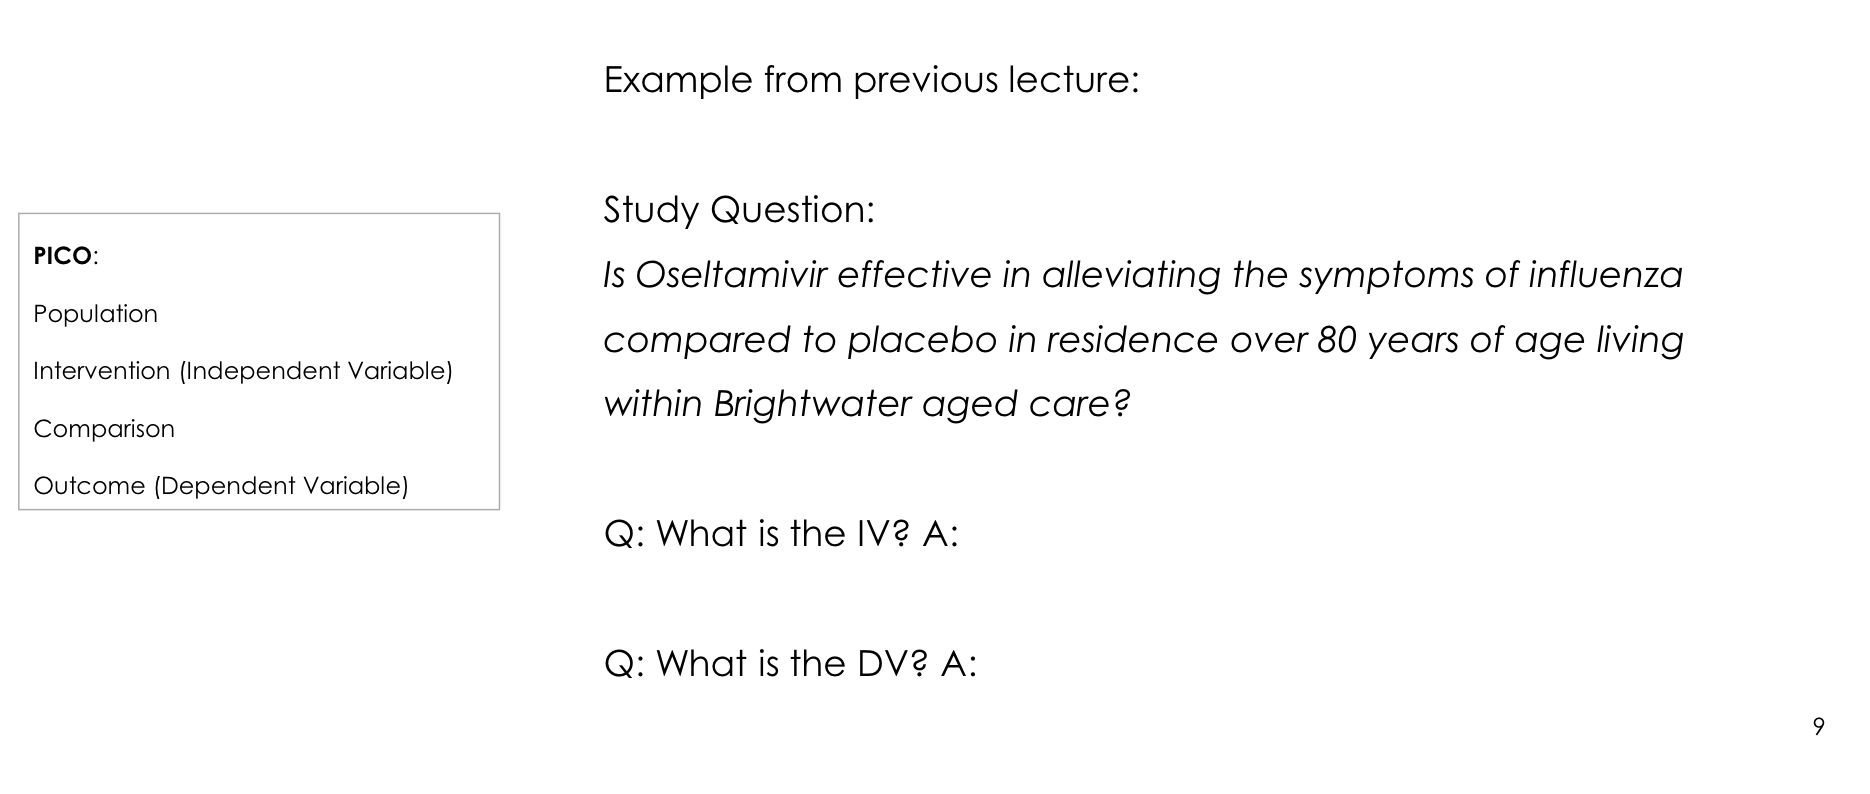
<p>How can PICO be used to identify the independent and dependent variables?</p>

How can PICO be used to identify the independent and dependent variables?

PICO:

- Population

- Intervention = Independent Variable

- Comparison

- Outcome = Dependent Variable

<p>PICO:</p><p>- Population</p><p>- Intervention = Independent Variable</p><p>- Comparison</p><p>- Outcome = Dependent Variable</p>
13
New cards
<p>In the oseltamivir study question, what are the IV and DV?</p>

In the oseltamivir study question, what are the IV and DV?

Study question:

Is oseltamivir effective in alleviating symptoms of influenza compared with placebo in residents over 80 years of age living within Brightwater aged care?

.

IV:

- Oseltamivir treatment / intervention

.

DV:

- Alleviation of influenza symptoms

- Lecturer clarification: effectively the time to alleviation of symptoms

<p>Study question:</p><p>Is oseltamivir effective in alleviating symptoms of influenza compared with placebo in residents over 80 years of age living within Brightwater aged care?</p><p>.</p><p>IV:</p><p>- Oseltamivir treatment / intervention</p><p>.</p><p>DV:</p><p>- Alleviation of influenza symptoms</p><p>- Lecturer clarification: effectively the time to alleviation of symptoms</p>
14
New cards
<p>What makes two samples related/paired rather than independent?</p>

What makes two samples related/paired rather than independent?

Related/paired samples:

- Values in one sample influence or correspond to values in the other sample.

.

Independent samples:

- Values in one sample do not influence the values in the other sample.

.

Lecturer emphasis:

"Related" does not necessarily mean biologically related; it means there is a dependency or matching relationship between observations.

<p>Related/paired samples:</p><p>- Values in one sample influence or correspond to values in the other sample.</p><p>.</p><p>Independent samples:</p><p>- Values in one sample do not influence the values in the other sample.</p><p>.</p><p>Lecturer emphasis:</p><p>"Related" does not necessarily mean biologically related; it means there is a dependency or matching relationship between observations.</p>
15
New cards
<p>How does the premature-toddler milk-formula example illustrate related versus independent samples?</p>

How does the premature-toddler milk-formula example illustrate related versus independent samples?

Sample A:

- Premature toddlers receiving a new milk formula; weight tracked over time.

.

Sample B:

- Control group includes siblings of Sample A → related/paired because the groups share a relationship.

.

Sample C:

- Control group consists of toddlers who are not siblings/relatives → independent.

<p>Sample A:</p><p>- Premature toddlers receiving a new milk formula; weight tracked over time.</p><p>.</p><p>Sample B:</p><p>- Control group includes siblings of Sample A → related/paired because the groups share a relationship.</p><p>.</p><p>Sample C:</p><p>- Control group consists of toddlers who are not siblings/relatives → independent.</p>
16
New cards

What are the major data types used when choosing a statistical test?

CATEGORICAL:

- Ordinal: ordered categories, e.g. Likert scale

- Nominal: unordered categories, e.g. gender, yes/no, language

.

CONTINUOUS / SCALE:

- Can take any value within an interval

- Ratio: e.g. height, weight

- Interval: no true zero or real upper/lower limits, e.g. temperature, blood pressure

17
New cards
<p>How is the meditation-and-blood-pressure study classified for statistical-test selection?</p>

How is the meditation-and-blood-pressure study classified for statistical-test selection?

Study question:

What is the effect of meditation on blood pressure in patients with coronary artery disease compared with 6 months prior to commencement of treatment?

- IV: meditation

- DV: blood pressure

- DV data type: scale/continuous

- Number of groups/columns: 2 (before and after meditation)

- Samples: related/paired because the same people are measured twice

- Potential covariates: prior meditation experience, medications affecting blood pressure, stress, exercise, etc.

<p>Study question:</p><p>What is the effect of meditation on blood pressure in patients with coronary artery disease compared with 6 months prior to commencement of treatment?</p><p>- IV: meditation</p><p>- DV: blood pressure</p><p>- DV data type: scale/continuous</p><p>- Number of groups/columns: 2 (before and after meditation)</p><p>- Samples: related/paired because the same people are measured twice</p><p>- Potential covariates: prior meditation experience, medications affecting blood pressure, stress, exercise, etc.</p>
18
New cards
<p>Which statistical test does the meditation-and-blood-pressure example lead toward?</p>

Which statistical test does the meditation-and-blood-pressure example lead toward?

Paired-samples t test, assuming the paired continuous data satisfy the parametric assumptions.

Lecturer explanation:

The same people are measured before and after, so the observations are related rather than independent.

<p>Paired-samples t test, assuming the paired continuous data satisfy the parametric assumptions.</p><p>Lecturer explanation:</p><p>The same people are measured before and after, so the observations are related rather than independent.</p>
19
New cards
<p>How can you determine whether data are suitable for a parametric test?</p>

How can you determine whether data are suitable for a parametric test?

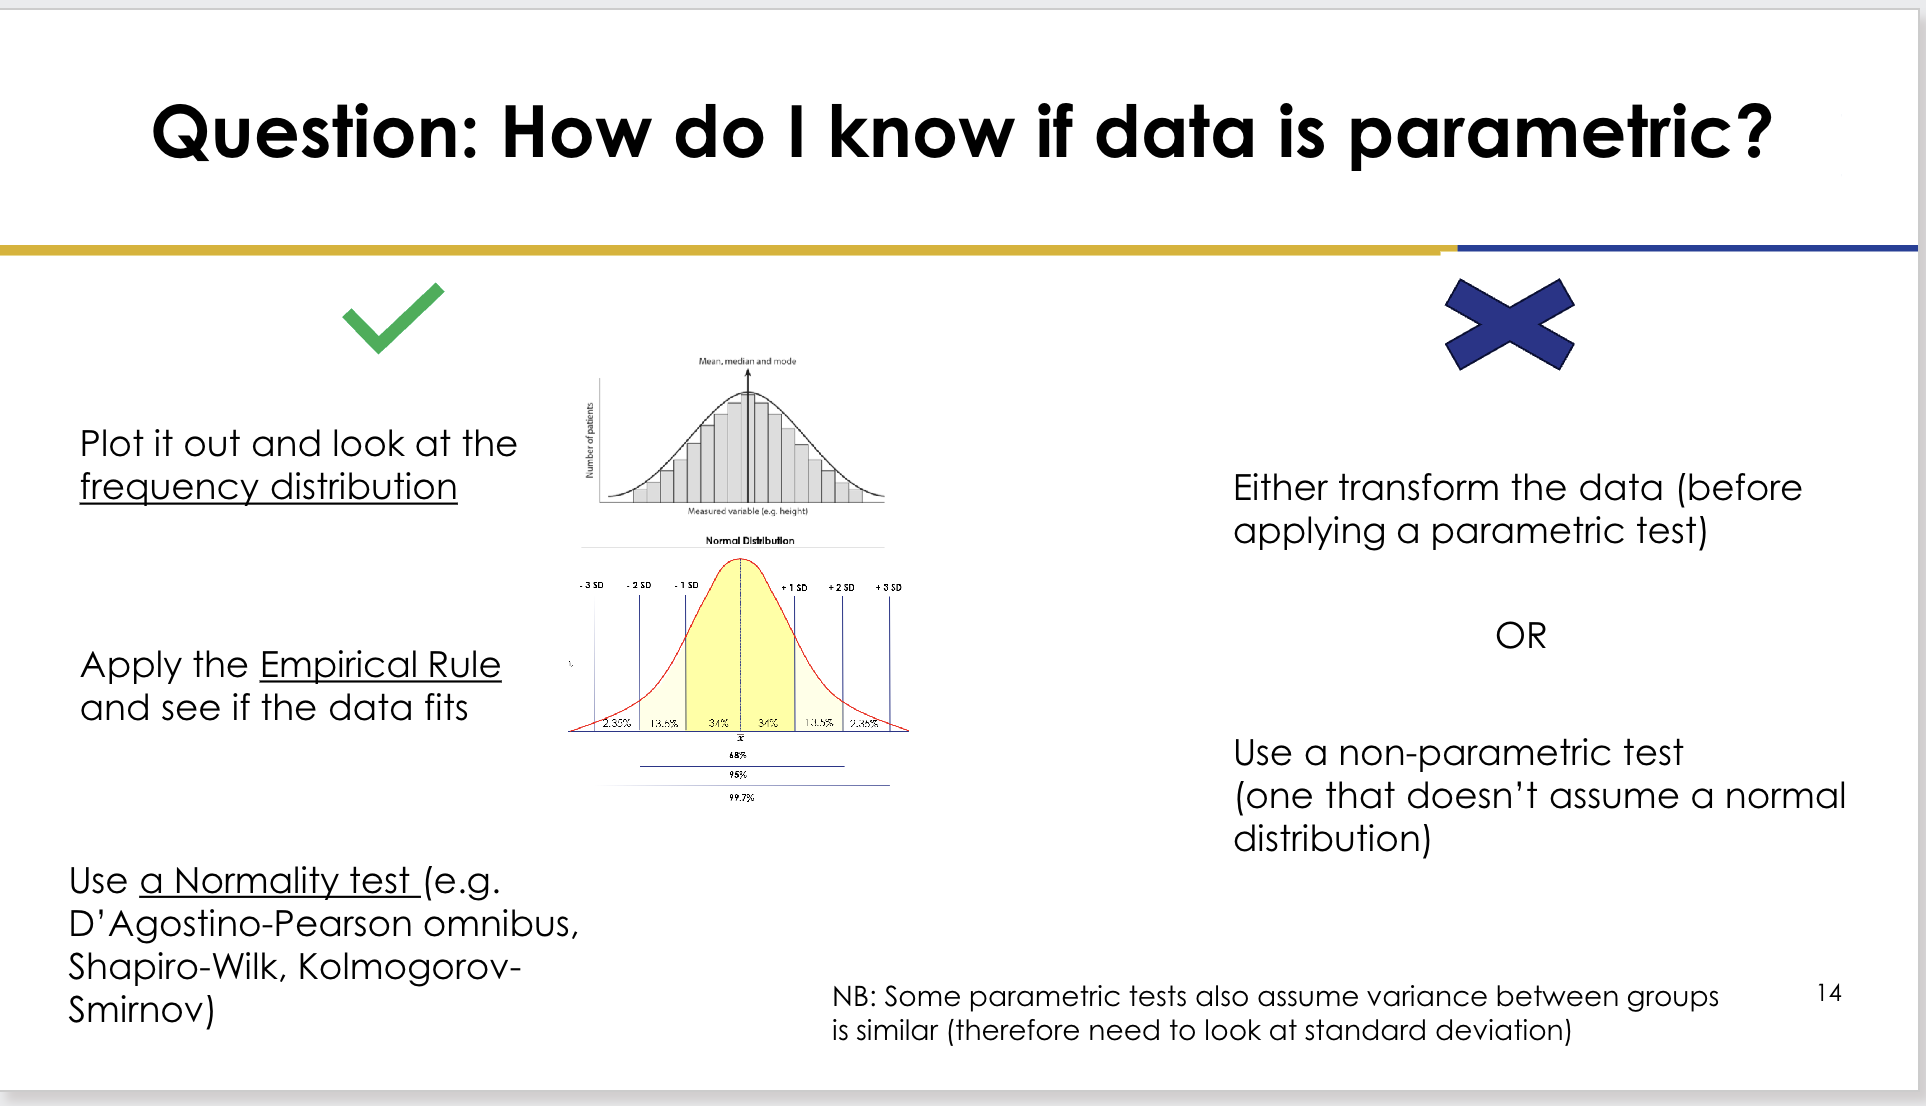
Possible approaches:

- Plot the data and inspect the frequency distribution.

- Apply the empirical rule and see whether the distribution fits.

.

- Use a normality test, such as:

- D'Agostino-Pearson omnibus

- Shapiro-Wilk

- Kolmogorov-Smirnov

.

Lecturer explanation:

In this lecture, "parametric" was treated primarily as meaning approximately normally distributed.
<p>Possible approaches:</p><p>- Plot the data and inspect the frequency distribution.</p><p>- Apply the empirical rule and see whether the distribution fits.</p><p>.</p><p>- Use a normality test, such as:</p><p>- D'Agostino-Pearson omnibus</p><p>- Shapiro-Wilk</p><p>- Kolmogorov-Smirnov</p><p>.</p><p>Lecturer explanation:</p><p>In this lecture, "parametric" was treated primarily as meaning approximately normally distributed.</p>
20
New cards
<p>What can you do if the data do not satisfy parametric assumptions?</p>

What can you do if the data do not satisfy parametric assumptions?

Two broad options:

1. Transform the data before applying a parametric test.

2. Use a non-parametric test that does not assume a normal distribution.

Also note:

- Some parametric tests assume similar variance between groups, so standard deviations may need to be considered.

<p>Two broad options:</p><p>1. Transform the data before applying a parametric test.</p><p>2. Use a non-parametric test that does not assume a normal distribution.</p><p>Also note:</p><p>- Some parametric tests assume similar variance between groups, so standard deviations may need to be considered.</p>
21
New cards
<p>Which hypothesis tests must be known for Statistical Testing I?</p>

Which hypothesis tests must be known for Statistical Testing I?

- Independent t test

- Paired t test

- Mann-Whitney U

- Wilcoxon signed-rank

- Chi-square

- Fisher's exact
<p>- Independent t test</p><p>- Paired t test</p><p>- Mann-Whitney U</p><p>- Wilcoxon signed-rank</p><p>- Chi-square</p><p>- Fisher's exact</p>
22
New cards
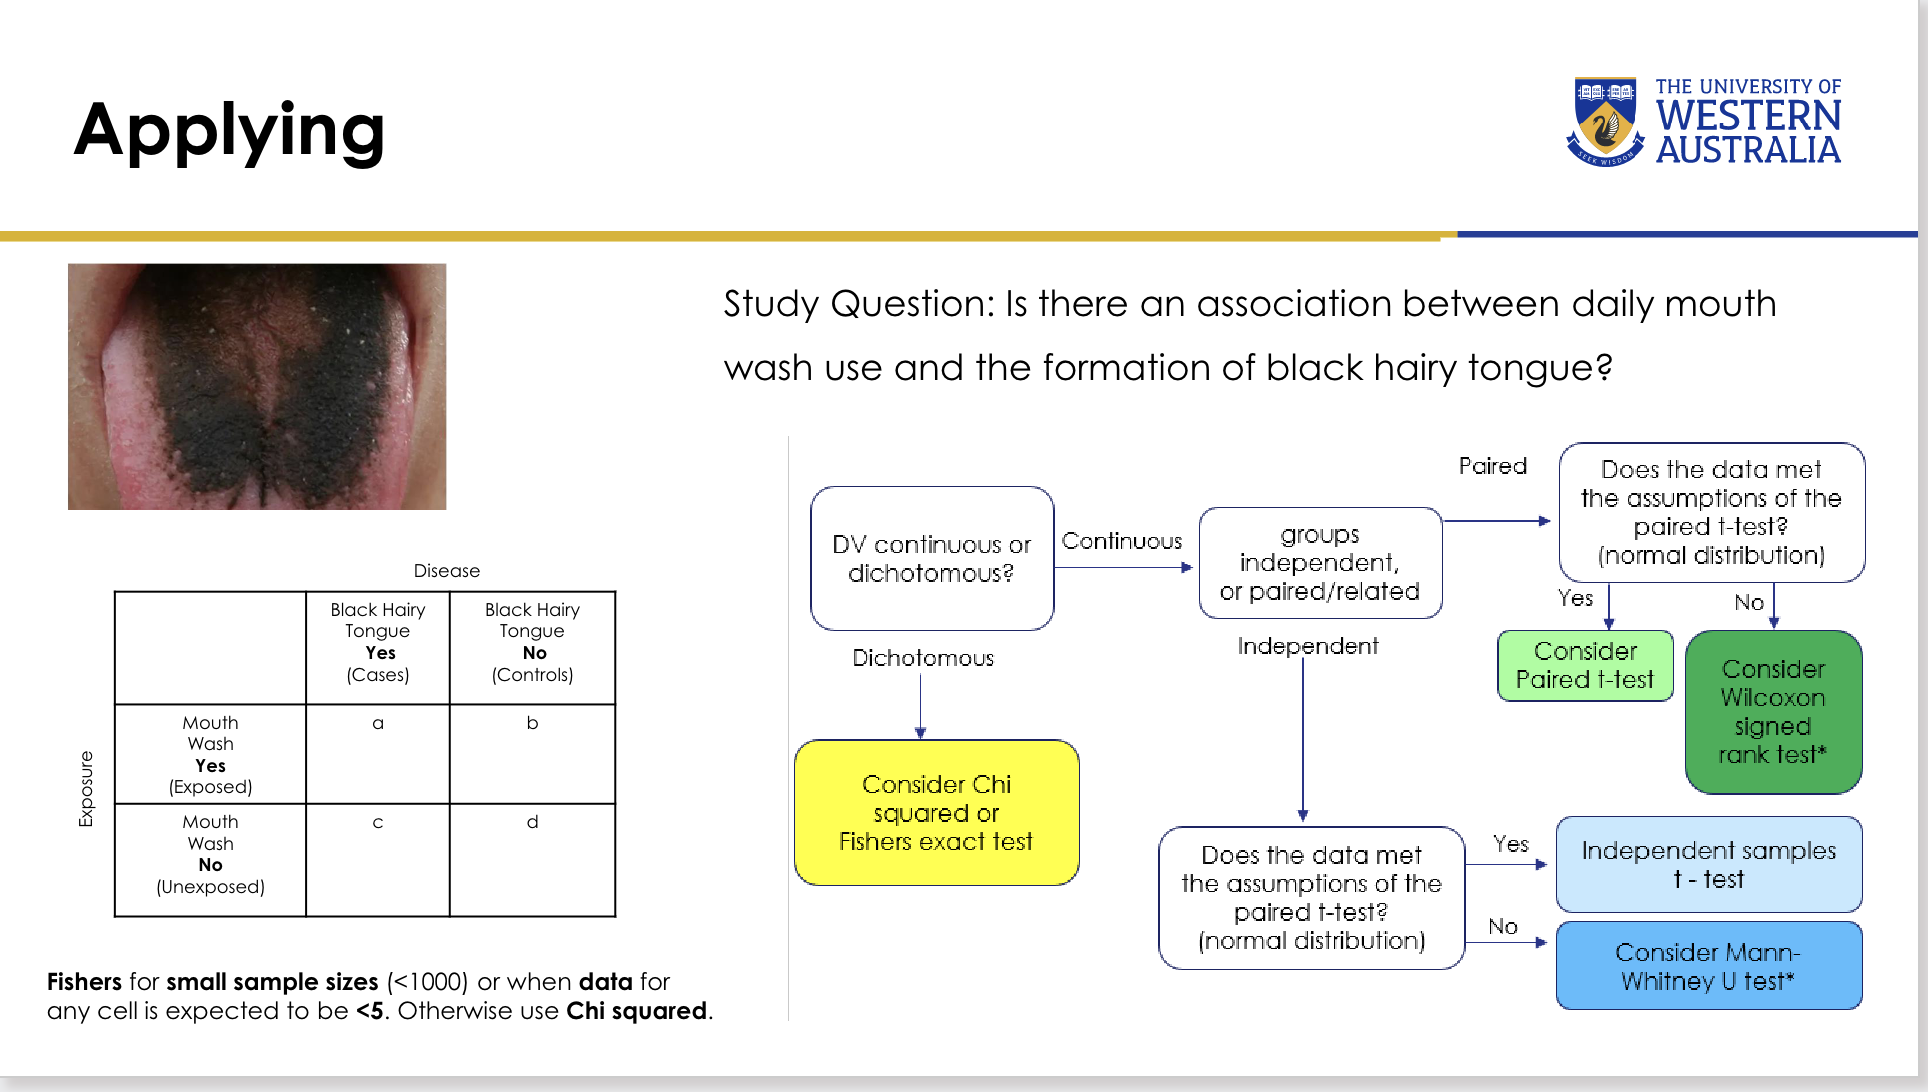
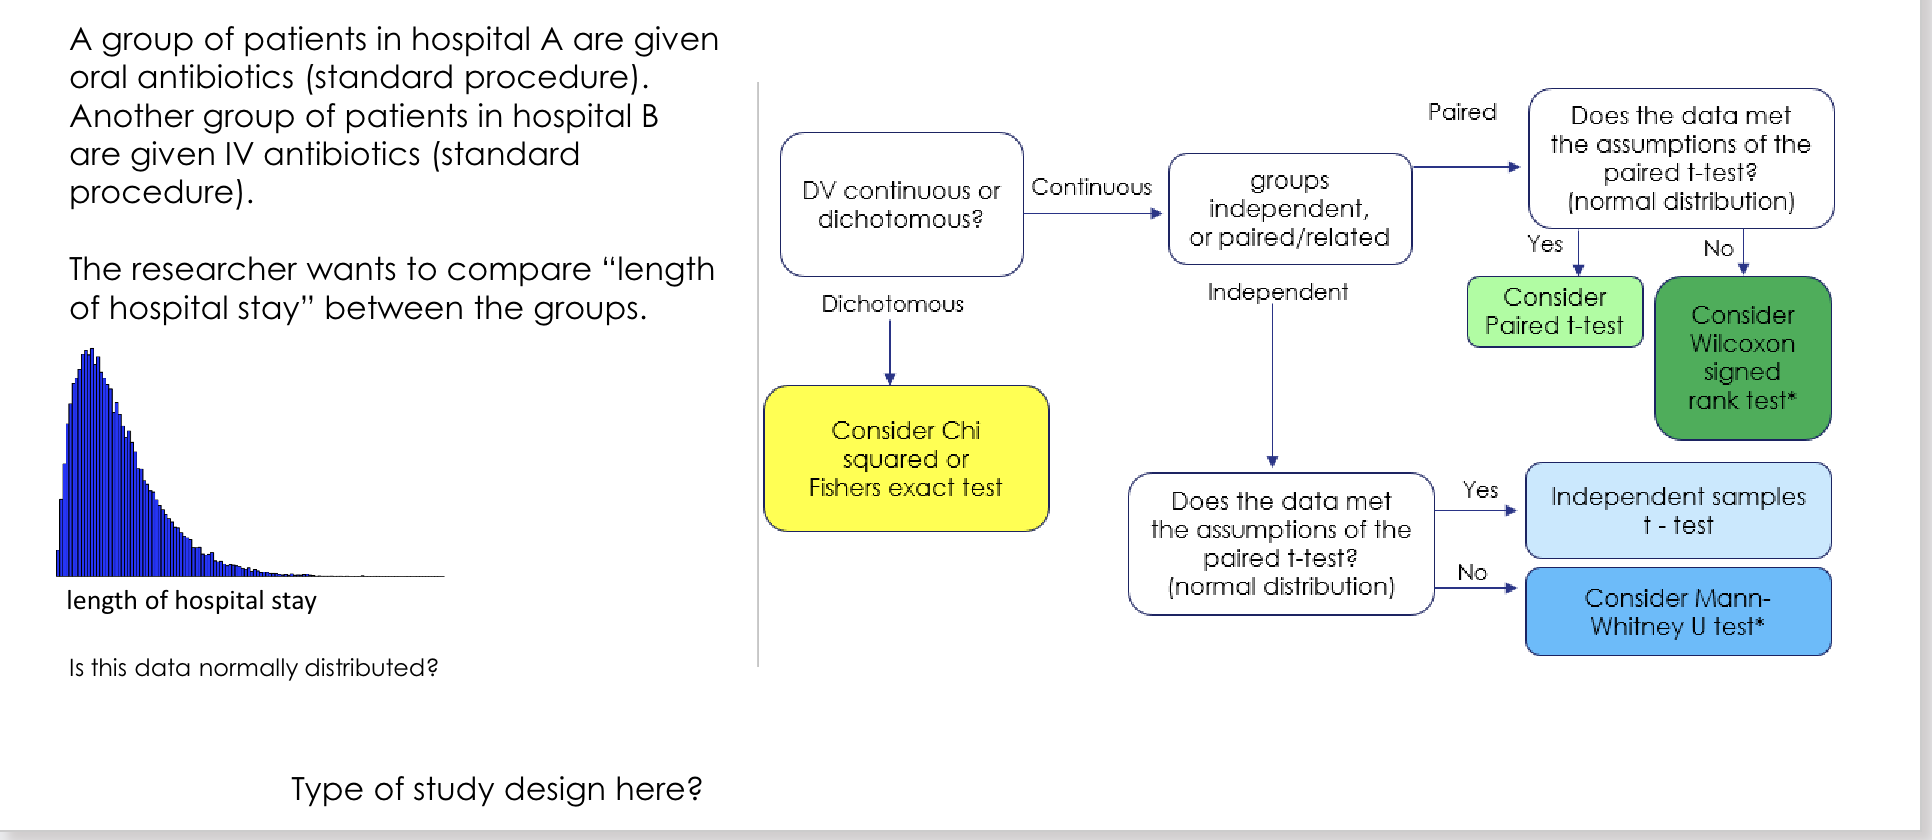
<p>What is the basic algorithm for choosing a test when comparing two groups with one primary outcome?</p>

What is the basic algorithm for choosing a test when comparing two groups with one primary outcome?

1. Is the DV continuous or dichotomous?

If dichotomous:

→ consider Chi-square or Fisher's exact.

If continuous:

2. Are the groups paired/related or independent?

Paired:

- Assumptions met / approximately normal → paired t test

- Assumptions not met / non-normal → Wilcoxon signed-rank

Independent:

- Assumptions met / approximately normal → independent-samples t test

- Assumptions not met / non-normal → Mann-Whitney U

<p>1. Is the DV continuous or dichotomous?</p><p>If dichotomous:</p><p>→ consider Chi-square or Fisher's exact.</p><p>If continuous:</p><p>2. Are the groups paired/related or independent?</p><p>Paired:</p><p>- Assumptions met / approximately normal → paired t test</p><p>- Assumptions not met / non-normal → Wilcoxon signed-rank</p><p>Independent:</p><p>- Assumptions met / approximately normal → independent-samples t test</p><p>- Assumptions not met / non-normal → Mann-Whitney U</p>
23
New cards
<p>When should each of the four main continuous-data two-group tests be considered?</p>

When should each of the four main continuous-data two-group tests be considered?

Paired t test:

- Continuous

- Paired/related

- Parametric / approximately normal

.

Wilcoxon signed-rank:

- Paired/related

- Non-parametric

- Can also be used for ordinal outcomes

.

Independent-samples t test:

- Continuous

- Independent

- Parametric / approximately normal

.

Mann-Whitney U:

- Independent

- Non-parametric

<p>Paired t test:</p><p>- Continuous</p><p>- Paired/related</p><p>- Parametric / approximately normal</p><p>.</p><p>Wilcoxon signed-rank:</p><p>- Paired/related</p><p>- Non-parametric</p><p>- Can also be used for ordinal outcomes</p><p>.</p><p>Independent-samples t test:</p><p>- Continuous</p><p>- Independent</p><p>- Parametric / approximately normal</p><p>.</p><p>Mann-Whitney U:</p><p>- Independent</p><p>- Non-parametric</p>
24
New cards
<p>For the mouthwash and black hairy tongue study, which test should be used and why?</p>

For the mouthwash and black hairy tongue study, which test should be used and why?

Study question:

Is there an association between daily mouthwash use and formation of black hairy tongue?

The variables are dichotomous:

- Black hairy tongue: yes/no

- Mouthwash exposure: yes/no

.

Use:

- Fisher's exact for small sample sizes (<1000) OR if any expected cell count is <5.

- Otherwise use Chi-square.

<p>Study question:</p><p>Is there an association between daily mouthwash use and formation of black hairy tongue?</p><p>The variables are dichotomous:</p><p>- Black hairy tongue: yes/no</p><p>- Mouthwash exposure: yes/no</p><p>.</p><p>Use:</p><p>- Fisher's exact for small sample sizes (&lt;1000) OR if any expected cell count is &lt;5.</p><p>- Otherwise use Chi-square.</p>
25
New cards
<p>Which test is appropriate for the SSRI-and-blood-pressure example?</p>

Which test is appropriate for the SSRI-and-blood-pressure example?

Study:

Effect of SSRI treatment on blood pressure in CAD patients compared with 3 months prior to treatment.

.

Classification:

- DV: blood pressure, continuous

- Same patients before/after → paired

- Distribution shown as normal

.

Appropriate test:

- Paired t test

<p>Study:</p><p>Effect of SSRI treatment on blood pressure in CAD patients compared with 3 months prior to treatment.</p><p>.</p><p>Classification:</p><p>- DV: blood pressure, continuous</p><p>- Same patients before/after → paired</p><p>- Distribution shown as normal</p><p>.</p><p>Appropriate test:</p><p>- Paired t test</p>
26
New cards
<p>Which test is appropriate for comparing hospital length of stay between oral- and IV-antibiotic groups?</p>

Which test is appropriate for comparing hospital length of stay between oral- and IV-antibiotic groups?

Scenario:

- Hospital A uses oral antibiotics.

- Hospital B uses IV antibiotics.

- Outcome: length of hospital stay.

.

Classification:

- DV: continuous

- Groups: independent

- Distribution: skewed / non-normal

.

Appropriate test:

- Mann-Whitney U

<p>Scenario:</p><p>- Hospital A uses oral antibiotics.</p><p>- Hospital B uses IV antibiotics.</p><p>- Outcome: length of hospital stay.</p><p>.</p><p>Classification:</p><p>- DV: continuous</p><p>- Groups: independent</p><p>- Distribution: skewed / non-normal</p><p>.</p><p>Appropriate test:</p><p>- Mann-Whitney U</p>
27
New cards
<p>What study design is used in the hospital oral-versus-IV antibiotics example?</p>

What study design is used in the hospital oral-versus-IV antibiotics example?

Cohort study.

Lecturer explanation:

The researcher did not assign treatment; the hospitals were already using their standard procedures.

The information given is insufficient to determine whether the cohort is prospective or retrospective.

<p>Cohort study.</p><p>Lecturer explanation:</p><p>The researcher did not assign treatment; the hospitals were already using their standard procedures.</p><p>The information given is insufficient to determine whether the cohort is prospective or retrospective.</p>
28
New cards
<p>Which test is appropriate for cortisol levels measured before and after meditation?</p>

Which test is appropriate for cortisol levels measured before and after meditation?

Scenario:

- Same students tested immediately before and after meditation.

- Outcome: cortisol concentration (nmol/L)

- Data are continuous.

- Observations are paired.

- Distribution shown is skewed/non-normal.

.

Appropriate test:

- Wilcoxon signed-rank

<p>Scenario:</p><p>- Same students tested immediately before and after meditation.</p><p>- Outcome: cortisol concentration (nmol/L)</p><p>- Data are continuous.</p><p>- Observations are paired.</p><p>- Distribution shown is skewed/non-normal.</p><p>.</p><p>Appropriate test:</p><p>- Wilcoxon signed-rank</p>
29
New cards
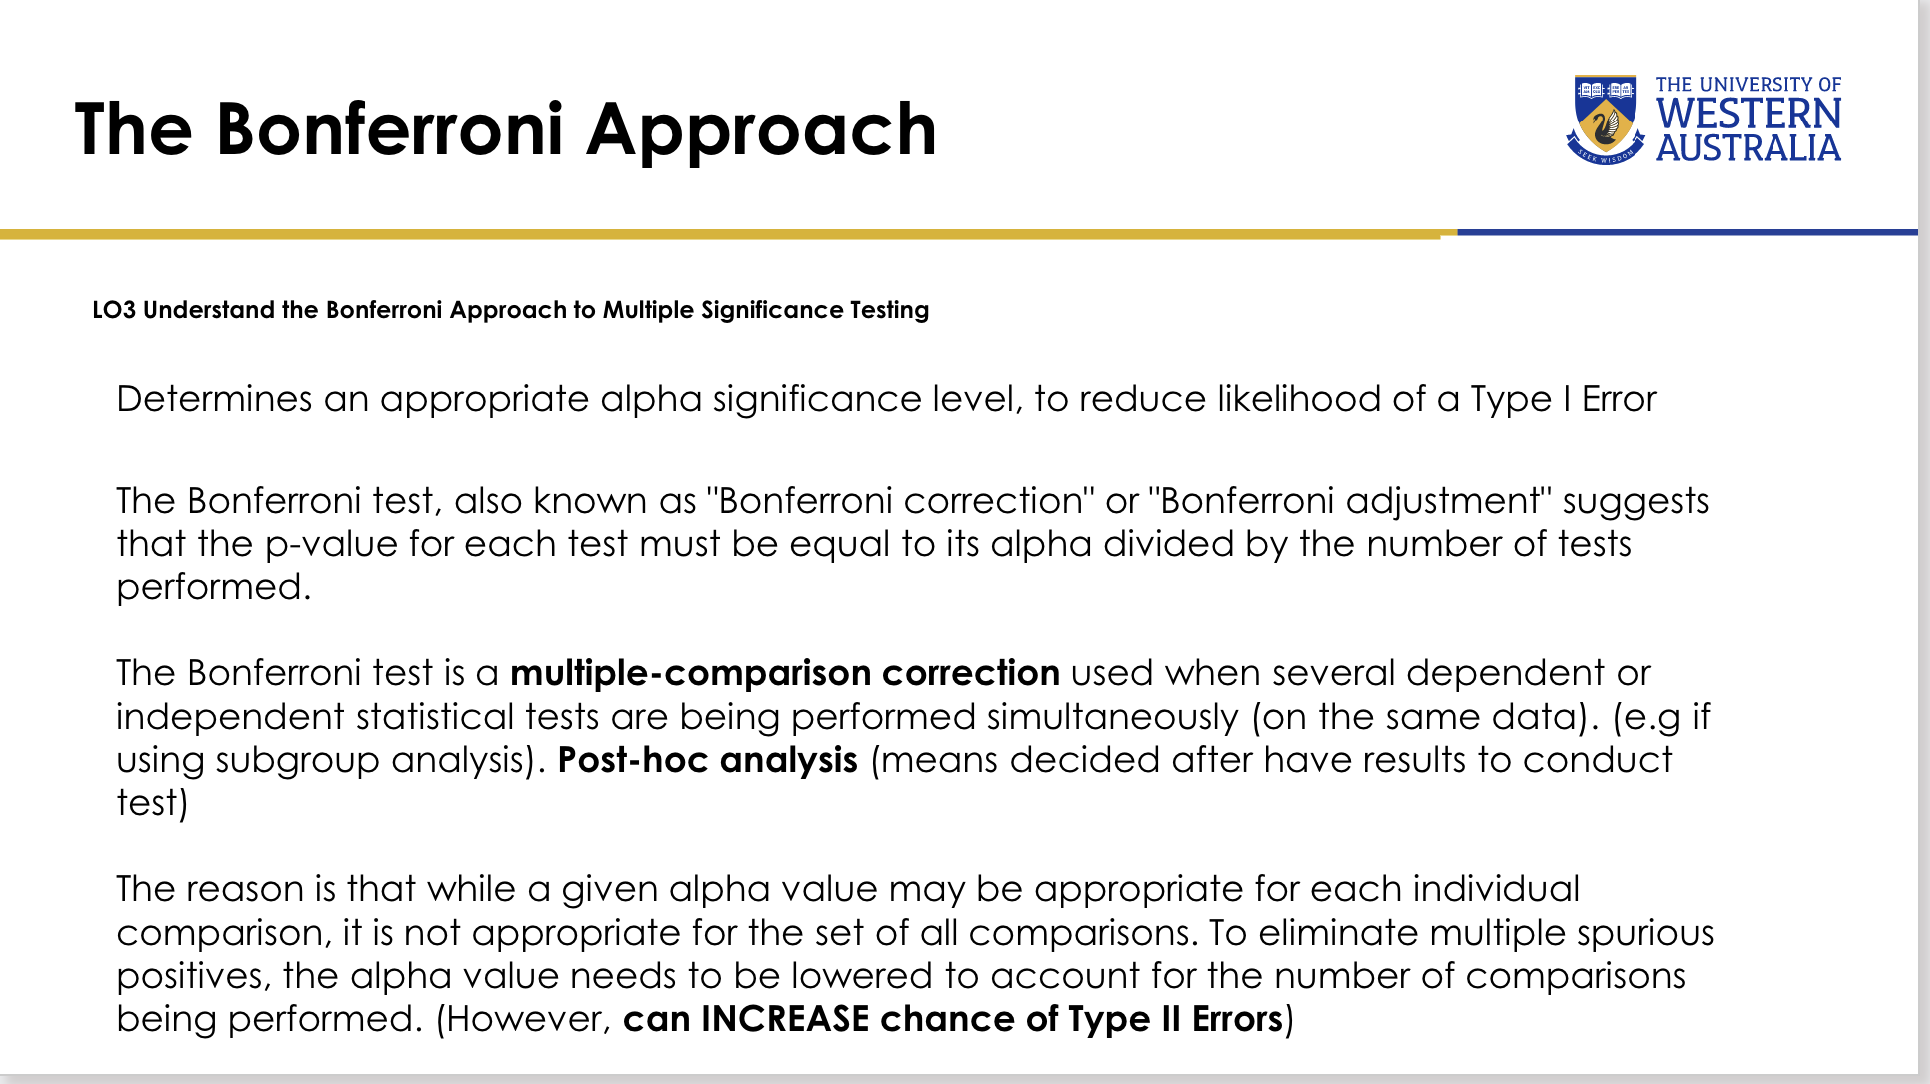
<p>What is the Bonferroni correction?</p>

What is the Bonferroni correction?

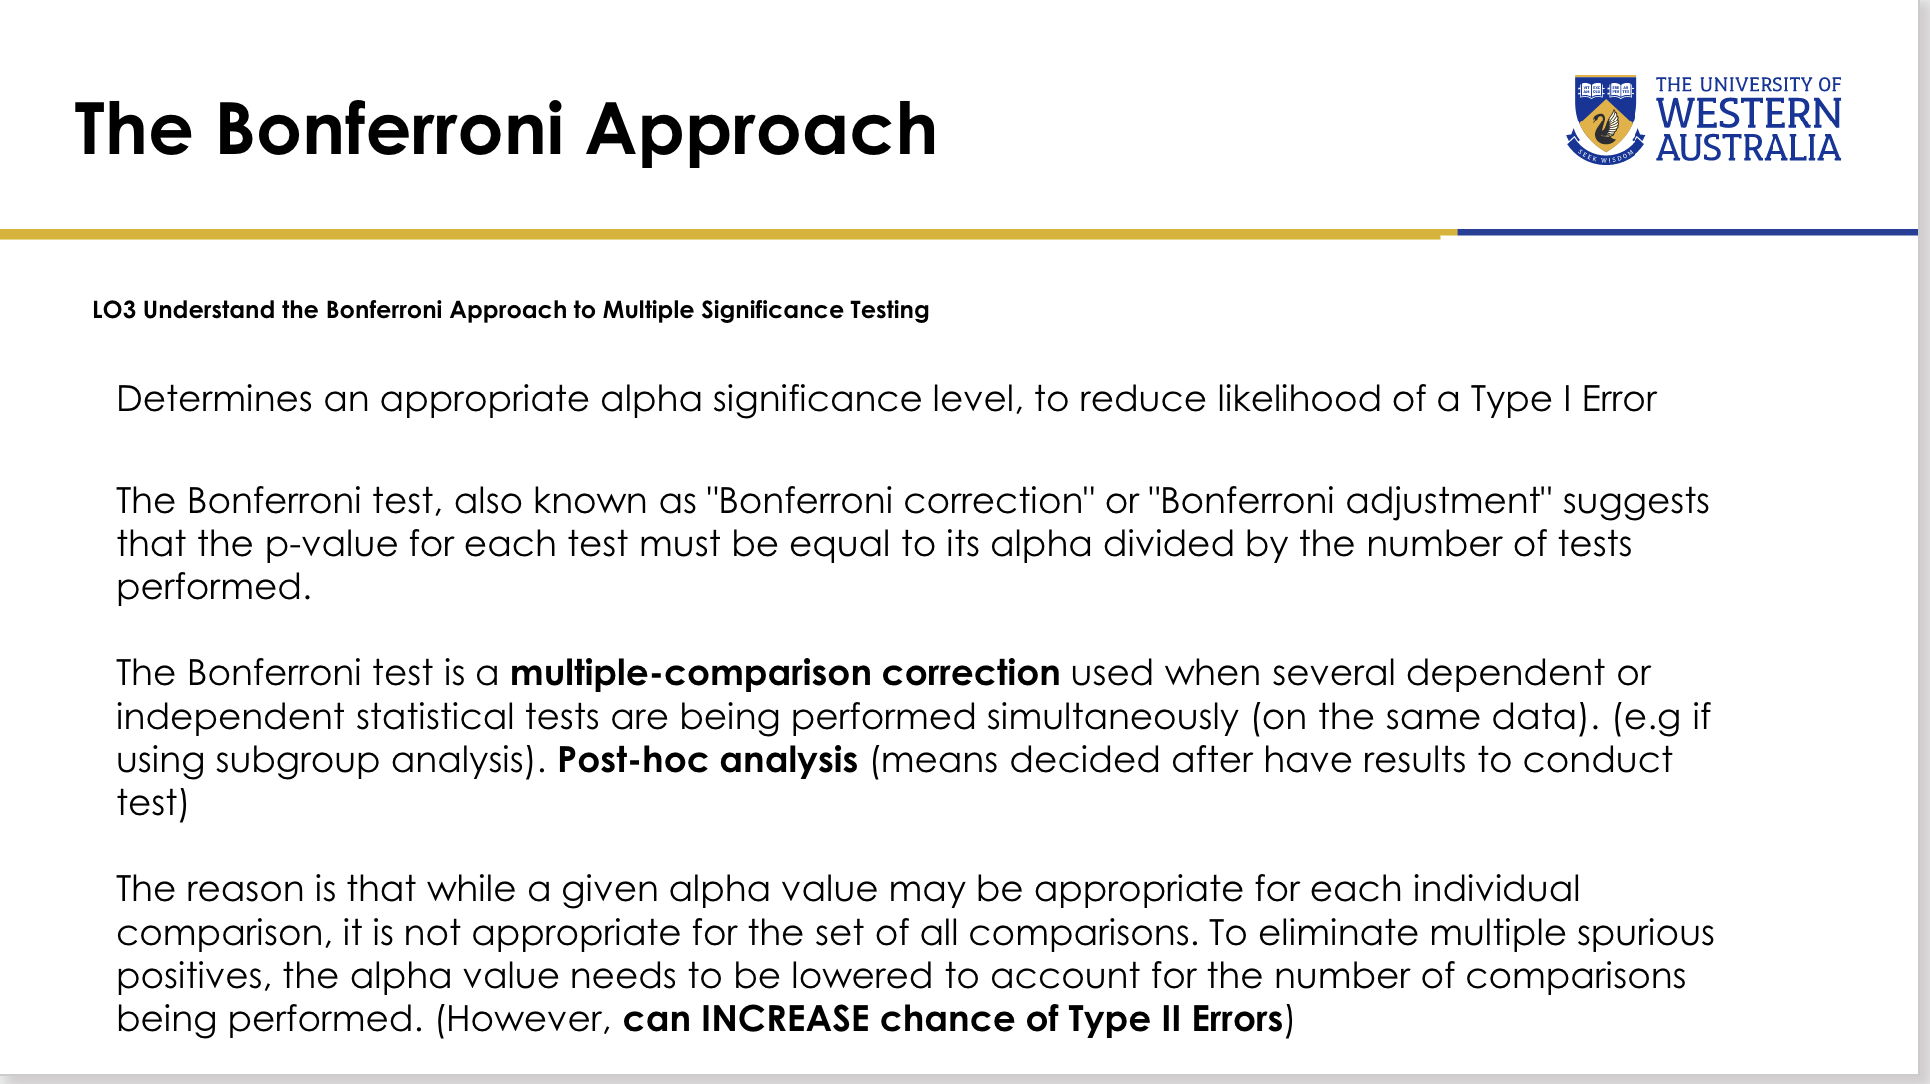
The Bonferroni correction is a multiple-comparison adjustment used when several dependent or independent statistical tests are performed on the same data.

Adjusted alpha:

α_adjusted = α / number of tests

Its purpose is to reduce the likelihood of Type I errors.
<p>The Bonferroni correction is a multiple-comparison adjustment used when several dependent or independent statistical tests are performed on the same data.</p><p>Adjusted alpha:</p><p>α_adjusted = α / number of tests</p><p>Its purpose is to reduce the likelihood of Type I errors.</p>
30
New cards
<p>Why is Bonferroni correction needed when many statistical tests are performed?</p>

Why is Bonferroni correction needed when many statistical tests are performed?

If many tests are applied to the same dataset, the chance of obtaining a spurious statistically significant result increases.

Lowering alpha makes the criterion more stringent across the family of comparisons.

<p>If many tests are applied to the same dataset, the chance of obtaining a spurious statistically significant result increases.</p><p>Lowering alpha makes the criterion more stringent across the family of comparisons.</p>
31
New cards
<p>What is a post-hoc analysis in this lecture?</p>

What is a post-hoc analysis in this lecture?

A post-hoc analysis is an analysis decided after the results/data are already available.

.

Lecturer examples:

- Splitting a dataset by gender

- Splitting by age

- Running additional subgroup analyses after seeing the overall results

<p>A post-hoc analysis is an analysis decided after the results/data are already available.</p><p>.</p><p>Lecturer examples:</p><p>- Splitting a dataset by gender</p><p>- Splitting by age</p><p>- Running additional subgroup analyses after seeing the overall results</p>
32
New cards
<p>What is the trade-off of applying the Bonferroni correction?</p>

What is the trade-off of applying the Bonferroni correction?

Benefit:

- Reduces Type I error / false positives.

Cost:

- Can increase Type II error / false negatives.

Lecturer emphasis:

Clinical significance still matters; do not focus only on whether a p-value crosses a statistical threshold.

<p>Benefit:</p><p>- Reduces Type I error / false positives.</p><p>Cost:</p><p>- Can increase Type II error / false negatives.</p><p>Lecturer emphasis:</p><p>Clinical significance still matters; do not focus only on whether a p-value crosses a statistical threshold.</p>
33
New cards
<p>If my study is comparing two primary care services and interested in the systolic blood pressure readings for patients when first referred to specialist CV services, which analysis would I use?</p><p>A. Independent t test</p><p>B. Paired t test</p><p>C. Mann-Whitney U</p><p>D. Wilcoxon signed-rank</p><p>E. Chi-square or Fisher's exact</p>

If my study is comparing two primary care services and interested in the systolic blood pressure readings for patients when first referred to specialist CV services, which analysis would I use?

A. Independent t test

B. Paired t test

C. Mann-Whitney U

D. Wilcoxon signed-rank

E. Chi-square or Fisher's exact

Correct answer:

C. Mann-Whitney U

Why it is correct:

The answer slide selects Mann-Whitney U, implying continuous but non-parametric data from independent samples.

.

Why the other options are incorrect:

A. Independent t test — would require the relevant parametric assumptions to be met.

B. Paired t test — the samples are not paired.

D. Wilcoxon signed-rank — this is for paired/related non-parametric data.

E. Chi-square or Fisher's exact — these are for dichotomous/categorical outcomes rather than continuous systolic blood pressure.

.

Lecturer explanation:

The answer slide states that reaching Mann-Whitney U assumes the same doctors are not working at both practices, so the samples can be treated as independent.

<p>Correct answer:</p><p>C. Mann-Whitney U</p><p>Why it is correct:</p><p>The answer slide selects Mann-Whitney U, implying continuous but non-parametric data from independent samples.</p><p>.</p><p>Why the other options are incorrect:</p><p>A. Independent t test — would require the relevant parametric assumptions to be met.</p><p>B. Paired t test — the samples are not paired.</p><p>D. Wilcoxon signed-rank — this is for paired/related non-parametric data.</p><p>E. Chi-square or Fisher's exact — these are for dichotomous/categorical outcomes rather than continuous systolic blood pressure.</p><p>.</p><p>Lecturer explanation:</p><p>The answer slide states that reaching Mann-Whitney U assumes the same doctors are not working at both practices, so the samples can be treated as independent.</p>
34
New cards

What are the four learning outcomes for Statistical Testing II?

1. Describe, apply and interpret tests of association, focusing on Pearson's correlation.

2. Describe, apply and interpret tests of prediction, focusing on simple linear regression.

3. Describe, apply and interpret survival analysis and hazard ratio.

4. Interpret non-significant results.

35
New cards
<p>How does Statistical Testing II differ from Statistical Testing I?</p>

How does Statistical Testing II differ from Statistical Testing I?

Statistical Testing I:

- Comparing samples/groups

.

Statistical Testing II:

- Analysing relationships between variables

.

Main association test emphasised:

- Pearson's r

<p>Statistical Testing I:</p><p>- Comparing samples/groups</p><p>.</p><p>Statistical Testing II:</p><p>- Analysing relationships between variables</p><p>.</p><p>Main association test emphasised:</p><p>- Pearson's r</p>
36
New cards
<p>What is regression?</p>

What is regression?

Regression statistics relate a dependent variable (DV) to one or more independent variables (IVs).

Regression models indicate whether changes in the DV are associated with changes in one or more IVs.

<p>Regression statistics relate a dependent variable (DV) to one or more independent variables (IVs).</p><p>Regression models indicate whether changes in the DV are associated with changes in one or more IVs.</p>
37
New cards
<p>What is simple linear regression?</p>

What is simple linear regression?

Simple linear regression is the simplest form of regression.

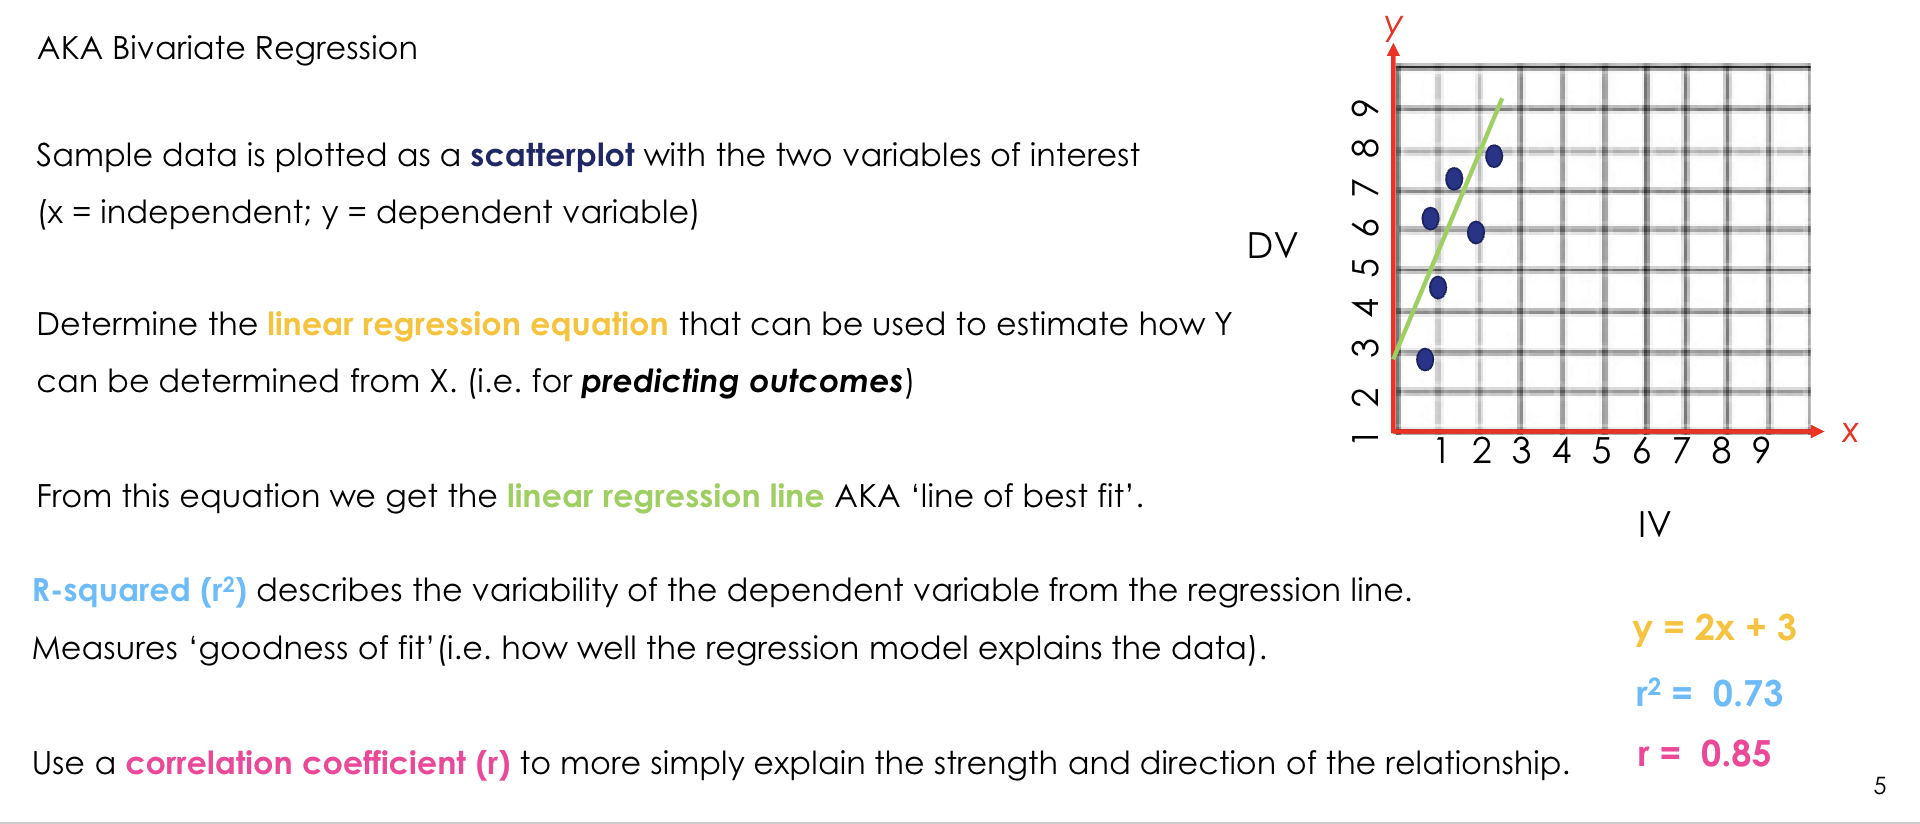
It assumes a straight-line relationship between:

- Independent variable on the x-axis

- Dependent variable on the y-axis

.

It is also called bivariate regression when considering two variables.

<p>Simple linear regression is the simplest form of regression.</p><p>It assumes a straight-line relationship between:</p><p>- Independent variable on the x-axis</p><p>- Dependent variable on the y-axis</p><p>.</p><p>It is also called bivariate regression when considering two variables.</p>
38
New cards
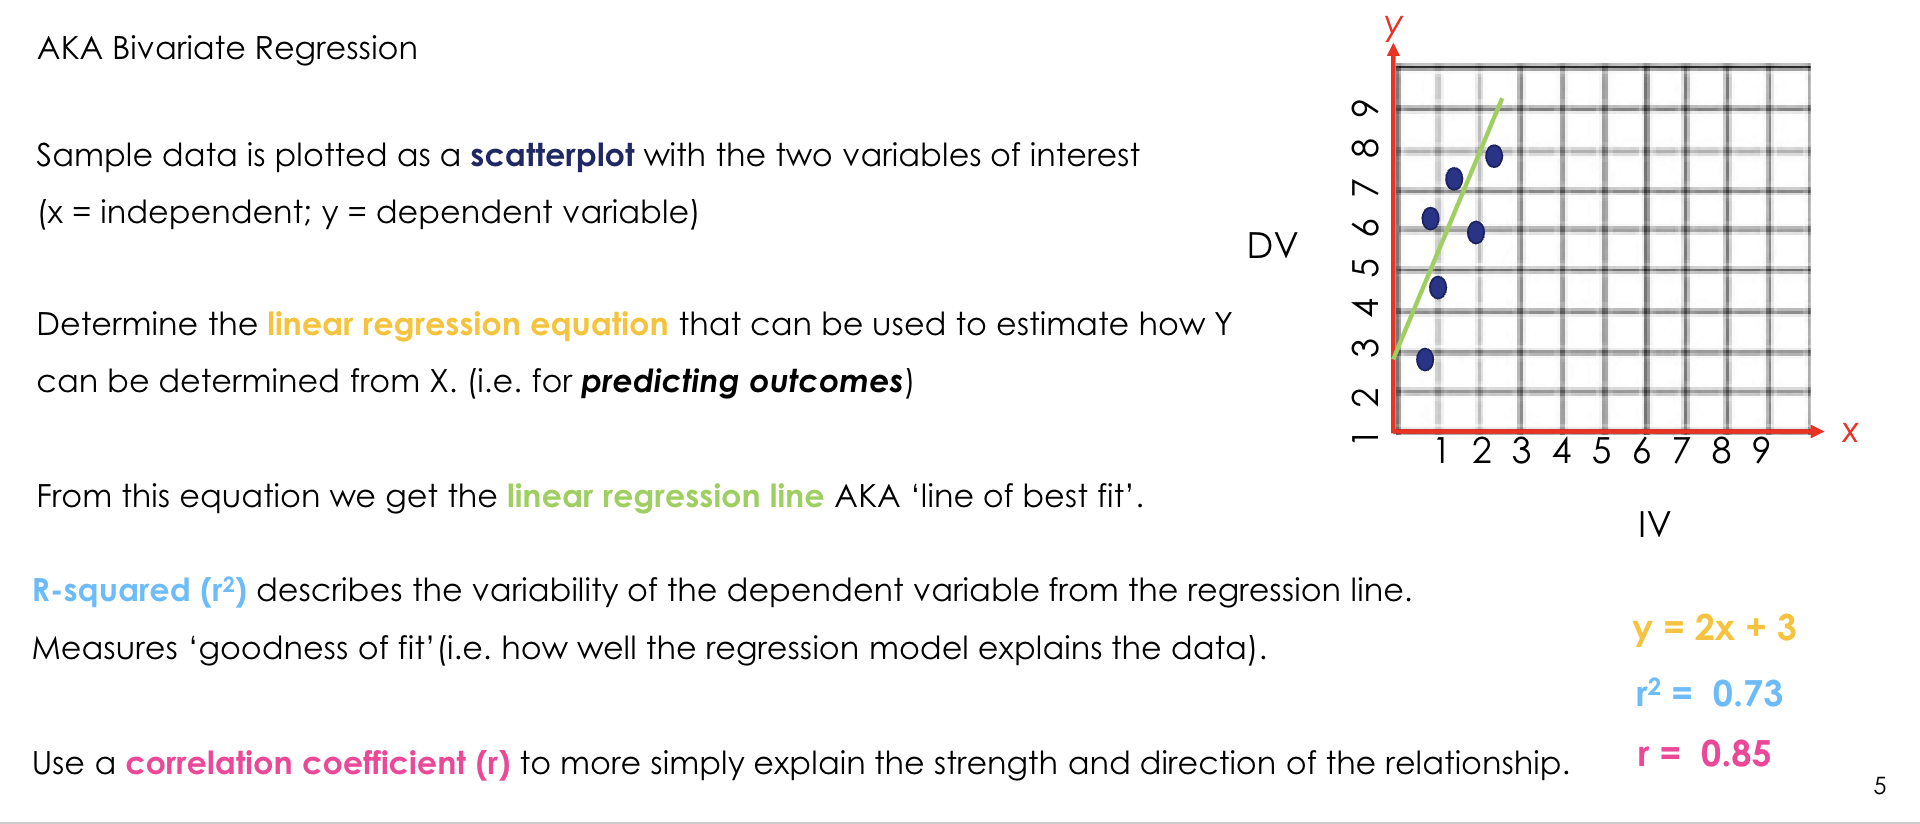
<p>What are the main components and outputs of simple linear regression?</p>

What are the main components and outputs of simple linear regression?

- Plot the sample data as a scatterplot.

- x-axis = independent variable.

- y-axis = dependent variable.

- Determine a linear regression equation.

- The equation gives a regression line / line of best fit.

- r = correlation coefficient describing strength and direction.

- r² = R-squared describing goodness of fit / variability explained.

<p>- Plot the sample data as a scatterplot.</p><p>- x-axis = independent variable.</p><p>- y-axis = dependent variable.</p><p>- Determine a linear regression equation.</p><p>- The equation gives a regression line / line of best fit.</p><p>- r = correlation coefficient describing strength and direction.</p><p>- r² = R-squared describing goodness of fit / variability explained.</p>
39
New cards
<p>What does R-squared (r²) represent?</p>

What does R-squared (r²) represent?

R² describes how well the regression model explains the data.

.

Slide wording:

- Describes variability of the dependent variable from the regression line.

- Measures "goodness of fit".

.

Lecturer example:

- r² = 0.73 was explained as approximately 73% of the variation being explained by the relationship represented in the model.
<p>R² describes how well the regression model explains the data.</p><p>.</p><p>Slide wording:</p><p>- Describes variability of the dependent variable from the regression line.</p><p>- Measures "goodness of fit".</p><p>.</p><p>Lecturer example:</p><p>- r² = 0.73 was explained as approximately 73% of the variation being explained by the relationship represented in the model.</p>
40
New cards
<p>What correction did the lecturer make to the example regression equation on Slide 5?</p>

What correction did the lecturer make to the example regression equation on Slide 5?

The displayed example had the numbers in the wrong positions.

Lecturer correction:

- The y-intercept should be 2.

- The gradient/slope should be 3.

.

So the intended example is:

y = 3x + 2

Lecturer explanation:

The constant added to the equation is the y-intercept, and the number multiplying x is the gradient.

<p>The displayed example had the numbers in the wrong positions.</p><p>Lecturer correction:</p><p>- The y-intercept should be 2.</p><p>- The gradient/slope should be 3.</p><p>.</p><p>So the intended example is:</p><p>y = 3x + 2</p><p>Lecturer explanation:</p><p>The constant added to the equation is the y-intercept, and the number multiplying x is the gradient.</p>
41
New cards
<p>What is the health-science linear regression equation and what does each term mean?</p>

What is the health-science linear regression equation and what does each term mean?

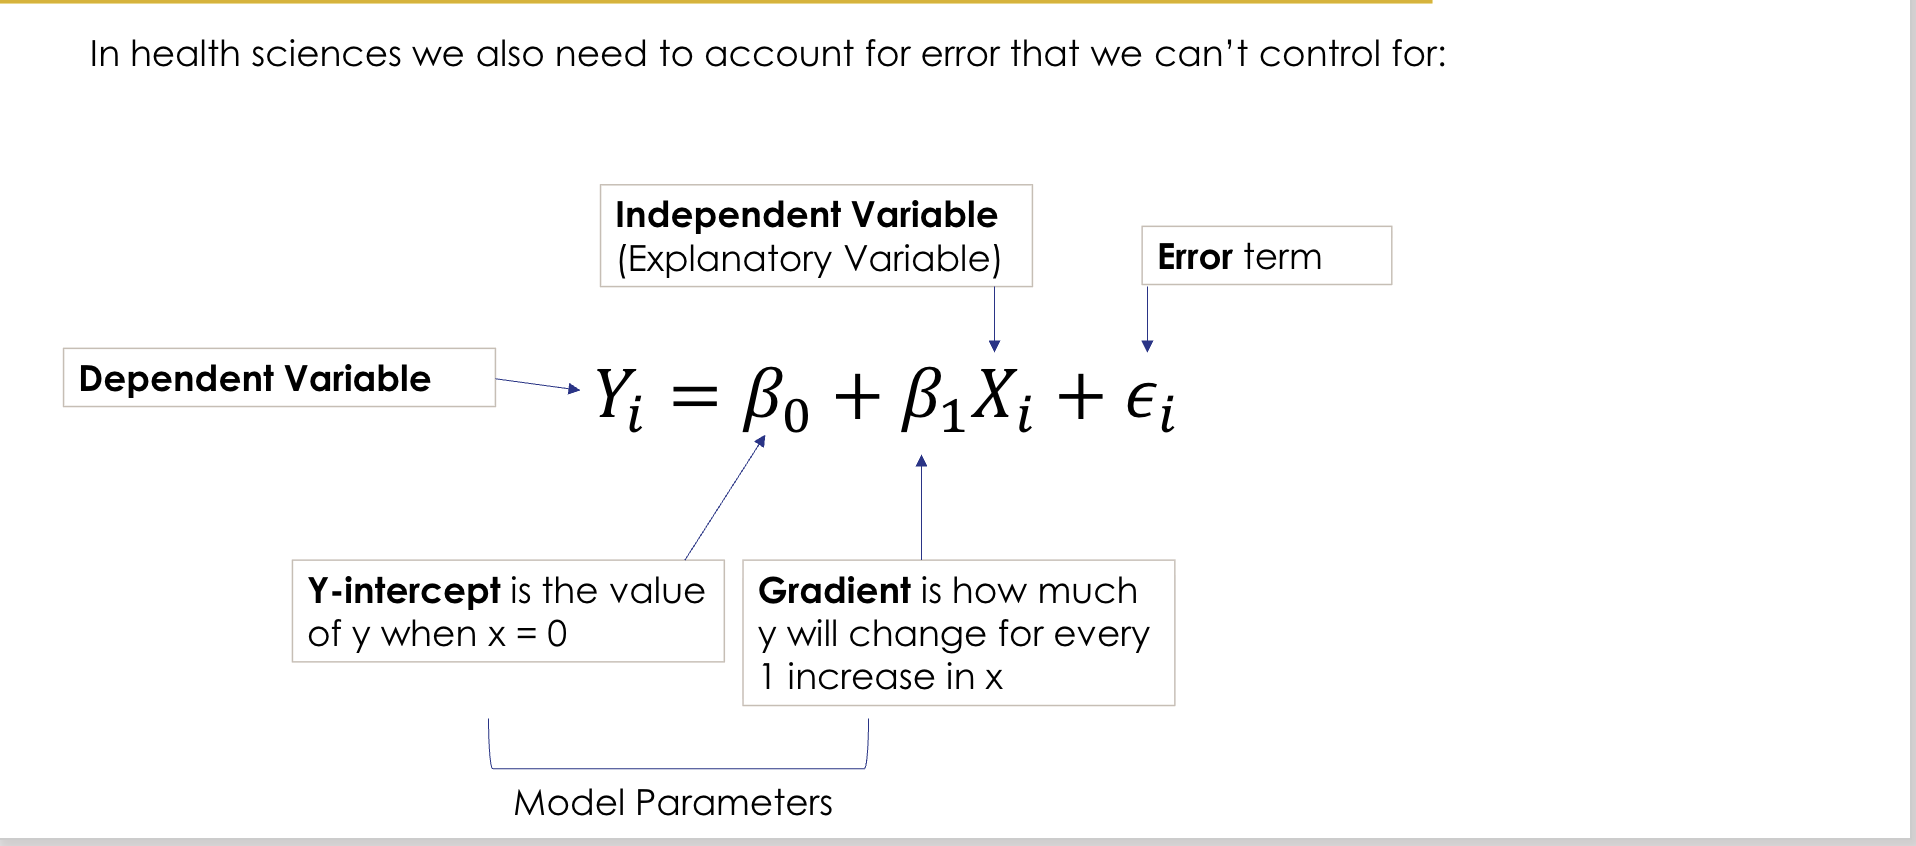
Yi = β0 + β1Xi + εi

.

Yi:

- Dependent variable

Xi:

- Independent / explanatory variable

β0:

- Y-intercept; value of y when x = 0

β1:

- Gradient/slope; how much y changes for each 1-unit increase in x

εi:

- Error term

.

β0 and β1:

- Model parameters

<p>Yi = β0 + β1Xi + εi</p><p>.</p><p>Yi:</p><p>- Dependent variable</p><p>Xi:</p><p>- Independent / explanatory variable</p><p>β0:</p><p>- Y-intercept; value of y when x = 0</p><p>β1:</p><p>- Gradient/slope; how much y changes for each 1-unit increase in x</p><p>εi:</p><p>- Error term</p><p>.</p><p>β0 and β1:</p><p>- Model parameters</p>
42
New cards
<p>Why is an error term included in health-science regression models?</p>

Why is an error term included in health-science regression models?

Health-science data always contain some variation/error that cannot be completely controlled or explained.

The ε term represents this unexplained component.

.

Lecturer explanation:

Even when equations are sometimes written without displaying ε explicitly, error is still assumed to exist in scientific data.

<p>Health-science data always contain some variation/error that cannot be completely controlled or explained.</p><p>The ε term represents this unexplained component.</p><p>.</p><p>Lecturer explanation:</p><p>Even when equations are sometimes written without displaying ε explicitly, error is still assumed to exist in scientific data.</p>
43
New cards
<p>How should the equation Weight = 31.979 + 0.2825 × Height be interpreted?</p>

How should the equation Weight = 31.979 + 0.2825 × Height be interpreted?

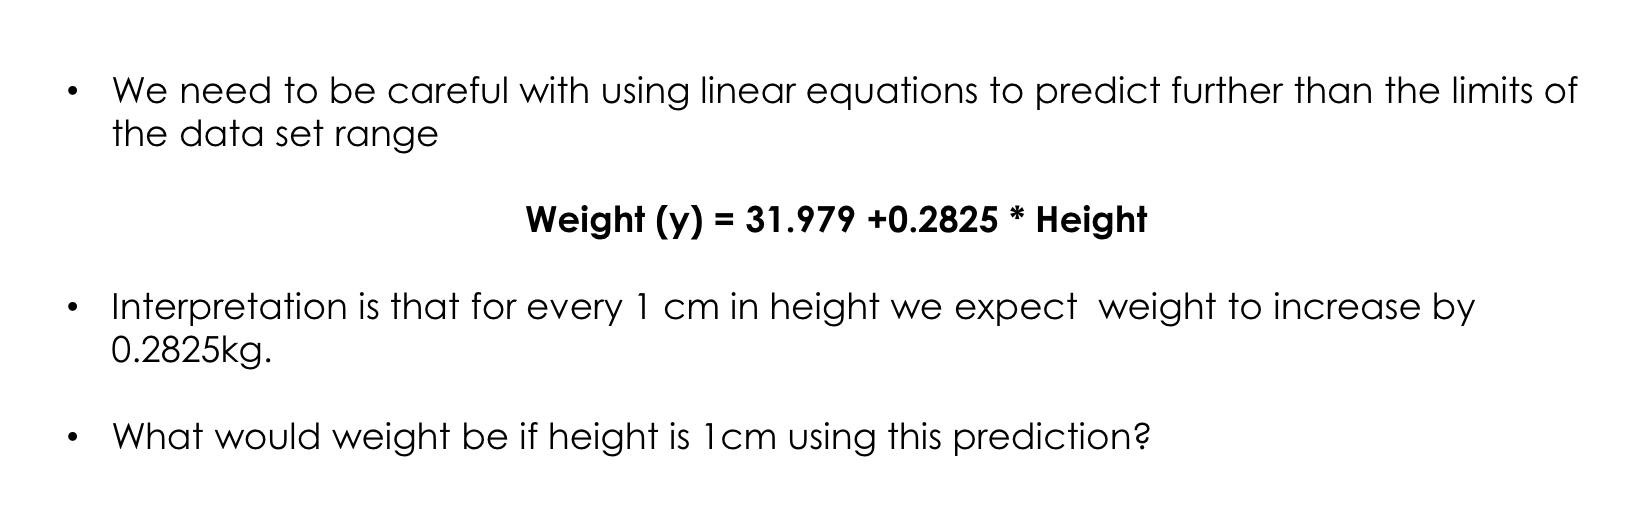
For every 1 cm increase in height, predicted weight increases by 0.2825 kg.

- 31.979 = y-intercept

- 0.2825 = gradient/slope
<p>For every 1 cm increase in height, predicted weight increases by 0.2825 kg.</p><p>- 31.979 = y-intercept</p><p>- 0.2825 = gradient/slope</p>
44
New cards
<p>Why should a regression equation not be extrapolated far beyond the observed data range?</p>

Why should a regression equation not be extrapolated far beyond the observed data range?

Predictions can become biologically or logically unreasonable outside the range used to fit the model.

.

Slide example:

Using Weight = 31.979 + 0.2825 × Height at a height of 1 cm predicts a weight of about 32.26 kg, which is nonsensical.

.

Lecturer emphasis:

Regression relationships usually have valid boundaries/ranges.

<p>Predictions can become biologically or logically unreasonable outside the range used to fit the model.</p><p>.</p><p>Slide example:</p><p>Using Weight = 31.979 + 0.2825 × Height at a height of 1 cm predicts a weight of about 32.26 kg, which is nonsensical.</p><p>.</p><p>Lecturer emphasis:</p><p>Regression relationships usually have valid boundaries/ranges.</p>
45
New cards
<p>What is a correlation coefficient (r)?</p>

What is a correlation coefficient (r)?

A correlation coefficient measures:

- Direction of the relationship: positive or negative

- Strength of the relationship between variables

r ranges from −1 through 0 to +1.

<p>A correlation coefficient measures:</p><p>- Direction of the relationship: positive or negative</p><p>- Strength of the relationship between variables</p><p>r ranges from −1 through 0 to +1.</p>
46
New cards
<p>What assumptions are required for Pearson's correlation coefficient?</p>

What assumptions are required for Pearson's correlation coefficient?

Pearson's r assumes:

- Normally distributed data

- Linear relationship

- Continuous data

.

It is the main correlation method emphasised in this lecture.
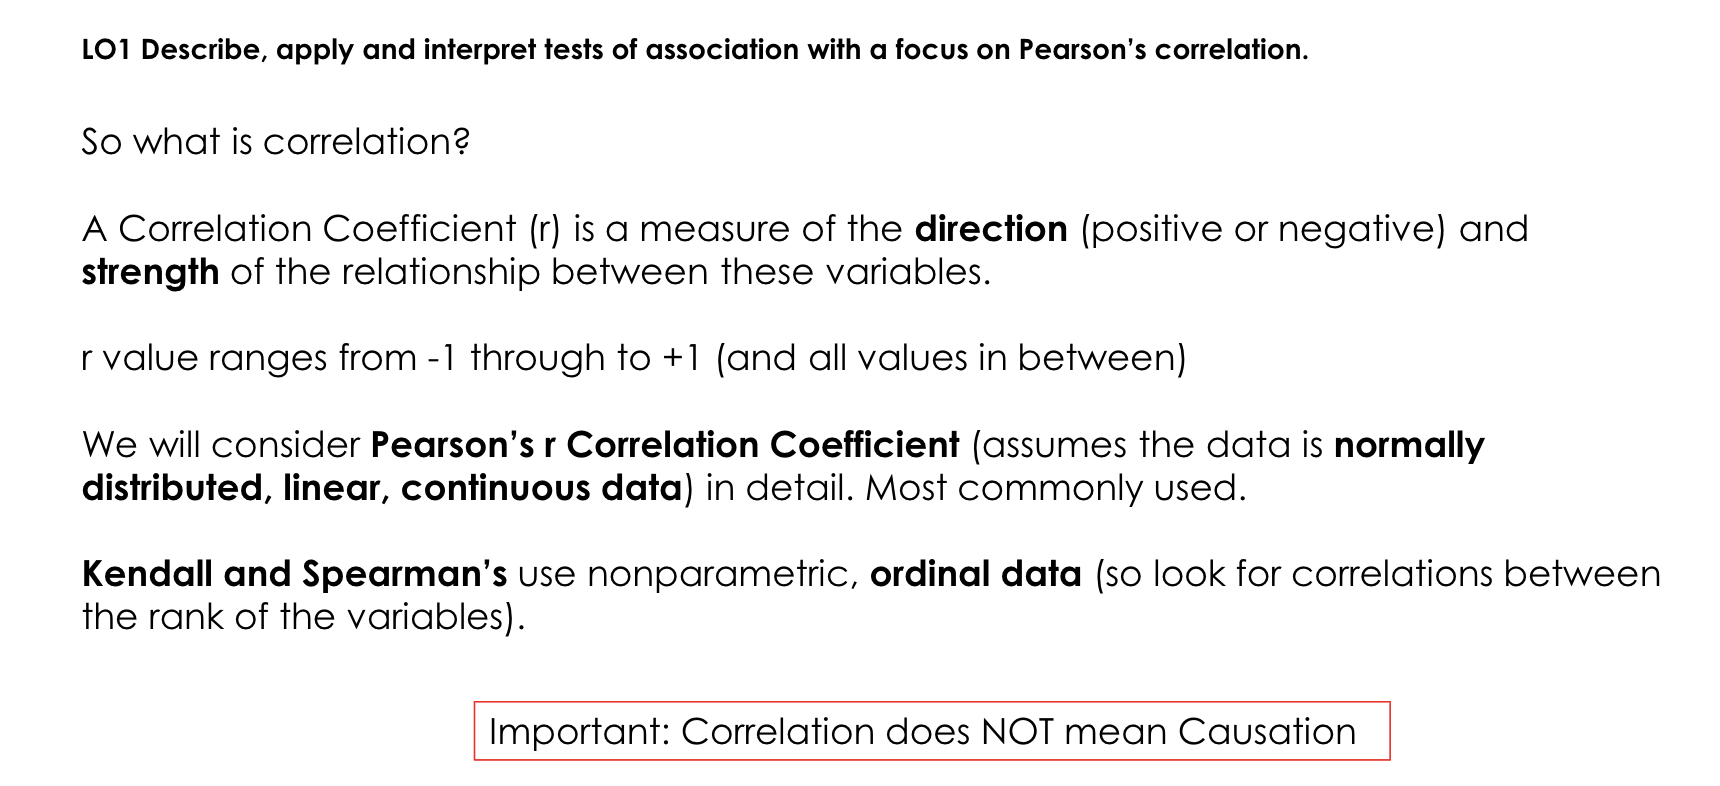
<p>Pearson's r assumes:</p><p>- Normally distributed data</p><p>- Linear relationship</p><p>- Continuous data</p><p>.</p><p>It is the main correlation method emphasised in this lecture.</p>
47
New cards
<p>When are Spearman's or Kendall's correlation methods more appropriate?</p>

When are Spearman's or Kendall's correlation methods more appropriate?

They are non-parametric approaches commonly used with ordinal/ranked data.

They assess correlations between the ranks of variables.

<p>They are non-parametric approaches commonly used with ordinal/ranked data.</p><p>They assess correlations between the ranks of variables.</p>
48
New cards
<p>What is the key caution when interpreting correlation?</p>

What is the key caution when interpreting correlation?

Correlation does NOT mean causation.

An association between two variables does not prove that changing one variable causes the other to change.

.

Lecturer emphasis:

This point was repeated several times in the lecture.

<p>Correlation does NOT mean causation.</p><p>An association between two variables does not prove that changing one variable causes the other to change.</p><p>.</p><p>Lecturer emphasis:</p><p>This point was repeated several times in the lecture.</p>
49
New cards
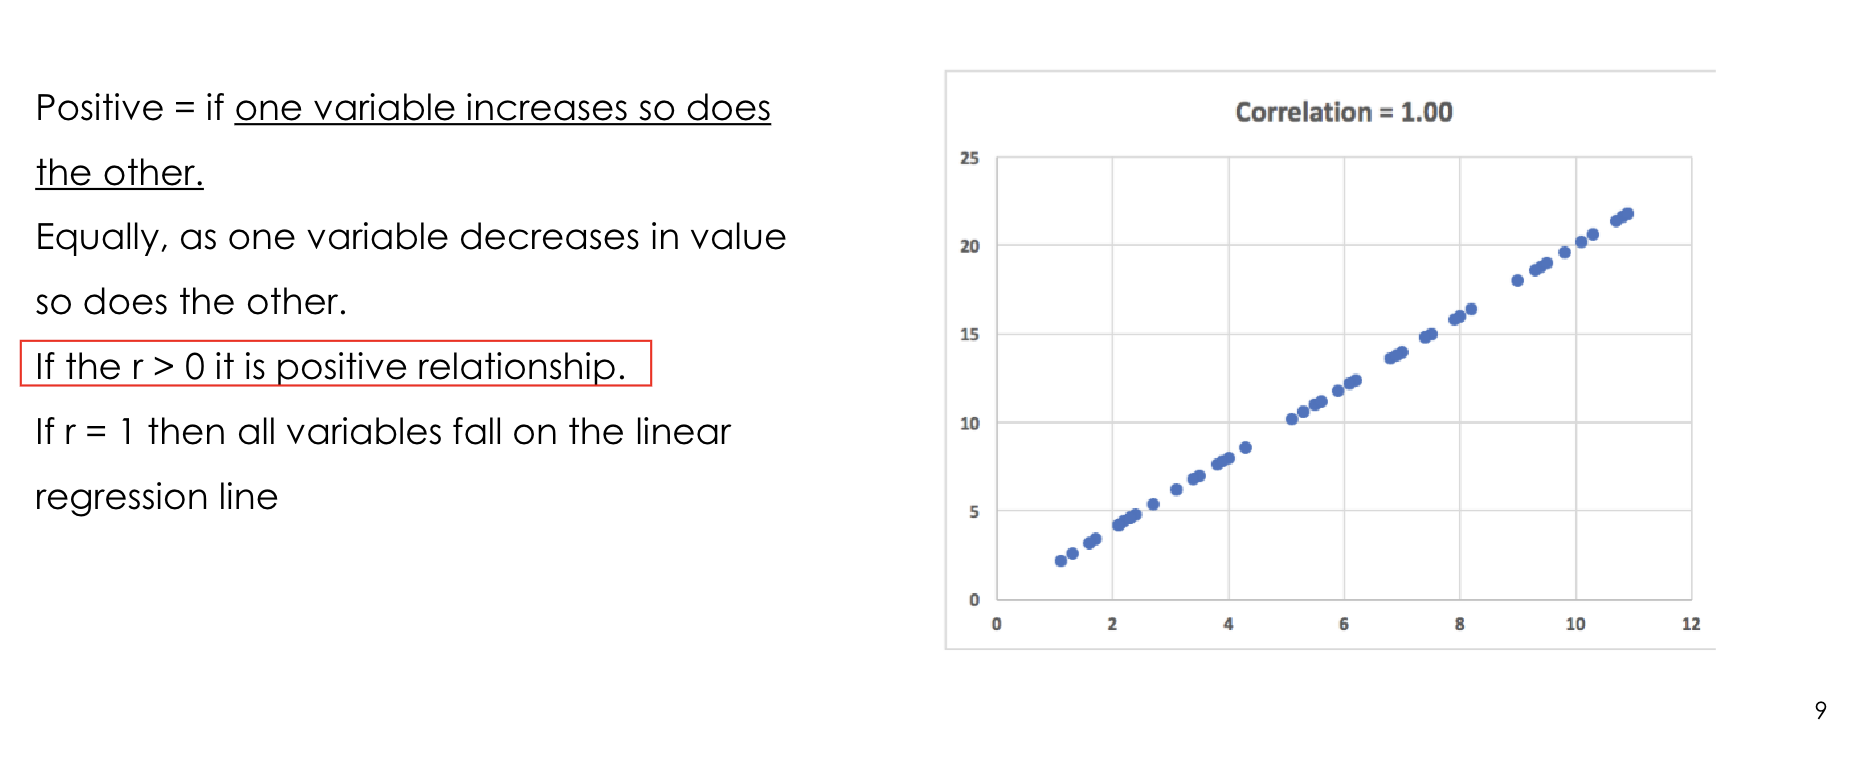
<p>What is a positive linear relationship?</p>

What is a positive linear relationship?

A positive relationship means:

- As one variable increases, the other also increases.

- As one variable decreases, the other also decreases.

- r > 0.

.

If r = +1:

- All data points lie on the linear regression line.

- This is a perfect positive linear relationship.

<p>A positive relationship means:</p><p>- As one variable increases, the other also increases.</p><p>- As one variable decreases, the other also decreases.</p><p>- r &gt; 0.</p><p>.</p><p>If r = +1:</p><p>- All data points lie on the linear regression line.</p><p>- This is a perfect positive linear relationship.</p>
50
New cards
<p>What is a negative linear relationship?</p>

What is a negative linear relationship?

A negative relationship means:

- As one variable increases, the other decreases.

- As one decreases, the other increases.

- r < 0.

.

If r = −1:

- All data points lie on the linear regression line.

- This is a perfect negative linear relationship.

<p>A negative relationship means:</p><p>- As one variable increases, the other decreases.</p><p>- As one decreases, the other increases.</p><p>- r &lt; 0.</p><p>.</p><p>If r = −1:</p><p>- All data points lie on the linear regression line.</p><p>- This is a perfect negative linear relationship.</p>
51
New cards
<p>What does r = 0 indicate?</p>

What does r = 0 indicate?

r = 0 indicates no directional linear relationship between the variables.

<p>r = 0 indicates no directional linear relationship between the variables.</p>
52
New cards
<p>How were positive Pearson correlation coefficients interpreted in this lecture?</p>

How were positive Pearson correlation coefficients interpreted in this lecture?

Positive r values:

- r = 0 → no association

- r < 0.20 → very weak

- r = 0.21-0.40 → weak

- r = 0.41-0.70 → medium

- r = 0.71-0.90 → strong

- r = 0.91-0.99 → very strong

- r = 1.0 → perfect positive

.

Example:

r = 0.34 → weak positive relationship

.

Note:

Cut-offs and descriptors can vary between disciplines.

<p>Positive r values:</p><p>- r = 0 → no association</p><p>- r &lt; 0.20 → very weak</p><p>- r = 0.21-0.40 → weak</p><p>- r = 0.41-0.70 → medium</p><p>- r = 0.71-0.90 → strong</p><p>- r = 0.91-0.99 → very strong</p><p>- r = 1.0 → perfect positive</p><p>.</p><p>Example:</p><p>r = 0.34 → weak positive relationship</p><p>.</p><p>Note:</p><p>Cut-offs and descriptors can vary between disciplines.</p>
53
New cards
<p>How were negative Pearson correlation coefficients interpreted in this lecture?</p>

How were negative Pearson correlation coefficients interpreted in this lecture?

Negative r values:

- r = 0 → no association

- r > −0.20 in magnitude / close to 0 → very weak

- r = −0.21 to −0.40 → weak

- r = −0.41 to −0.70 → medium

- r = −0.71 to −0.90 → strong

- r = −0.91 to −0.99 → very strong

- r = −1.0 → perfect negative

.

Example:

r = −0.69 → medium negative relationship

Note:

Cut-offs and descriptors can vary between disciplines.

<p>Negative r values:</p><p>- r = 0 → no association</p><p>- r &gt; −0.20 in magnitude / close to 0 → very weak</p><p>- r = −0.21 to −0.40 → weak</p><p>- r = −0.41 to −0.70 → medium</p><p>- r = −0.71 to −0.90 → strong</p><p>- r = −0.91 to −0.99 → very strong</p><p>- r = −1.0 → perfect negative</p><p>.</p><p>Example:</p><p>r = −0.69 → medium negative relationship</p><p>Note:</p><p>Cut-offs and descriptors can vary between disciplines.</p>
54
New cards

How is statistical significance determined after Pearson's r is calculated?

The slide notes that Pearson's test generates an r value, followed by further steps to calculate a t value.

That t value is compared with a critical t value to determine whether p is above or below the predetermined alpha significance level.

55
New cards
<p>What did the oxygen uptake efficiency slope (OUES) example demonstrate?</p>

What did the oxygen uptake efficiency slope (OUES) example demonstrate?

The study compared oxygen uptake efficiency slope with oxygen consumption at peak exercise.

.

Conclusion shown:

The null hypothesis of no association was rejected.

OUES may be useful as a cardiopulmonary fitness index in people with severe limitations performing cardiopulmonary exercise testing, such as morbidly obese women.

.

Lecturer explanation:

Lower-intensity measurements showed similar relationships to higher-intensity measurements, suggesting useful estimation without requiring maximal exercise.

<p>The study compared oxygen uptake efficiency slope with oxygen consumption at peak exercise.</p><p>.</p><p>Conclusion shown:</p><p>The null hypothesis of no association was rejected.</p><p>OUES may be useful as a cardiopulmonary fitness index in people with severe limitations performing cardiopulmonary exercise testing, such as morbidly obese women.</p><p>.</p><p>Lecturer explanation:</p><p>Lower-intensity measurements showed similar relationships to higher-intensity measurements, suggesting useful estimation without requiring maximal exercise.</p>
56
New cards
<p>How should the COVID-19 testing and mortality example be interpreted?</p>

How should the COVID-19 testing and mortality example be interpreted?

In low-income countries:

- Number of COVID-19 tests and COVID-19 mortality had a medium negative association.

- As number of tests increased, mortality decreased.

- p = 0.002, below α = 0.05 → statistically significant.

.

Lecturer explanation:

The test itself does not necessarily cause lower mortality; behaviours and management after diagnosis may contribute.

<p>In low-income countries:</p><p>- Number of COVID-19 tests and COVID-19 mortality had a medium negative association.</p><p>- As number of tests increased, mortality decreased.</p><p>- p = 0.002, below α = 0.05 → statistically significant.</p><p>.</p><p>Lecturer explanation:</p><p>The test itself does not necessarily cause lower mortality; behaviours and management after diagnosis may contribute.</p>
57
New cards
<p>How should r = 0.605 with p &lt; 0.001 be interpreted for insulin resistance and coronary artery disease severity?</p>

How should r = 0.605 with p < 0.001 be interpreted for insulin resistance and coronary artery disease severity?

- r = 0.605 → medium positive relationship.

- As insulin resistance increases, severity of coronary artery disease tends to increase.

- p < 0.001 and α = 0.05 → statistically significant relationship.

<p>- r = 0.605 → medium positive relationship.</p><p>- As insulin resistance increases, severity of coronary artery disease tends to increase.</p><p>- p &lt; 0.001 and α = 0.05 → statistically significant relationship.</p>
58
New cards
<p>What relationships were shown between age, IQ and global cerebral blood flow?</p>

What relationships were shown between age, IQ and global cerebral blood flow?

Age vs global cerebral blood flow:

- r ≈ −0.65

- Medium negative association

- As age increases, global cerebral blood flow decreases.

.

IQ vs global cerebral blood flow:

- r ≈ +0.15

- Very weak positive association.

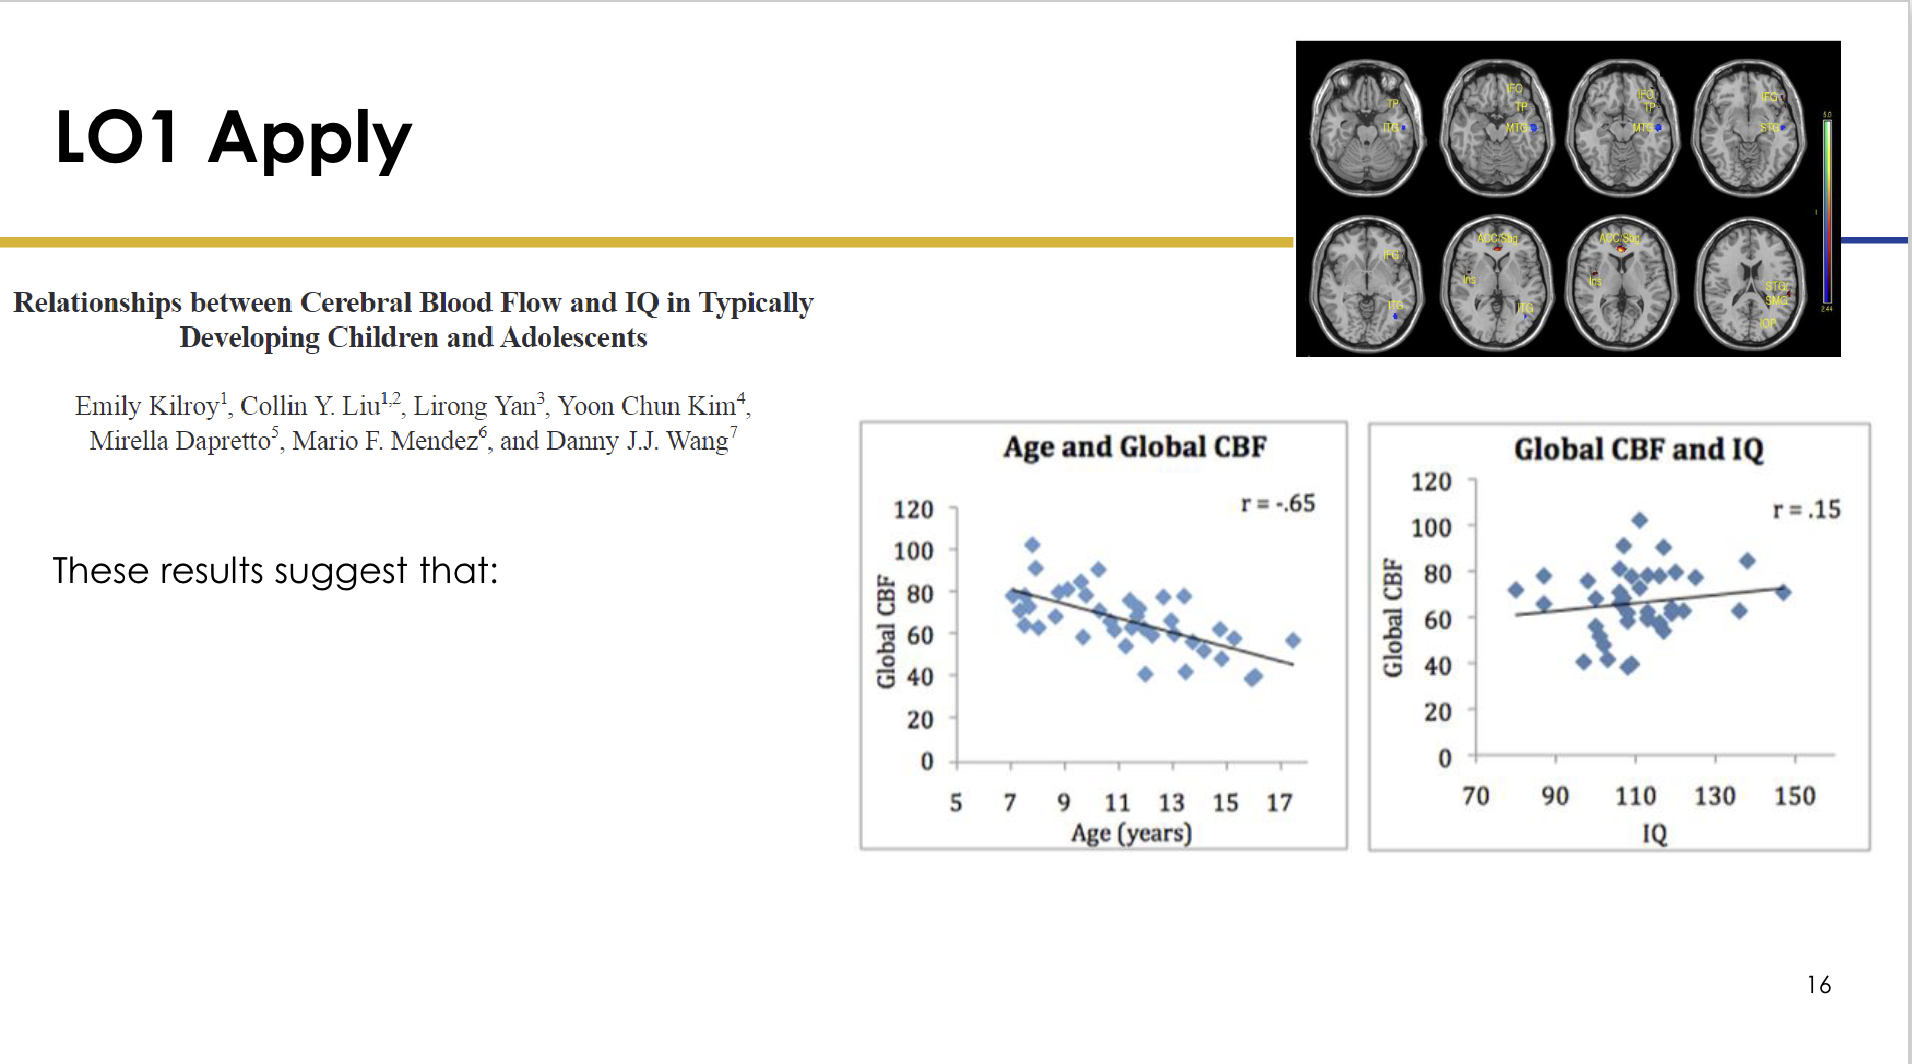
<p>Age vs global cerebral blood flow:</p><p>- r ≈ −0.65</p><p>- Medium negative association</p><p>- As age increases, global cerebral blood flow decreases.</p><p>.</p><p>IQ vs global cerebral blood flow:</p><p>- r ≈ +0.15</p><p>- Very weak positive association.</p>
59
New cards

What is survival analysis?

Survival analysis, also called time-to-event analysis, predicts the time until an event occurs.

It was originally developed to study time from treatment until death, but it is now used for many events.

Examples:

- Death after a chemotherapy regimen

- Failure of a knee replacement (could be investigating new biomaterial used in knee replacement implant)
60
New cards
<p>What is the Kaplan-Meier approach?</p>

What is the Kaplan-Meier approach?

Kaplan-Meier (KM) analysis:

- A commonly used non-parametric survival-analysis method

- Introduced by Kaplan and Meier in 1958

- Estimates survival/non-event probability over time
<p>Kaplan-Meier (KM) analysis:</p><p>- A commonly used non-parametric survival-analysis method</p><p>- Introduced by Kaplan and Meier in 1958</p><p>- Estimates survival/non-event probability over time</p>
61
New cards
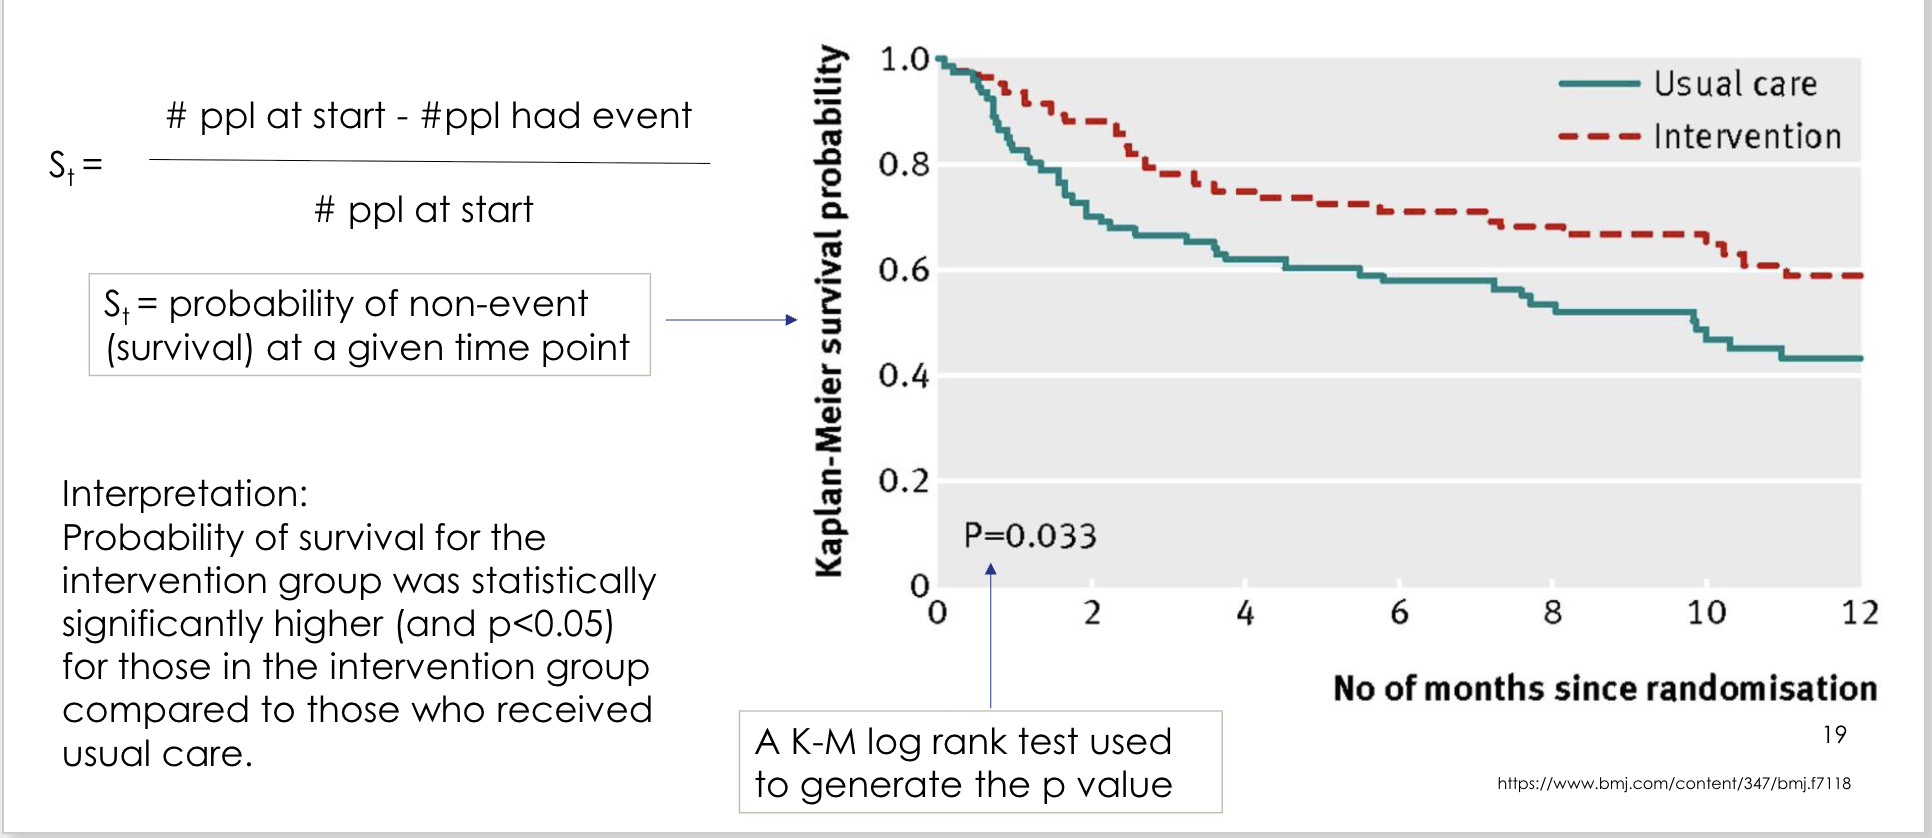
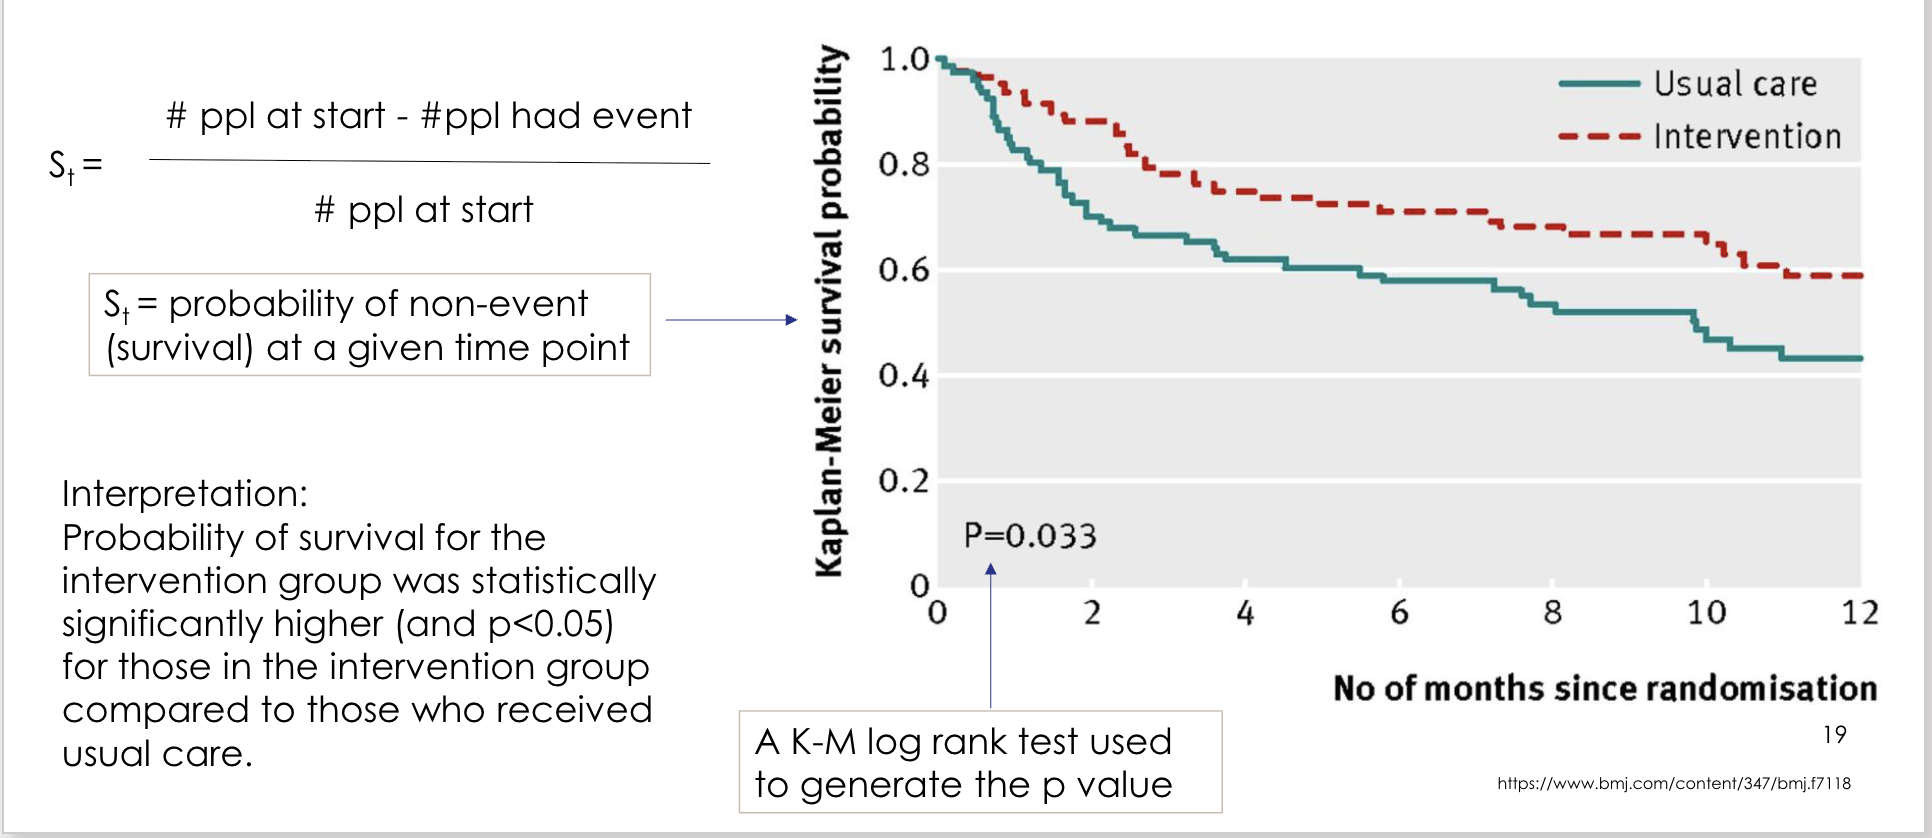
<p>How is survival probability St represented in the lecture?</p>

How is survival probability St represented in the lecture?

St = (# people at start − # people who have had the event) / # people at start

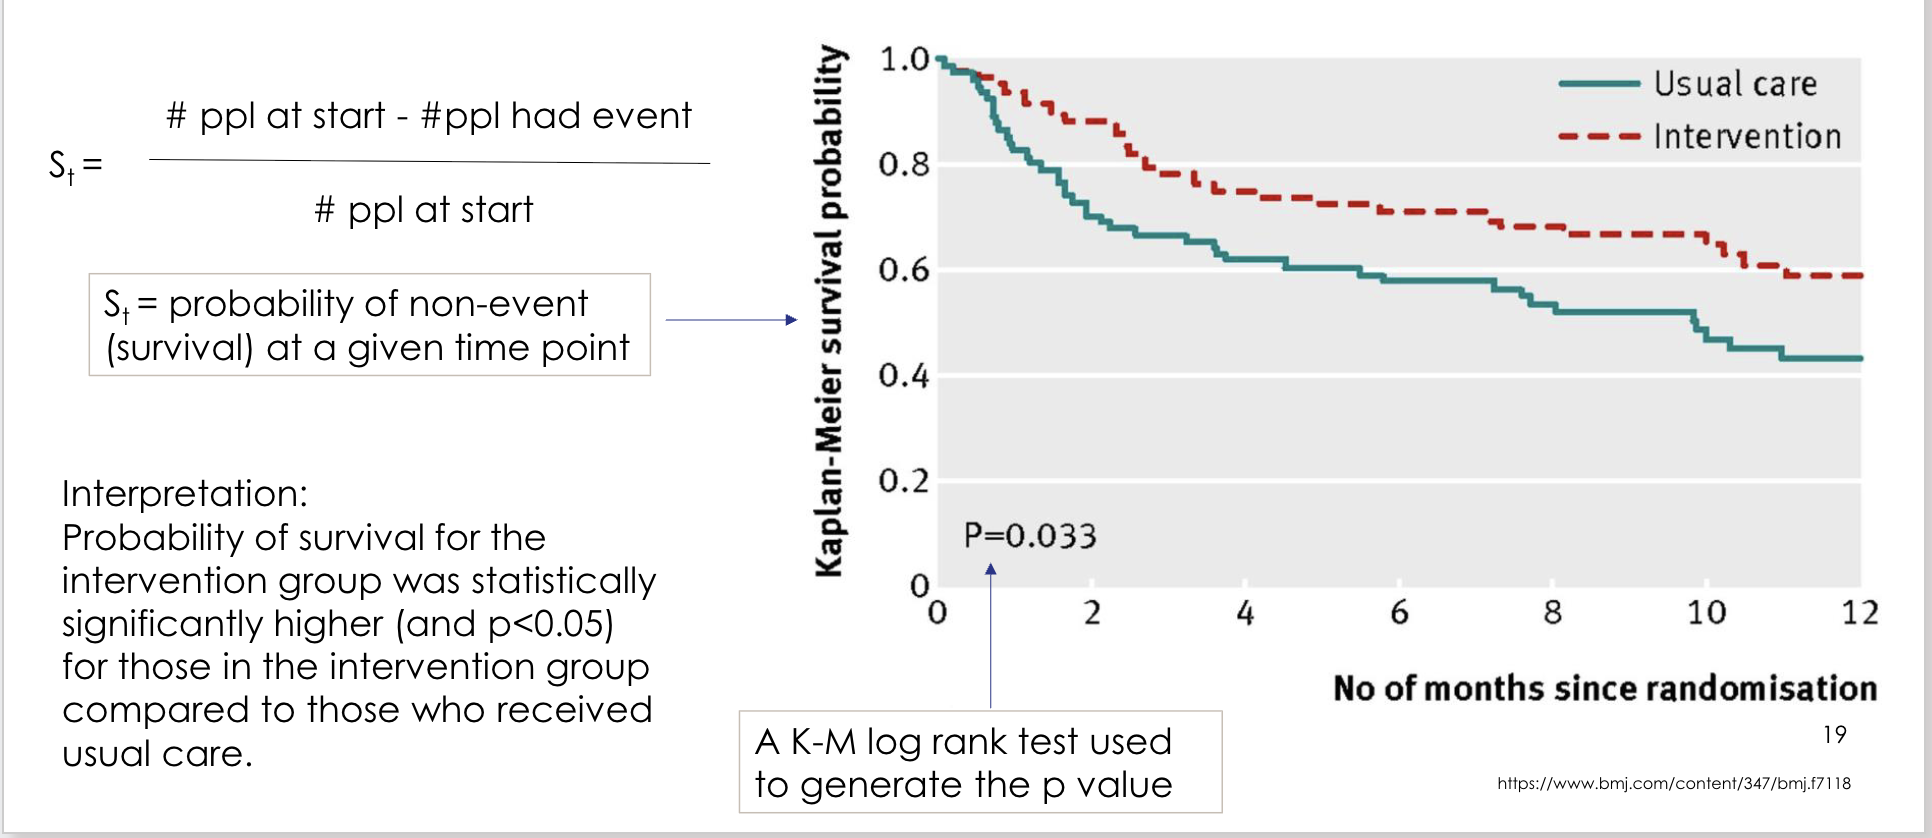
St represents the probability of non-event / survival at a given time point.

<p>St = (# people at start − # people who have had the event) / # people at start</p><p>St represents the probability of non-event / survival at a given time point.</p>
62
New cards
<p>How is a Kaplan-Meier survival curve interpreted in the intervention-versus-usual-care example?</p>

How is a Kaplan-Meier survival curve interpreted in the intervention-versus-usual-care example?

The intervention curve lies above the usual-care curve.

.

Interpretation:

- Probability of survival was statistically significantly higher in the intervention group.

- p < 0.05.

A Kaplan-Meier log-rank test was used to generate the p-value.

<p>The intervention curve lies above the usual-care curve.</p><p>.</p><p>Interpretation:</p><p>- Probability of survival was statistically significantly higher in the intervention group.</p><p>- p &lt; 0.05.</p><p>A Kaplan-Meier log-rank test was used to generate the p-value.</p>
63
New cards
<p>How was the biomarker survival-analysis example framed?</p>

How was the biomarker survival-analysis example framed?

Possible study question:

Do underlying biomarkers affect survival time in patients with head and neck squamous cell carcinoma?

.

H1:

- Biomarkers affect survival time.

H0:

- Biomarkers have no effect on survival time.

.

Conclusion shown:

- Reject H0 because survival time differs statistically significantly between biomarker groups.

Note:

- Female sample size was smaller.

<p>Possible study question:</p><p>Do underlying biomarkers affect survival time in patients with head and neck squamous cell carcinoma?</p><p>.</p><p>H1:</p><p>- Biomarkers affect survival time.</p><p>H0:</p><p>- Biomarkers have no effect on survival time.</p><p>.</p><p>Conclusion shown:</p><p>- Reject H0 because survival time differs statistically significantly between biomarker groups.</p><p>Note:</p><p>- Female sample size was smaller.</p>
64
New cards
<p>What Bonferroni-related issue did the lecturer raise for the male and female survival analyses?</p>

What Bonferroni-related issue did the lecturer raise for the male and female survival analyses?

The lecturer noted that analysing male and female subgroups separately may represent multiple/post-hoc analyses.

.

A stricter alpha, such as 0.01, may therefore be used.

This can make a result such as p = 0.024 fail the adjusted threshold even though it would be below the usual 0.05 threshold.

<p>The lecturer noted that analysing male and female subgroups separately may represent multiple/post-hoc analyses.</p><p>.</p><p>A stricter alpha, such as 0.01, may therefore be used.</p><p>This can make a result such as p = 0.024 fail the adjusted threshold even though it would be below the usual 0.05 threshold.</p>
65
New cards
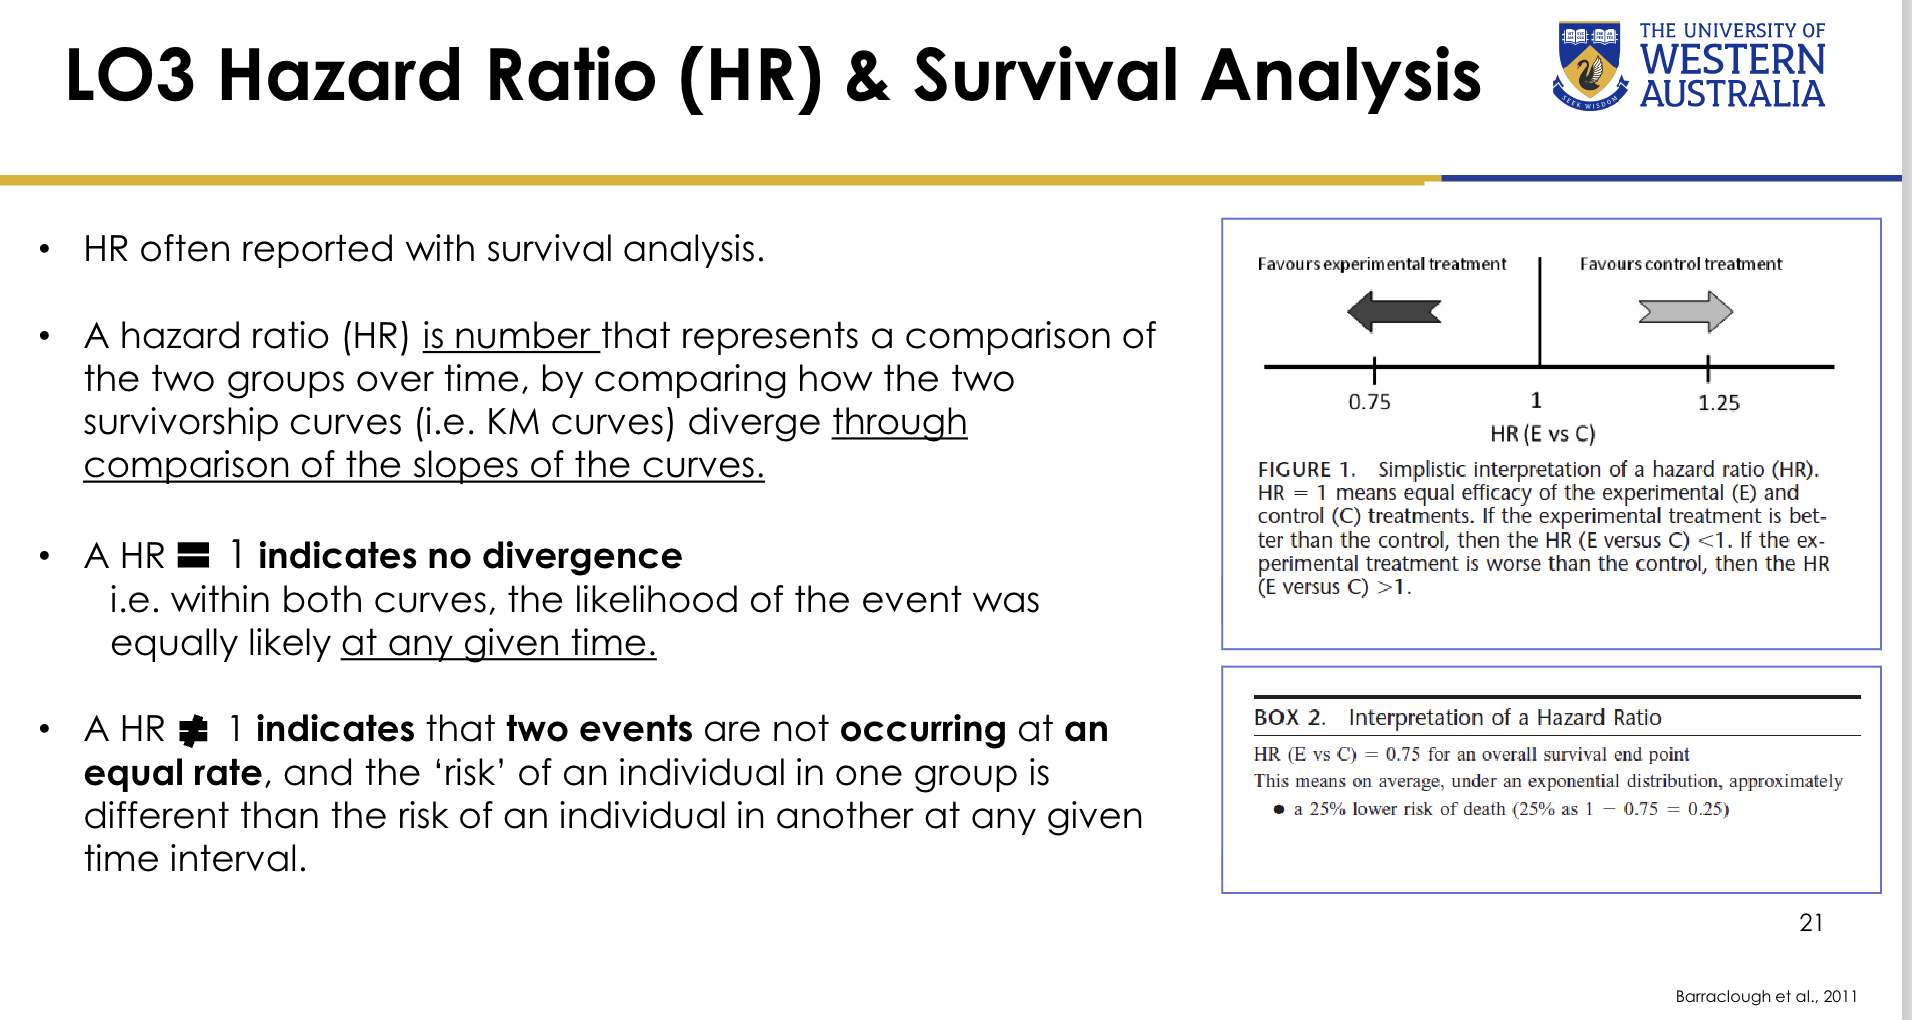
<p>What is a hazard ratio (HR)?</p>

What is a hazard ratio (HR)?

A hazard ratio is a number that compares two groups over time by considering how their survival/Kaplan-Meier curves diverge, through comparison of the relative slopes of the curves.

HR is commonly reported with survival analysis.

<p>A hazard ratio is a number that compares two groups over time by considering how their survival/Kaplan-Meier curves diverge, through comparison of the relative slopes of the curves.</p><p>HR is commonly reported with survival analysis.</p>
66
New cards
<p>How is HR = 1 interpreted?</p>

How is HR = 1 interpreted?

HR = 1 indicates no divergence in hazard:

- The event is equally likely in the two groups at any given time.

- The event rates are effectively equal.

<p>HR = 1 indicates no divergence in hazard:</p><p>- The event is equally likely in the two groups at any given time.</p><p>- The event rates are effectively equal.</p>
67
New cards
<p>How is an HR different from 1 interpreted?</p>

How is an HR different from 1 interpreted?

HR ≠ 1 indicates that the event rates are not equal between groups.

The risk/hazard for an individual in one group differs from the risk/hazard in the other group at a given time interval.

.

Lecturer example:

HR = 0.75 corresponds to approximately 25% lower hazard in the relevant group compared with the reference group.

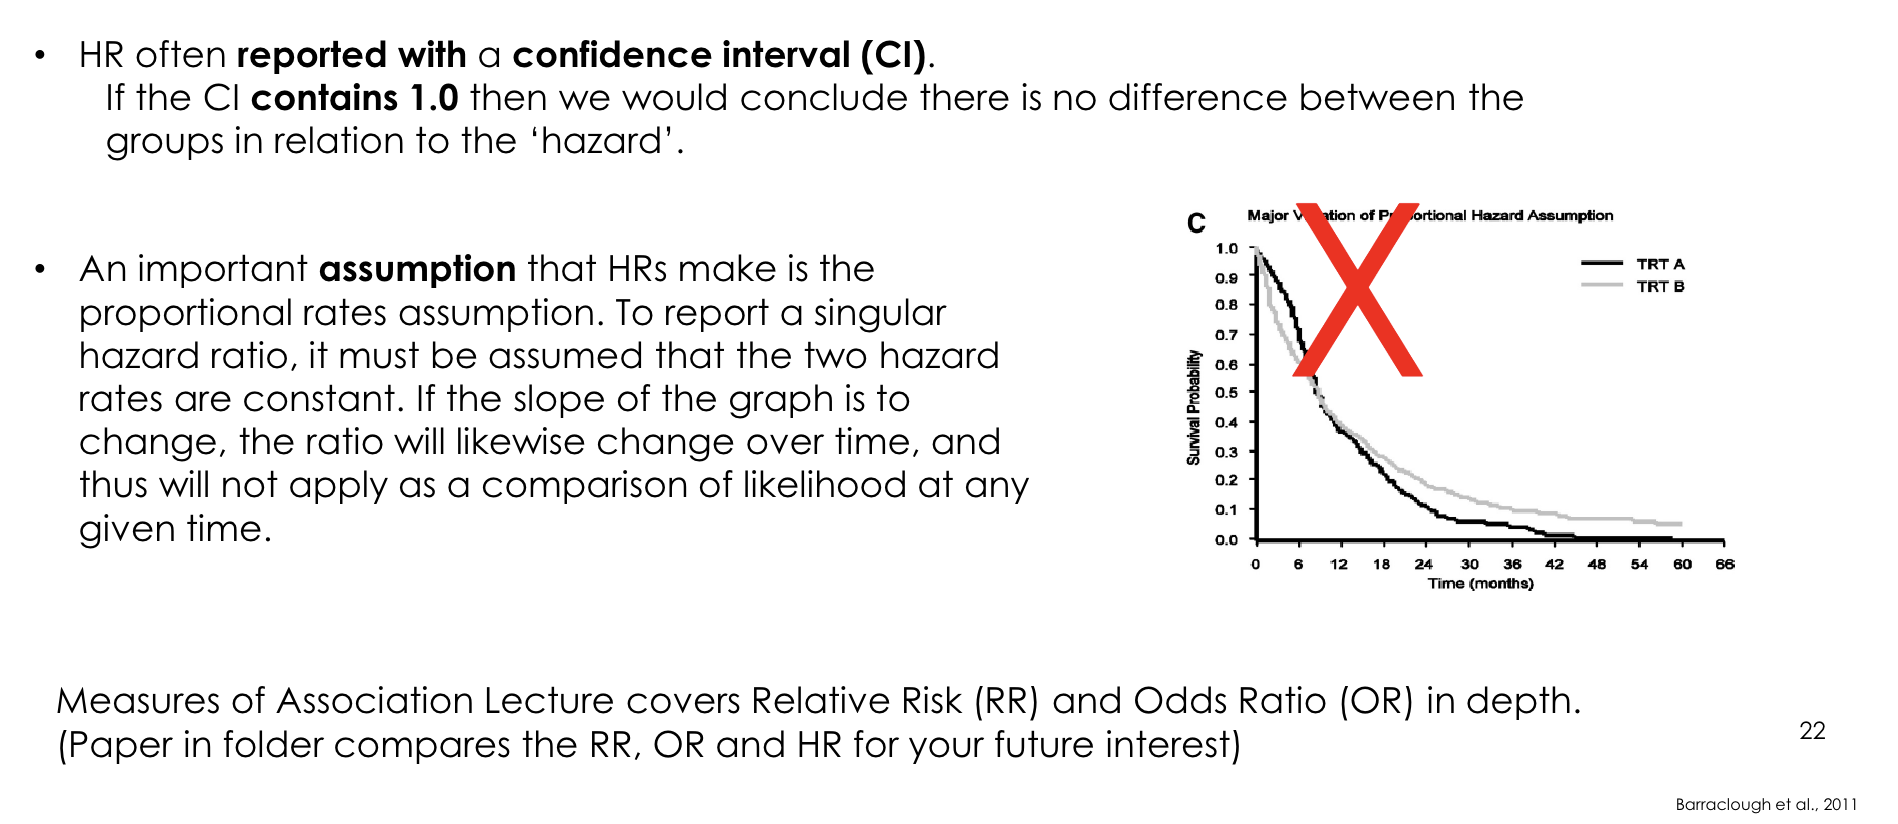
<p>HR ≠ 1 indicates that the event rates are not equal between groups.</p><p>The risk/hazard for an individual in one group differs from the risk/hazard in the other group at a given time interval.</p><p>.</p><p>Lecturer example:</p><p>HR = 0.75 corresponds to approximately 25% lower hazard in the relevant group compared with the reference group.</p>
68
New cards
<p>How is a hazard-ratio confidence interval interpreted?</p>

How is a hazard-ratio confidence interval interpreted?

If the HR confidence interval contains 1.0:

- Conclude there is no statistically significant difference between groups in relation to the hazard.

.

If the CI excludes 1.0:

- The hazard difference may be statistically significant, depending on the analysis.

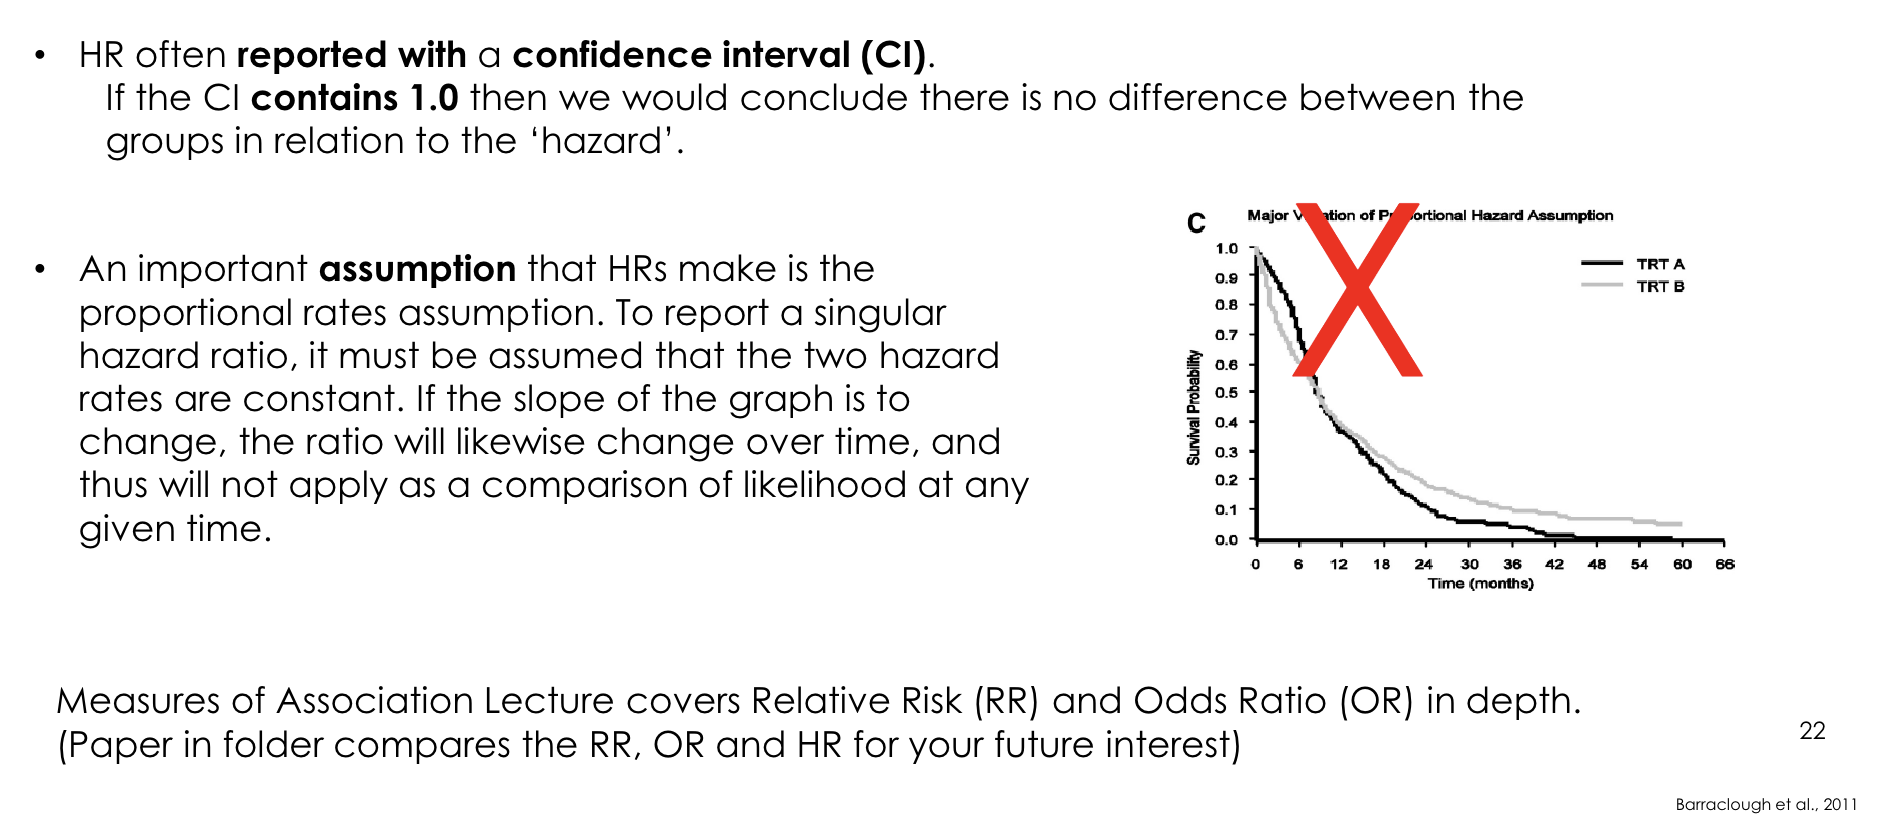
<p>If the HR confidence interval contains 1.0:</p><p>- Conclude there is no statistically significant difference between groups in relation to the hazard.</p><p>.</p><p>If the CI excludes 1.0:</p><p>- The hazard difference may be statistically significant, depending on the analysis.</p>
69
New cards
<p>What is the proportional-rates/proportional-hazards assumption?</p>

What is the proportional-rates/proportional-hazards assumption?

To report one hazard ratio, the relative hazard rates of the two groups must remain sufficiently constant over time.

If the slopes/relative rates change substantially over time, the HR itself changes and one single HR is not an appropriate constant comparison.

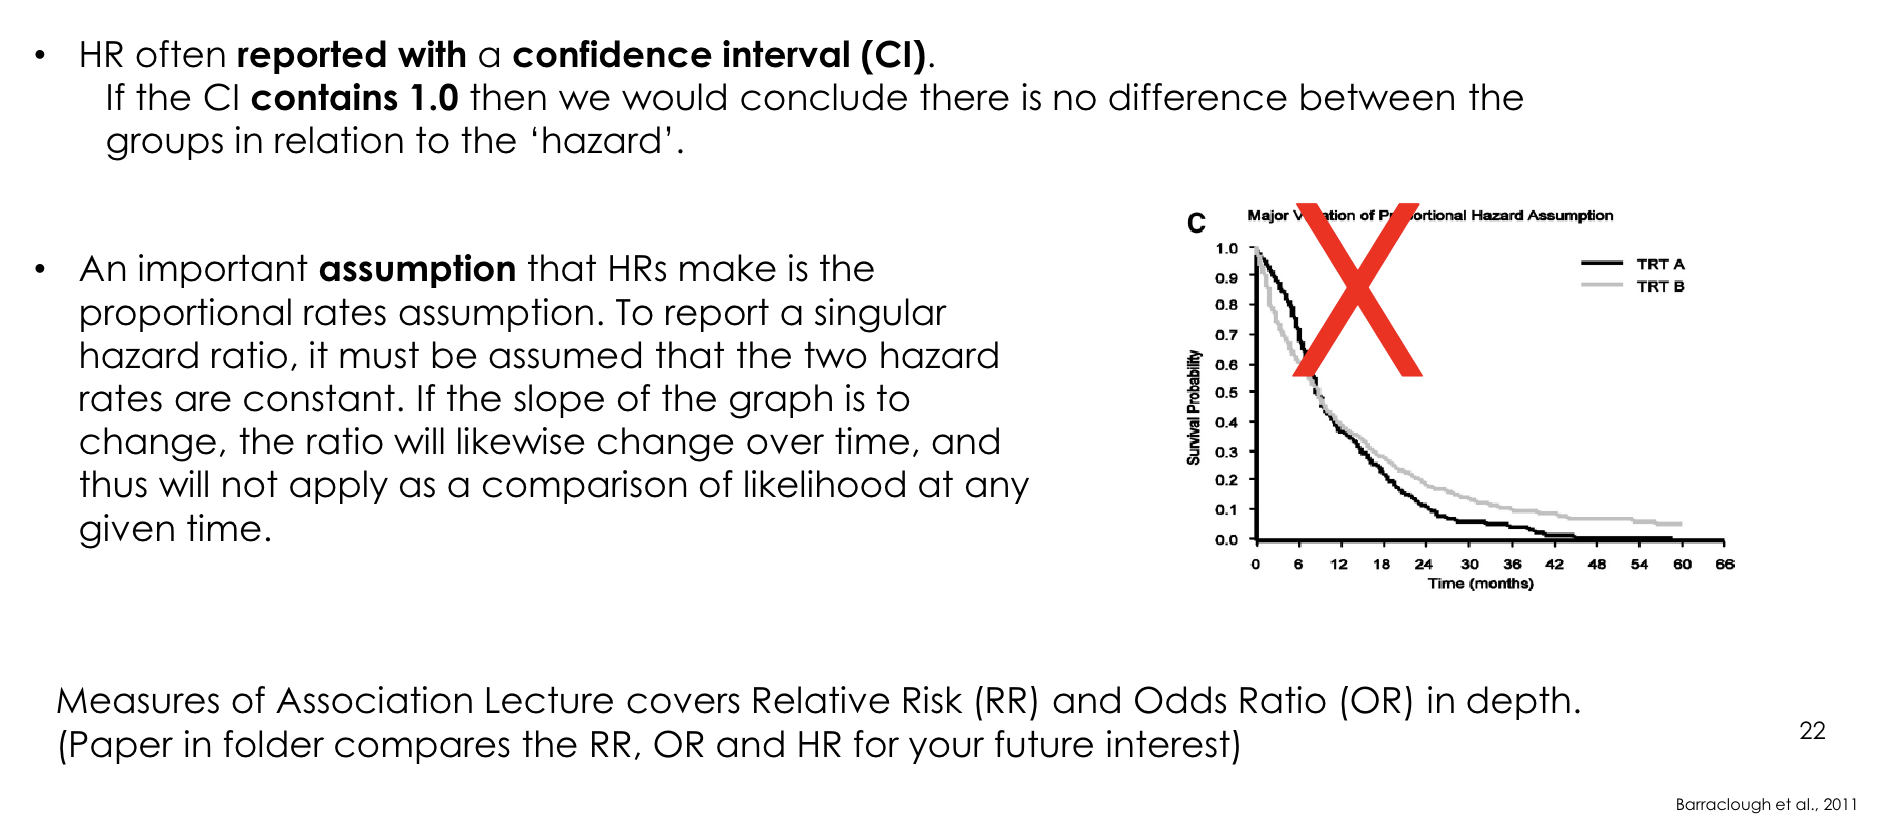
<p>To report one hazard ratio, the relative hazard rates of the two groups must remain sufficiently constant over time.</p><p>If the slopes/relative rates change substantially over time, the HR itself changes and one single HR is not an appropriate constant comparison.</p>
70
New cards
<p>Why are crossing survival curves a problem for a single hazard ratio?</p>

Why are crossing survival curves a problem for a single hazard ratio?

Crossing curves indicate that the relative event rates change over time.

Lecturer explanation:

When the curves cross, the groups are not moving at a consistent relative rate, so a single HR is not an appropriate summary.
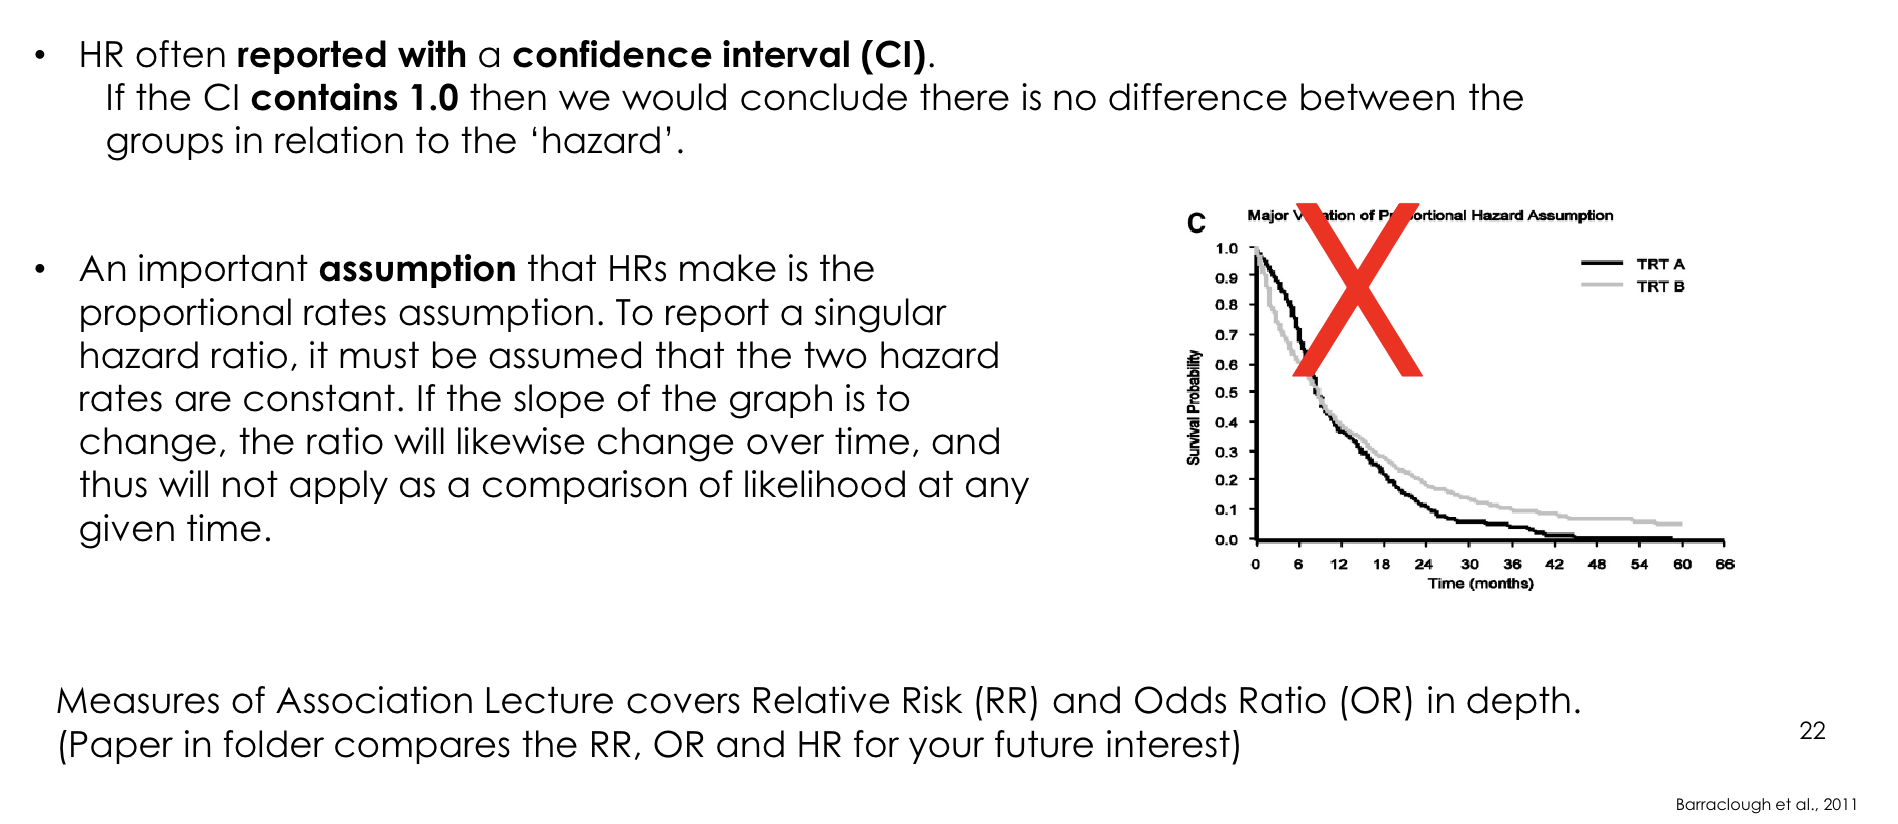
<p>Crossing curves indicate that the relative event rates change over time.</p><p>Lecturer explanation:</p><p>When the curves cross, the groups are not moving at a consistent relative rate, so a single HR is not an appropriate summary.</p>
71
New cards
<p>How should the SGLT-2 inhibitor dementia hazard-ratio example be interpreted?</p>

How should the SGLT-2 inhibitor dementia hazard-ratio example be interpreted?

Study:

Risk of dementia after starting SGLT-2 inhibitors versus DPP-4 inhibitors in adults aged 40-69 years with type 2 diabetes; population-based cohort study (2024).

Result shown:

- HR ≈ 0.65

- 95% CI ≈ 0.58-0.73

- CI excludes 1

.

Interpretation:

SGLT-2 inhibitors were associated with lower dementia hazard.

.

Caution:

The study was observational and prone to residual confounding and informative censoring; effect size may have been overestimated, and randomised trials are needed.

<p>Study:</p><p>Risk of dementia after starting SGLT-2 inhibitors versus DPP-4 inhibitors in adults aged 40-69 years with type 2 diabetes; population-based cohort study (2024).</p><p>Result shown:</p><p>- HR ≈ 0.65</p><p>- 95% CI ≈ 0.58-0.73</p><p>- CI excludes 1</p><p>.</p><p>Interpretation:</p><p>SGLT-2 inhibitors were associated with lower dementia hazard.</p><p>.</p><p>Caution:</p><p>The study was observational and prone to residual confounding and informative censoring; effect size may have been overestimated, and randomised trials are needed.</p>
72
New cards

What additional hazard-ratio example did the lecturer discuss that was not central to the slide set?

The lecturer mentioned a very large observational cohort of more than 606,000 veterans examining diabetes medications and substance-use disorders.

Important context:

- ~94% were male

- Most were white

- Most were elderly

Lecturer explanation:

Even a very large sample may have limited generalisability if its demographic composition is narrow.

73
New cards
<p>What is the correct interpretation of a non-significant result?</p>

What is the correct interpretation of a non-significant result?

A non-significant result is inconclusive.

It means there are insufficient grounds to reject the null hypothesis.

It does NOT prove that the effect does not exist.

<p>A non-significant result is inconclusive.</p><p>It means there are insufficient grounds to reject the null hypothesis.</p><p>It does NOT prove that the effect does not exist.</p>
74
New cards
<p>What does 'absence of evidence is not evidence of absence' mean in null-hypothesis significance testing?</p>

What does 'absence of evidence is not evidence of absence' mean in null-hypothesis significance testing?

Failing to find statistically significant evidence for an effect is not the same as demonstrating that no effect exists.

Lecturer emphasis:

Avoid overly strong conclusions from a single non-significant study.

<p>Failing to find statistically significant evidence for an effect is not the same as demonstrating that no effect exists.</p><p>Lecturer emphasis:</p><p>Avoid overly strong conclusions from a single non-significant study.</p>
75
New cards
<p>Why does statistical significance not necessarily imply clinical significance?</p>

Why does statistical significance not necessarily imply clinical significance?

A result can meet the statistical threshold while having little practical importance for patients.

The lecture links this to concepts such as the minimal important difference.

Lecturer emphasis:

Clinical meaning should be considered alongside p-values.
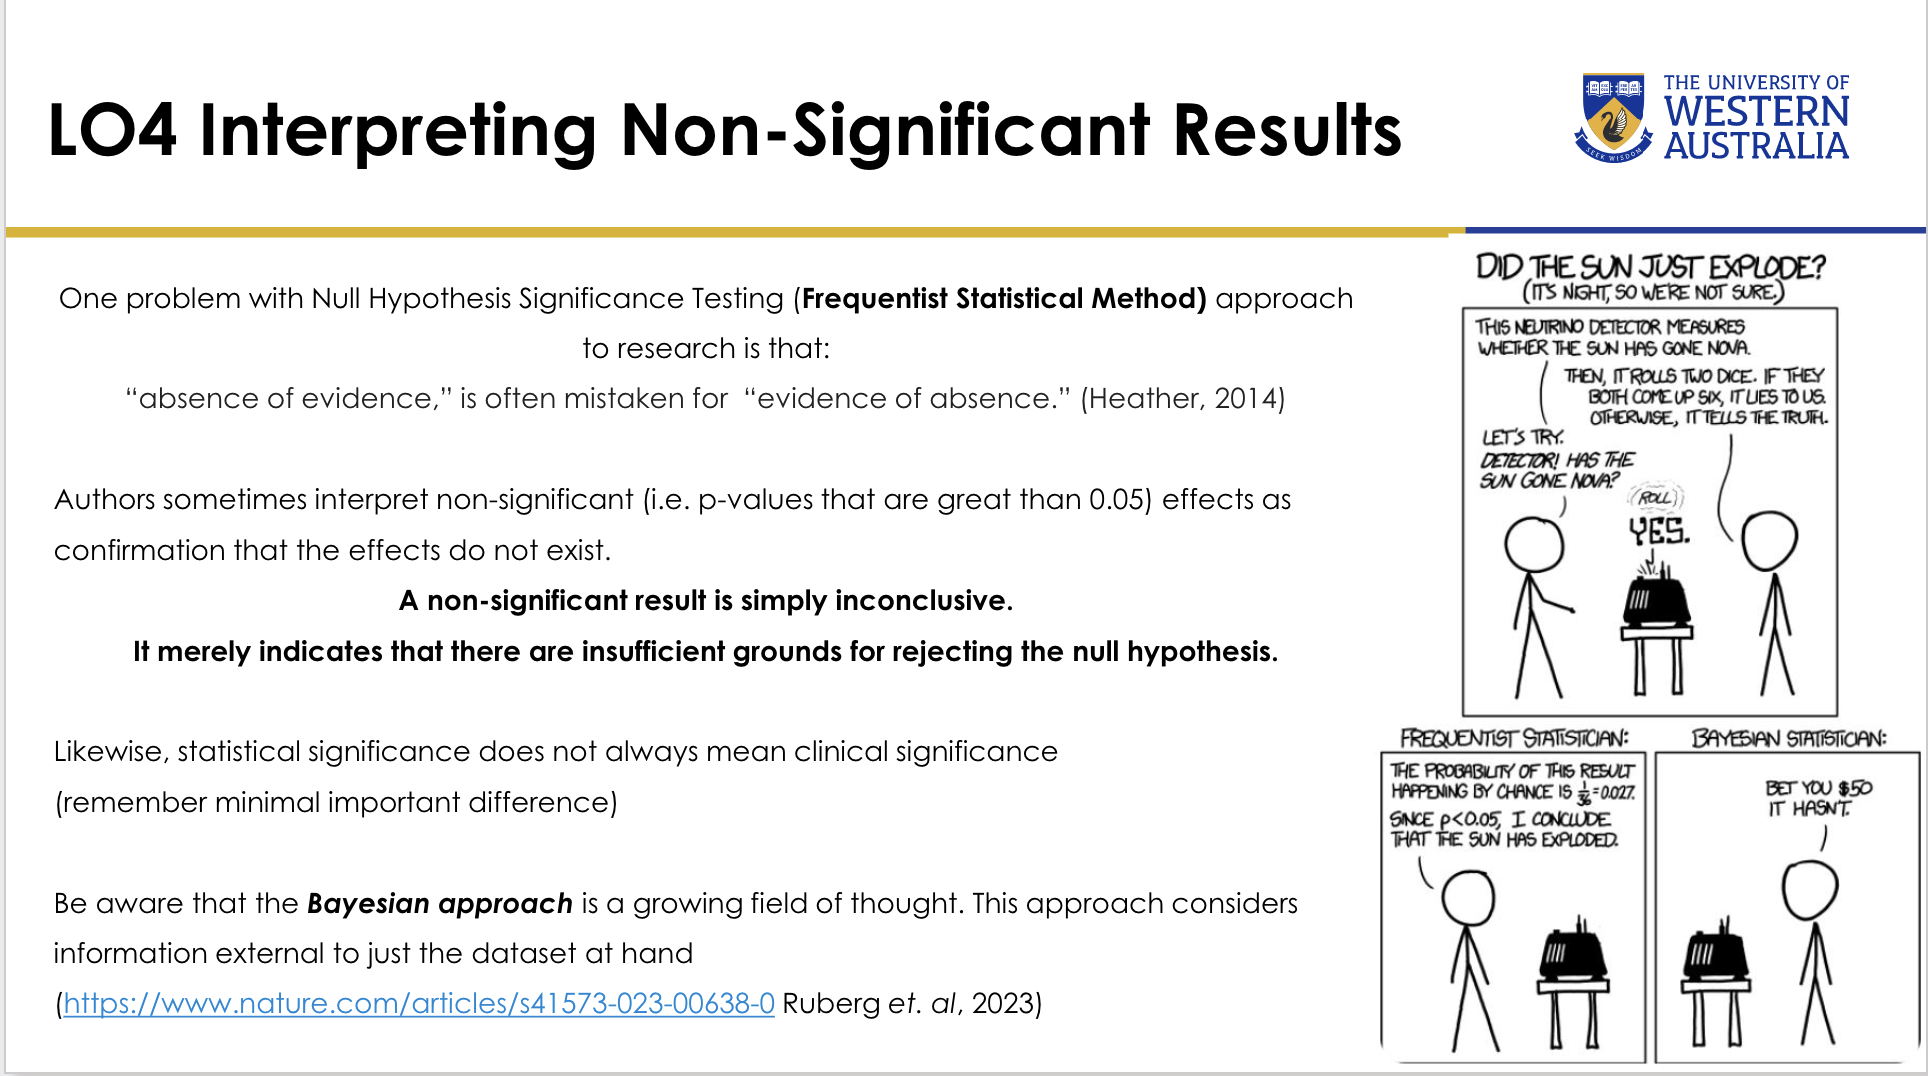
<p>A result can meet the statistical threshold while having little practical importance for patients.</p><p>The lecture links this to concepts such as the minimal important difference.</p><p>Lecturer emphasis:</p><p>Clinical meaning should be considered alongside p-values.</p>
76
New cards
<p>How does the Bayesian approach differ conceptually from the frequentist approach described in the lecture?</p>

How does the Bayesian approach differ conceptually from the frequentist approach described in the lecture?

Frequentist/null-hypothesis significance testing focuses strongly on the observed dataset and hypothesis-testing framework.

The Bayesian approach can incorporate information external to the current dataset.

.

Lecturer explanation:

The broader point was to avoid overly black-and-white interpretation and consider the totality of evidence when making clinically meaningful decisions.

<p>Frequentist/null-hypothesis significance testing focuses strongly on the observed dataset and hypothesis-testing framework.</p><p>The Bayesian approach can incorporate information external to the current dataset.</p><p>.</p><p>Lecturer explanation:</p><p>The broader point was to avoid overly black-and-white interpretation and consider the totality of evidence when making clinically meaningful decisions.</p>
77
New cards
<p>What is a spurious correlation?</p>

What is a spurious correlation?

A spurious correlation is an apparent relationship between two variables that seems causal but is actually:

- Due to chance

OR

- Produced because both variables are related to an unseen confounder.

<p>A spurious correlation is an apparent relationship between two variables that seems causal but is actually:</p><p>- Due to chance</p><p>OR</p><p>- Produced because both variables are related to an unseen confounder.</p>
78
New cards
<p>What do the spurious-correlation examples demonstrate?</p>

What do the spurious-correlation examples demonstrate?

Examples shown include unrelated variables that move together over time, such as:

- Margot Robbie movie appearances vs firefighters in South Dakota

- Google searches/meme popularity

- Margarine consumption vs divorce rate in Maine

.

Key lesson:

Correlation does NOT mean causation.

<p>Examples shown include unrelated variables that move together over time, such as:</p><p>- Margot Robbie movie appearances vs firefighters in South Dakota</p><p>- Google searches/meme popularity</p><p>- Margarine consumption vs divorce rate in Maine</p><p>.</p><p>Key lesson:</p><p>Correlation does NOT mean causation.</p>
79
New cards
<p>Q1. A researcher examines the relationship between daily physical activity and cardiovascular fitness and reports Pearson's correlation coefficient of r = 0.82.</p><p>What is the most appropriate interpretation?</p><p>A. There is a weak positive association between the variables.</p><p>B. There is a strong positive association between the variables.</p><p>C. There is a strong negative association between the variables.</p><p>D. Physical activity causes improved cardiovascular fitness.</p>

Q1. A researcher examines the relationship between daily physical activity and cardiovascular fitness and reports Pearson's correlation coefficient of r = 0.82.

What is the most appropriate interpretation?

A. There is a weak positive association between the variables.

B. There is a strong positive association between the variables.

C. There is a strong negative association between the variables.

D. Physical activity causes improved cardiovascular fitness.

Correct answer:

B. There is a strong positive association between the variables.

Why it is correct:

r = 0.82 falls in the lecture's strong positive range (0.71-0.90).

Why the other options are incorrect:

A. 0.82 is not weak.

C. The coefficient is positive, not negative.

D. Correlation does not establish causation.

<p>Correct answer:</p><p>B. There is a strong positive association between the variables.</p><p>Why it is correct:</p><p>r = 0.82 falls in the lecture's strong positive range (0.71-0.90).</p><p>Why the other options are incorrect:</p><p>A. 0.82 is not weak.</p><p>C. The coefficient is positive, not negative.</p><p>D. Correlation does not establish causation.</p>
80
New cards
<p>Q2. Which situation is most appropriate for using Pearson's correlation coefficient?</p><p>A. One categorical and one continuous variable with a linear relationship and normal distribution</p><p>B. Two ordinal variables with a curvilinear relationship</p><p>C. Two continuous variables with a linear relationship and normal distribution</p><p>D. Two nominal variables.</p>

Q2. Which situation is most appropriate for using Pearson's correlation coefficient?

A. One categorical and one continuous variable with a linear relationship and normal distribution

B. Two ordinal variables with a curvilinear relationship

C. Two continuous variables with a linear relationship and normal distribution

D. Two nominal variables.

Correct answer:

C. Two continuous variables with a linear relationship and normal distribution.

Why it is correct:

These match the assumptions emphasised for Pearson's r.

Why the other options are incorrect:

A. Includes a categorical variable.

B. Ordinal/non-parametric data are more suited to rank-based methods such as Spearman's/Kendall's.

D. Two nominal variables do not fit Pearson's assumptions.

<p>Correct answer:</p><p>C. Two continuous variables with a linear relationship and normal distribution.</p><p>Why it is correct:</p><p>These match the assumptions emphasised for Pearson's r.</p><p>Why the other options are incorrect:</p><p>A. Includes a categorical variable.</p><p>B. Ordinal/non-parametric data are more suited to rank-based methods such as Spearman's/Kendall's.</p><p>D. Two nominal variables do not fit Pearson's assumptions.</p>
81
New cards
<p>Q3. In the regression equation:</p><p>Weight (kg) = 31.979 + 0.2825 × Height (cm)</p><p>What did the coefficient 0.2825 represent?</p><p>A. The weight when height equals zero</p><p>B. The predicted increase in weight for each cm increase in height</p><p>C. The correlation coefficient</p><p>D. The proportion of variability explained</p>

Q3. In the regression equation:

Weight (kg) = 31.979 + 0.2825 × Height (cm)

What did the coefficient 0.2825 represent?

A. The weight when height equals zero

B. The predicted increase in weight for each cm increase in height

C. The correlation coefficient

D. The proportion of variability explained

Correct answer:

B. The predicted increase in weight for each cm increase in height.

.

Why it is correct:

0.2825 is the gradient/slope multiplying the independent variable.

Why the other options are incorrect:

A. 31.979 is the y-intercept.

C. It is not r.

D. Proportion of variability explained is associated with R², not the slope.

<p>Correct answer:</p><p>B. The predicted increase in weight for each cm increase in height.</p><p>.</p><p>Why it is correct:</p><p>0.2825 is the gradient/slope multiplying the independent variable.</p><p>Why the other options are incorrect:</p><p>A. 31.979 is the y-intercept.</p><p>C. It is not r.</p><p>D. Proportion of variability explained is associated with R², not the slope.</p>
82
New cards
<p>Q4. What is the primary purpose of survival analysis?</p><p>A. Assess relationships between categorical variables</p><p>B. Compare means between groups</p><p>C. Estimate population prevalence</p><p>D. Predict the time until an event occurs</p>

Q4. What is the primary purpose of survival analysis?

A. Assess relationships between categorical variables

B. Compare means between groups

C. Estimate population prevalence

D. Predict the time until an event occurs

Correct answer:

D. Predict the time until an event occurs.

.

Why it is correct:

Survival analysis is also called time-to-event analysis.

Why the other options are incorrect:

A. This is not its primary purpose.

B. Comparing means is not the defining goal of survival analysis.

C. Survival analysis does not primarily estimate prevalence.

<p>Correct answer:</p><p>D. Predict the time until an event occurs.</p><p>.</p><p>Why it is correct:</p><p>Survival analysis is also called time-to-event analysis.</p><p>Why the other options are incorrect:</p><p>A. This is not its primary purpose.</p><p>B. Comparing means is not the defining goal of survival analysis.</p><p>C. Survival analysis does not primarily estimate prevalence.</p>
83
New cards
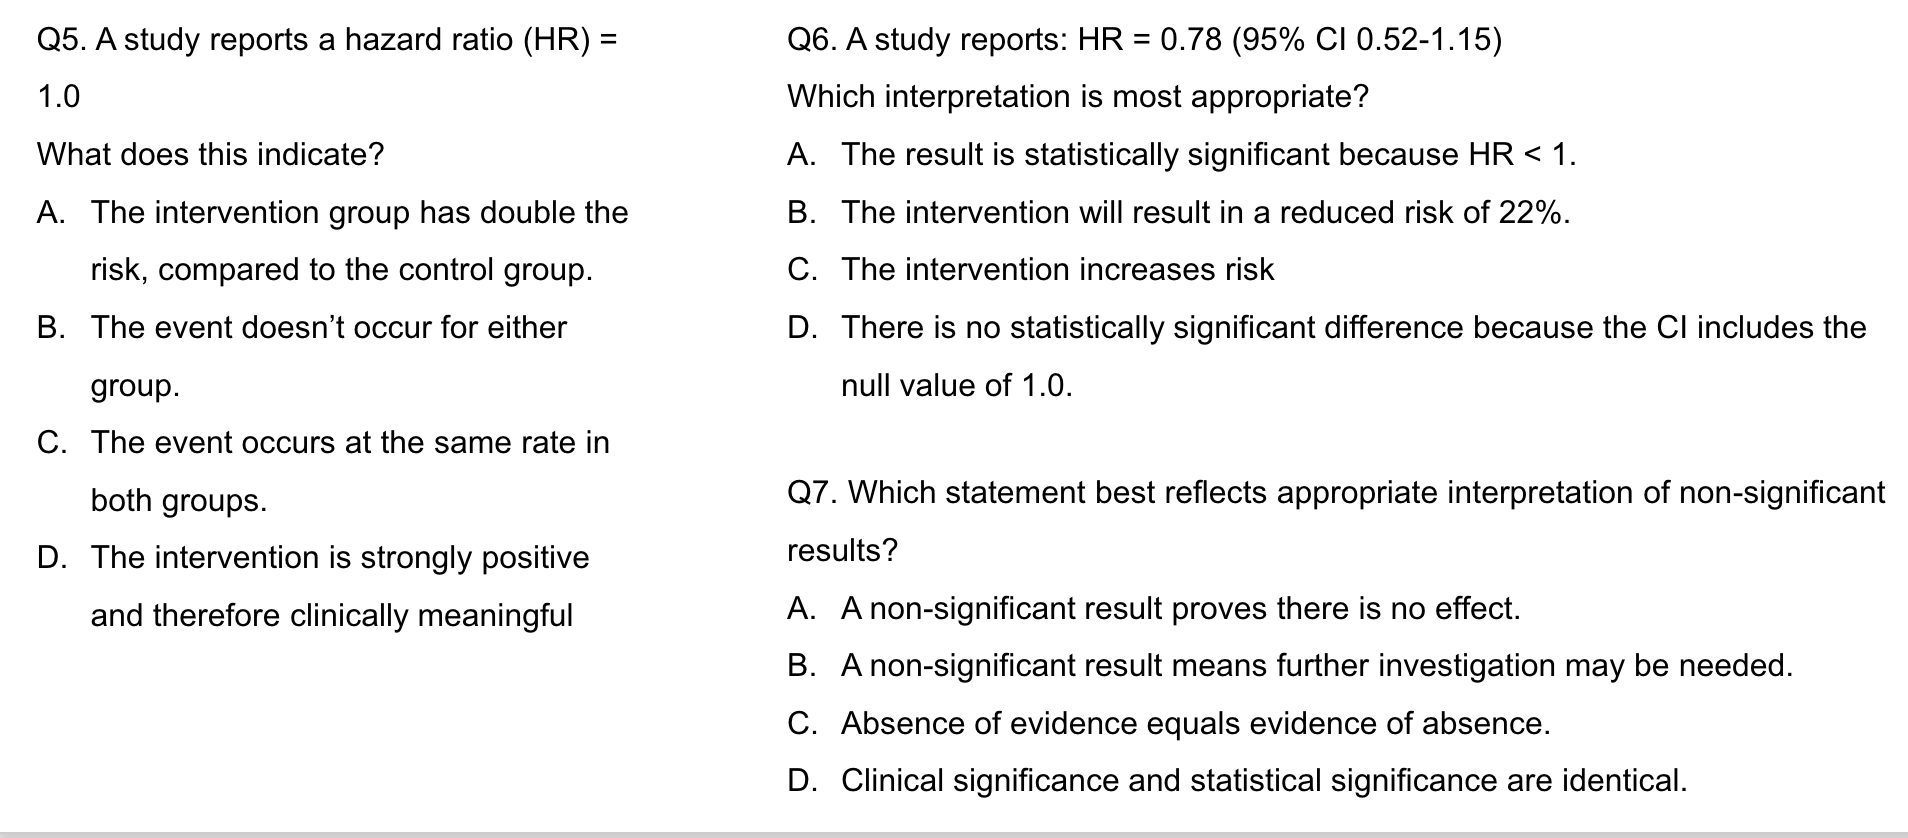
<p>Q5. A study reports a hazard ratio (HR) = 1.0.</p><p>What does this indicate?</p><p>A. The intervention group has double the risk compared to the control group.</p><p>B. The event doesn't occur for either group.</p><p>C. The event occurs at the same rate in both groups.</p><p>D. The intervention is strongly positive and therefore clinically meaningful.</p>

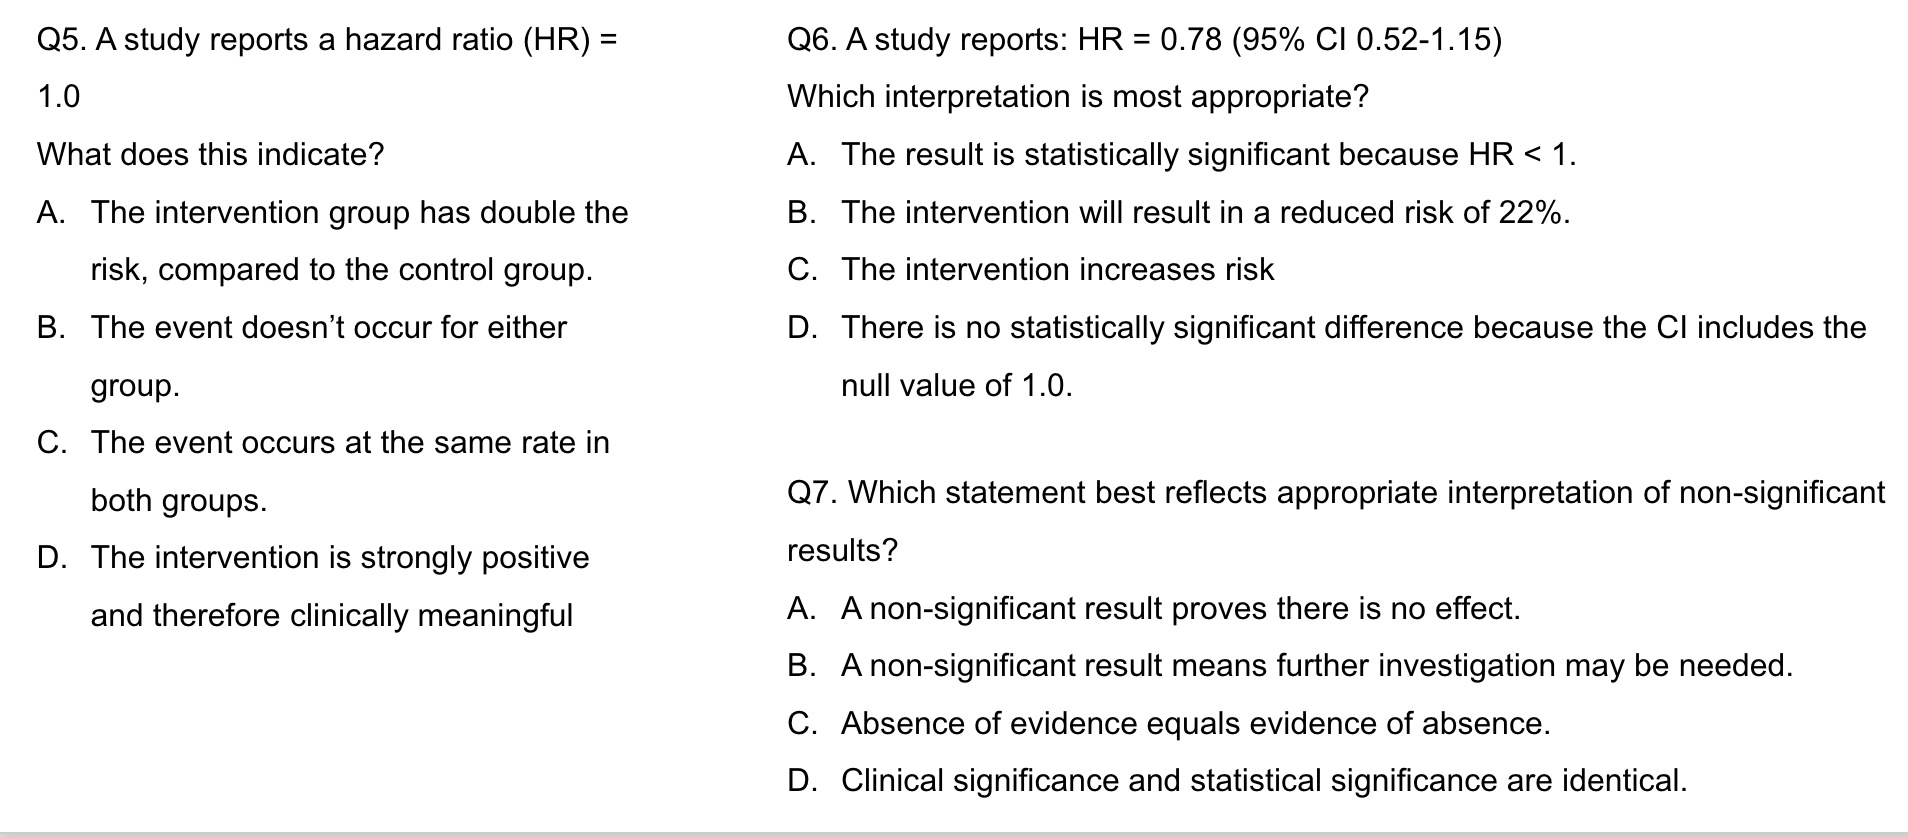
Q5. A study reports a hazard ratio (HR) = 1.0.

What does this indicate?

A. The intervention group has double the risk compared to the control group.

B. The event doesn't occur for either group.

C. The event occurs at the same rate in both groups.

D. The intervention is strongly positive and therefore clinically meaningful.

Correct answer:

C. The event occurs at the same rate in both groups.

.

Why it is correct:

HR = 1 is the null value, indicating equal hazard/event rates.

Why the other options are incorrect:

A. HR = 1 is not double risk.

B. The event may still occur; the rates are simply equal.

D. HR = 1 does not indicate a beneficial effect.

<p>Correct answer:</p><p>C. The event occurs at the same rate in both groups.</p><p>.</p><p>Why it is correct:</p><p>HR = 1 is the null value, indicating equal hazard/event rates.</p><p>Why the other options are incorrect:</p><p>A. HR = 1 is not double risk.</p><p>B. The event may still occur; the rates are simply equal.</p><p>D. HR = 1 does not indicate a beneficial effect.</p>
84
New cards
<p>Q6. A study reports: HR = 0.78 (95% CI 0.52-1.15).</p><p>Which interpretation is most appropriate?</p><p>A. The result is statistically significant because HR &lt; 1.</p><p>B. The intervention will result in a reduced risk of 22%.</p><p>C. The intervention increases risk.</p><p>D. There is no statistically significant difference because the CI includes the null value of 1.0.</p>

Q6. A study reports: HR = 0.78 (95% CI 0.52-1.15).

Which interpretation is most appropriate?

A. The result is statistically significant because HR < 1.

B. The intervention will result in a reduced risk of 22%.

C. The intervention increases risk.

D. There is no statistically significant difference because the CI includes the null value of 1.0.

Correct answer:

D. There is no statistically significant difference because the CI includes the null value of 1.0.

Why it is correct:

The lecture states that an HR confidence interval containing 1.0 indicates no statistically significant difference in hazard.

Why the other options are incorrect:

A. HR < 1 alone is not enough when the CI includes 1.

B. The point estimate suggests lower hazard, but the CI means the result is not statistically significant.

C. HR < 1 does not indicate increased hazard in the relevant group.
<p>Correct answer:</p><p>D. There is no statistically significant difference because the CI includes the null value of 1.0.</p><p>Why it is correct:</p><p>The lecture states that an HR confidence interval containing 1.0 indicates no statistically significant difference in hazard.</p><p>Why the other options are incorrect:</p><p>A. HR &lt; 1 alone is not enough when the CI includes 1.</p><p>B. The point estimate suggests lower hazard, but the CI means the result is not statistically significant.</p><p>C. HR &lt; 1 does not indicate increased hazard in the relevant group.</p>
85
New cards
<p>Q7. Which statement best reflects appropriate interpretation of non-significant results?</p><p>A. A non-significant result proves there is no effect.</p><p>B. A non-significant result means further investigation may be needed.</p><p>C. Absence of evidence equals evidence of absence.</p><p>D. Clinical significance and statistical significance are identical.</p>

Q7. Which statement best reflects appropriate interpretation of non-significant results?

A. A non-significant result proves there is no effect.

B. A non-significant result means further investigation may be needed.

C. Absence of evidence equals evidence of absence.

D. Clinical significance and statistical significance are identical.

Correct answer:

B. A non-significant result means further investigation may be needed.

Why it is correct:

A non-significant result is inconclusive and provides insufficient evidence to reject H0.

Why the other options are incorrect:

A. It does not prove no effect.

C. The lecture explicitly states that absence of evidence is not evidence of absence.

D. Statistical and clinical significance are different concepts.