Chapter 9: Analytical Epidemiologic Research
 Call Kai
 Learn
 Practice Test
 Spaced Repetition
 Match
 Flashcards
 Knowt Play
1/93

There's no tags or description
Looks like no tags are added yet.
94 Terms
What is the literal translation of "epidemiology"
-Literal translation: "Study upon a population"
-Epi = upon
-Demos = people or population
-Logy = study of
Define epidemiology
-the study of our *collective health*
-Study of the *distribution and determinants of health-related states and events* (e.g. morbidity and mortality) in populations.
-Science of public health
What are the two facets of epidemiology?
1) *Descriptive*: the identifying of patterns, trends, and disease and injury differentials
2) *Analytic*: causation or etiology
Flow chart: Classification of Epidemiologic Studies

Although RCTs are considered gold standard, due to limitations such as __________, researchers have to reply on epidemiological study designs to answer certain research questions.
ethical issues
2 major analytic methods used in epidemiologic investigations:
1) Cohort
2) Case control
What is the purpose of epidemiologic investigations?
The purpose of each is to test the hypothesized cause-and-effect relationship between a suspected risk factor and a disease, injury, or even a social condition such as welfare status.
Cohort studies are sometimes called ___________
prospective studies
What are cohort studies?
-Work from a postulated cause to an effect
-General design is to begin with a group of people (a cohort) and observe them over a period of time
-Individuals within the group will *vary in exposure* to one or more of the factors being observed
-Participants are *free of disease*
-*Moves forward* (cause-to-effect), similar to an experimental design.
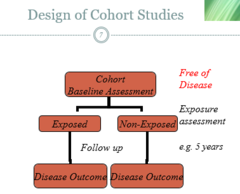
Is there randomization in cohort studies?
NO randomization
Ways to select a cohort
There are several ways to select a cohort, one of which is simply by accessibility; other ways include history of exposure or availability of medical records
What does the researcher determine at the conclusion of a cohort study?
At the conclusion of the study, the researcher compares the two groups for the incidence rate.
Advantages of Cohort Studies
-Researcher can examine disease progression
-Can measure exposure directly (prospective cohort)
-Can look at multiple exposures
-Can assess the relationship between disease and different levels of risk (dose/response)
Disadvantages of cohort studies
-Expensive
-Time-consuming
-Loss to follow-up (bias)
What are case-control studies sometimes referred to as?
retrospective studies
What are case-control studies?
-Start with a group of people who already *have the disease* (health problem) and *compare* them with people *who do not have that disease.*
-People who have the health problem are referred to as "cases", while those in the other group are termed "controls".
-In searching for the "cause", the case-control method determines if the two groups differ in the *degree of exposure* to different factors.
-*Moves backward in time* (effect-to-cause).

A case-control study requires the investigator to work _______________
backwards in time.
Which is much less expensive: case-control or cohort?
case-control studies
Which has fewer subjects: case-control or cohort?
case-control
Sources for case groups can be?
records of physicians and employers, HMO groups, hospital records, death certificates, etc.
Case-control: Where can info be gathered from?
Information can be gathered from *subjects* themselves or even from *proxies* for the subjects or patients.
In many case-control studies, selection of cases is often simple in that the number of sources is very ________
limited.
In control groups, the obvious point is to procure a sample from a population that is what?
at risk for the outcome.
What should the control groups represent?
the general population in terms of probability of exposure to the risk factor(s). They should have had the same opportunity to be exposed.
Advantages of case-control studies
-Good for rare diseases
-Efficient and pretty quick
-Allows for evaluation of a single disease and several factors
Disadvantages of case-control studies
-Susceptible to bias in selection of cases and controls
-Exposure ascertainment
-Can't determine disease incidence rates; can't directly measure disease risk
Timing Schematic for Cohort vs. Case-Control

Ecological Studies
-Unit of analysis (data) is the *group*
-Individual level data are not available
-Group data on exposure is correlated with group data on outcome
-Measure of association is correlation coefficient (r)
correlation coefficient (r)
Quantifies the extent to which there is a linear relationship between exposure and outcome
Breast cancer death rate vs. fish consumption in different countries

r is between ____ and ____
-1 and +1
The stronger the relationship of the two variables, the closer r is to _________
+1 or -1
The weaker the relationship, the closer r is to ____
0
Strengths of ecologic studies
-Low cost and convenience
-Ability to overcome measurement limitations of individual-level studies
-Good for studying ecologic effects
-Simplicity of analysis and presentation
Weaknesses of ecologic studies
-No information on individual level
-Difficult to control for the effects of possible confounding variables (biases)
Levels of Evidence: Level I
Controlled and randomized
Level II-1
Controlled but not randomized
Level II-2
Cohort or case-controlled study
Level II-3
Multiple time series
Level III
Descriptive studies, expert opinions
Analytic epidemiology attempts to establish ___________ between the health problem and selected risk factors.
causation
-Causation may never be fully proven in the experimental sense
-Analytic epidemiology can assess the *likelihood* of causation
These criteria can be of value in determining causation (Important!!): (6 things)
1) Temporal sequence
2) Consistency
3) Strength of association
4) Specificity of effect (ex- no HIV virus --> no AIDS; difficult w/ chronic disease)
5) Biological gradient (similar to strength of association; "why do we think cigarette smoking is related to lung cancer?" "because when you're smoking you inhale smoke into your lungs...")
6) Existing data and theory
Can causation be established from a cohort study?
No
3 principal types of error
1) Bias
2) Random variation
3) Random misclassification
What does bias refer to?
Refers to any error in design, conduct, or analysis of a study that makes the estimate of an exposure's effect on the risk of disease inaccurate.
Bias is a threat to ___________
internal validity
What are the three forms of bias?
1) Selection Bias
2) Information Bias
3) Confounding
Selection Bias
-Poor research design brings about a difference in comparison groups that misrepresents true results
-To prevent this source of error, cohort groups should be homogenous in as many factors as possible, except for the risk factors under investigation.
Information Bias
-Occurs in cohort studies when information about disease outcome is not collected uniformly across groups.
-Prevention is to collect information uniformly
Confounding
Confounding Variables are extraneous variables that are:
(1) risk factors for the health problem under investigation
(2) factors that are associated with the exposure of interest but that are not consequence of exposure.
To be a confounding factor, which conditions must be met? (3)

Example of confounding factor

Intermediary example
Dietary Fat intake --> Cholesterol --> CVDs
**Cholesterol is NOT a confounding factor
Random Variation
-Generally occurs because of *unrepresentativeness* in the comparison groups
-Affects the ability to generalize to a larger population—external validity
-Increasing sample size of study and comparison groups to minimize its effect
Random Misclassification
-Errors can be made when determining a subject's exposure status or disease stats; a subject could be *misclassified.*
-The possibility of finding a strong causal-like relationship between risk factor and health problem is greatly reduced, if not eliminated, in the presence of random misclassification.
Control in Epidemiological Research: Matching
One of the most common methods to reduce error is to match on a subject-to-subject basis.
Control in Epidemiological Research: Homogenous Grouping
Select a sample in which all the subjects would be homogenous on the variable(s) in question.
Control in Epidemiological Research: Stratified Sampling
Similar to homogenous grouping in that subgroups are formed by separating the ranges of selected variables and sampling a predetermined number of cases and controls within cells made from the multiple cross-classification.
Control in Epidemiological Research: Poststratification
Means that you classify unmatched cases and controls by their values on one or more variables determined during the study.
Control in Epidemiological Research: Multivariate Analysis
-Conducted after the data have been collected.
-Research has shown that we can rarely rely on a two-variable study to explain, predict, or control relationships or variables. Instead, we must deal with several variables simultaneously.
Examples of multivariate analysis procedures
-Analysis of Covariance (ANCOVA)
-Multiple Regression Analysis
-Logistic Regression
-Linear Structural Relation Analysis (LISREL)
-Proportional Hazards Regression
What is the purpose of both cohort and case-control studies?
to test the hypothesized cause-effect relationship between a suspected risk factor(s) and a disease, injury, or social/health condition
Prevalence
A measure of the proportion of individuals within a population who have a specific health problem, disease, injury, or other health event *at a particular point in time.*
Formula for prevalence rate

Which type of study usually uses prevalence?
cross-sectional study
Incidence
-A subcategory of prevalence
-It is the number of *new cases* in a population at risk during a *specified time period*.
-Incidence rate is the probability an individual with no prior disease will develop a new case of the disease over some specified time period.
-The formula is sometimes modified to fit the nature of the study
-When subjects contribute unequally to the calculation of population at risk epidemiologists use the idea of "*person-time*" to over-come this dilemma.
-The use of person-years rather than population units should bring greater accuracy to the measurement.
Incidence rate formula

Which type of study usually uses incidence rate?
cohort studies
In cohort studies, investigators measure the strength of the association between exposure and the disease or health outcome by means of the _____________________
risk ratio or relative risk
Define relative risk/risk ratio (RR)
the ratio of the incidence rate for persons exposed to a risk factor to the incidence rate for those not exposed to that same risk factor.
What does RR show?
shows the extent to which it is more (or less) likely that a health problem or condition will occur in the exposed group as compared to the unexposed group
Another rate that can be used in cohort studies is the ___________________________, which is simply the difference between incidence rates.
attributable risk rate
How do you calculate attributable risk rate? What is it also called?
incidence rate for the exposed group minus the incidence rate for the unexposed group.
This rate, also, called the risk difference, indicates the magnitude of the absolute change brought about by exposure.
Define "risk"
The probability or likelihood of an event occurring- the probability that people will acquire a disease
How do you calculate risk?

Smoking and lung cancer: A 10-year cohort study
Calculate the risk of smokers getting lung cancer. Smokers who got lung cancer is 57. Smokers who did not get lung cancer is 4076.
Calculate the risk of non-smokers getting lung cancer. Non-smokers who got lung cancer is 3. Non-smokers who did not get lung cancer is 5436.

RR is a comparison of what?
a comparison of the risk of a certain disease in 2 groups
Formula for RR and example with interpretation

What does RR=1 mean?
RR= 1 means the risk (rate) of disease among the exposed is *no different* from the risk of disease among the non-exposed
What does RR>1 mean?
RR> 1: Exposure *increases risk*
What does RR<1 mean?
RR< 1: Exposure *decreases risk* (protective)
How do you calculate attributable risk rate? Example

Which analysis do you use for case-control investigations?
Odds Ratio- the most common measure of association between exposure and the health outcome in case-control or retrospective investigations
The odds ratio can be seen as an estimate of the _____________
relative risk.
What is the odds ratio? What test is used to test significance?
-the ratio of the odds of disease in exposed individuals relative to the odds of disease in unexposed individuals.
-Interpretation is similar to relative risk in a cohort study
-As with cohort investigations, this formula must be modified if matching has occurred.
-McNemar's test is generally used to test significance.
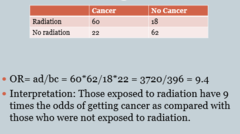
How do you calculate odds ratio?

Example:
RADIATION: Cancer= 60; No cancer= 18
NO RADIATION: Cancer= 22; No cancer= 62
Calculate the odds ratio and interpret the result
What are the two forms of estimation when analyzing results in analytic epidemiology?
1) point estimation
2) interval estimation
What is point estimation? What are examples? What is one problem with it?
-Is a single statistic (or point) to estimate the population parameter.
-*Relative risk and odds ratios* are point estimates.
-The problem with all point estimates is that they fail to convey the accuracy of the estimation.
What is an example of interval estimation? What does it provide?
-Also referred to as a confidence interval
-Provides a range of values within which the population parameter has a specified probability of falling (usually 95% or 99%).
What does it mean if the confidence interval is wide?
The wider the confidence interval, the larger is the variability of the point estimate and the less likely that the point estimate is accurate.
The CIs is used to ascertain [understand] ____________________
statistical significance.
What is available to establish RRs, ORs, and CIs?
Computer programs
How do you know a result is significant when looking at the CI for an OR?
Significant when the CI does NOT include 1