PsychStats 240: Exam 1
 Call Kai
 Learn
 Practice Test
 Spaced Repetition
 Match
 Flashcards
 Knowt Play
1/34

There's no tags or description
Looks like no tags are added yet.
35 Terms
stats branches
descriptive and inferential
population
the group youre studying
sample
the group of people you take from the pop.
how to get a random sample
you can # everyone and randomly generate a group
sample of convenience
members of a pop. that you easily have access to as long as it’s representative of the pop.
descriptive stats vs inferential stats
summarizing data vs drawing inferences from the pop.
continuous vs discrete numerical/quantitative variables
Continuous: any #, can be decimals (ex: weight)
Discrete: only whole #s (ex: number of siblings you have)
Ordinal Scale
-order of valuess - he variables are in order, the differences between them have no intrinsic meaning (ex: a self reporting scale a satisfaction from 1-5, two people rating their sat. a 4 might have different interpretations of what that means)
Interval scale
- interval between values- ordered and equal intervals, no true 0 (ex: temperature, 0F/C does not mean there is an absence of temp)
Ratio scale
-ratio of values- t has a true 0! (ex: money, you can have no money) the ratio between quantities is interpretable, you can have 2x as much $$ but not 2x as much temp or IQ
contingency table
a two-way table that shows the distribution of two categorical V
why aren’t pie charts helpful?
they just show the % instead of actual amount
histogram
no space between bars, if it looks like your right foot it’s right skewed
one hump: unimodal
two: bimodal
none: uniform/rectangle
mean formula:
x(w bar=mean) = x1+x2+…../xn OR mean=1/nExi (the sum of all x’s divided by the number)
variance
the spread of variables around the mean
S2= (x1-mean)2+…./n-1 or S2= 1/n-1E(xi-mean)2
squaring makes it positive
SD
average distance of a variable from the mean

skews influence:
the mean, but not the median
IQR
range from Q1 to Q3
Whiskers
extend to max and min unless there are values more than 1.5x the IQR
boxplots are helpful for
comparing 2+ distributions
dominant view/frequentist view
the prob of a probability occuring exactly only happens over a large amount of trails (ex: flipping a coin heads 50% of the time would take hundreds of flips)
probability
cant be less than 0 or greater than 1, the sum of the prob of various possible events that can happen must =1
probability distribution
instead of logging the actual time each value occurs, you log the probability of it occurring
discrete distributions
the outcomes are defineable and have a limited number of possibilities ex( the # of jean types i can wear- theres only so many)
continuous distributions
no 1 value of this variable will have any probability assigned to it, instead we assign the gap between two probs ex( the probability of women between 5’1 and 5’2)
Continous distributions use what graph/function
PDF probability density function - density curve
Measures the gaps between two values
the area underneath is 1, the y’s must adjust to the x’s to make the area 1.
Binomial distributions
probability of the # of times an event happens in n trials, if the event has a fixed probability on each trial (that’s why they’re often ALMOST normal distributions)
ex: coin flips: p(heads)=.5, n+100
a success in stats is
when what were studying happens (ex: flipping heads)
how to get the probability of smth with multiplication
if p(make)=.7 and you want to know the prob of making 8/10 shots multiply
.7 (8times) + .3 (2 times)
Normal Distribution
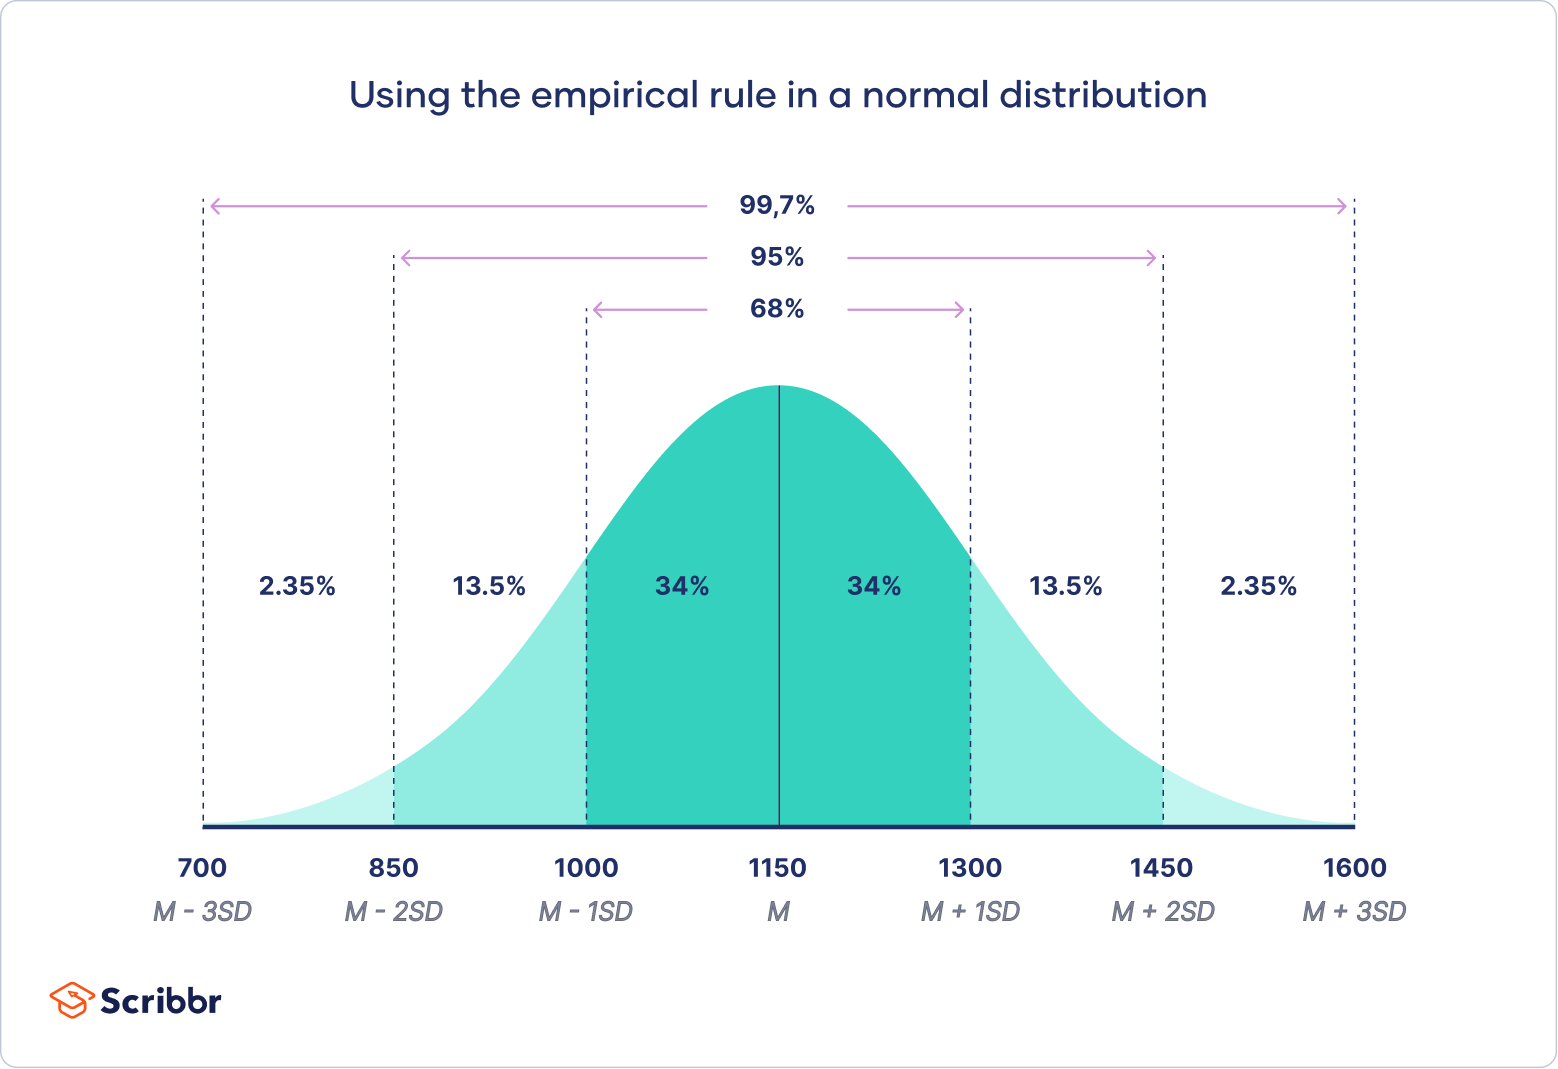
continuous, unimodal, symmetrical
N(u,o) mean and sd
Kertosis is
when the graph is too humpy or peaky , not spread out right
many real world variables are
normally distributed
z-score formula and the value formula:
z= (value-mean)/SD, use z-score to find prob/percentile
x= ZxSD+mean
to know whats to the right of a variable
do 1-the prob
to get the prob between two variables
get the prob of two and subtract the smaller one from the bigger