Biostats Midterm
 Call Kai
 Learn
 Practice Test
 Spaced Repetition
 Match
 Flashcards
 Knowt Play
1/34

There's no tags or description
Looks like no tags are added yet.
35 Terms
parameters
is a numerical value that describes a characteristic of an entire population.
what we are interested in measuring
estimate
our best guess at a parameter within a sample
ex. averages, %s, proportions, counts
null hypothesis
the “no difference” hypothesis
sampling error
the chance difference between an estimate and the population parameter being estimated
precision
do you get the same/similar measurements each time you sample
bias
systematic discrepancy between estimates and the true population characteristic
accuracy
are you measuring what you actually want to measure
random sampling
each unit has an equal and independent chance of being included
sample of convenience
collection of easily available individuals
undesirable, avoid if possible
volunteer bias
Volunteers are not representative people
intereseted in topic
more willing to be subjected to treatment
financial rewards\
have more time (limits demographic)
categorical variables
describe membership in a group
ex. languages, experimental vs control, sex chromosomes, colour, rank etc.
nominal
Type of categorical variables
No inherent order
ex. colour, group, chromosomes
Ordinal
type of categorical variable
groups can be ordered in a meaningful way
ex. age, size, status
numerical variables
measurements are quantitative
ex. body temp, height, age etc.
continuous data
any value within a reasonable range
no negative numbers typically
discrete
indivisible units
tends to be integers
ex. cant have ½ a human
probability distribution
show the distribution of a variable in the whole population
theoretical distributions approximate real life frequency distributions
frequency
number of observations having a particular value (count)
frequency distribution
how often each value of the variable occurs in the sample
experimental pros
control over sample
helpful for causation
experimental con
can be unrealistic / unrepresentative or unethical
observational pro
representative of sample/ true population
observational con
cant control sample
difficult to prove causation
relative frequency
proportion of observations
proportions of different categories sum to 1
categorical data graphs
bar graphs
must start at 0
numerical data graphs
histogram
frequency tables
histogram
uses the area of rectangular bars to display the frequency distribution or relative frequency distribution of a numerical value
abundance interval
a bin that groups samples into categories of abundance
uniform histogram

bell shaped histogram

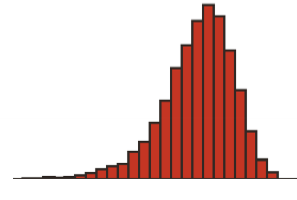
asymmetric (skewed)
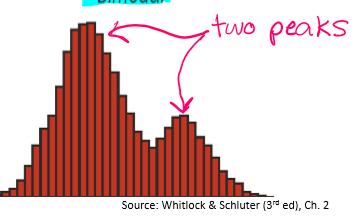
bimodal histogram
left skewed

right skewed
