63 - Scientific Inference
 Call Kai
 Learn
 Practice Test
 Spaced Repetition
 Match
 Flashcards
 Knowt Play
1/64

There's no tags or description
Looks like no tags are added yet.
65 Terms
What are the Three Steps of the Scientific Process?
Observation
Hypothesis testing
Inference

What is Scientific Inference?
Drawing conclusions about unobserved phenomena using observed evidence

Why do we use Statistics in Scientific Inference?
To estimate unknown population parameters and quantify uncertainty

What is a Population Parameter?
The true, usually unknown value of a characteristic in the population
What is the Difference between an Estimate and a Parameter?
Estimate comes from sample data
Parameter is the true population value

How are Scientific Inference and Statistical Inference Related?
Statistical inference is a subset of scientific inference
Hypothesis testing is part of statistical inference

Why must we Quantify Uncertainty in Hypothesis Testing?
Because sample estimates may differ from the true population values

What is the Null Hypothesis (H₀)?
An assumption of no difference or association between groups

What is the Purpose of Hypothesis Testing?
To assess how plausible the observed data are if H₀ is true
What are the Two Possible Decisions Regarding H₀?
Reject H₀ or fail to reject H₀
Why do we Not Accept H₀ when results are Nonsignificant?
Failing to reject H₀ does not prove it is true
What is a P-value?
The probability of obtaining the observed result or a more extreme result, assuming H₀ is true

What does a Low P-value indicate?
The observed data are unlikely under H₀ → providing evidence against it
What does P ≤ 0.05 typically indicate?
A statistically significant result at α = 0.05
Reject H₀

What does P > 0.05 typically indicate?
A statistically nonsignificant result
Fail to reject H₀

What does Statistical Significance Mean?
The evidence against H₀ meets the predetermined significance threshold
What was the Observed Difference in the NSAID Study?
Among 40 arthritic dogs, the NSAID group improved 8 pain-score points more than placebo
What does P = 0.03 mean in the NSAID Study?
If the drug had no effect, a result at least this extreme would occur in about 3% of comparable studies
It does not mean:
A 3% chance the drug is useless
A 97% chance the drug works
The effect is big enough to matter
Why is the Null Distribution Centered at Zero?
Because H₀ assumes no difference between treatment groups
Does P = 0.03 mean there is a 3% Chance the Drug is Ineffective?
No
A p-value does not tell us the probability that H₀ is true
Does a Small P-value Demonstrate a Clinically Important Effect?
No
Statistical significance does not establish clinical importance
What is the Significance Level (α)?
A predetermined cutoff used to decide whether to reject H₀

What does α = 0.05 represent?
A 5% probability of a Type I error when H₀ is true
What does α = 0.001 represent?
A 0.1% probability of a Type I error when H₀ is true
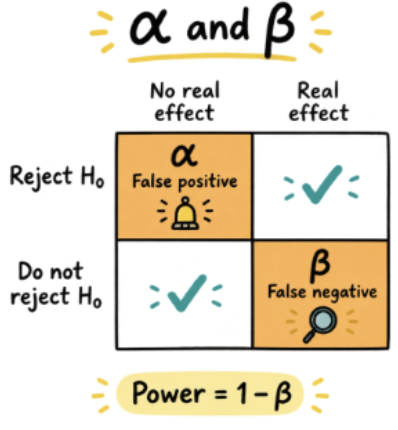
What is a Type I Error?
A false positive: rejecting H₀ when H₀ is true
What is the Difference between Statistical and Clinical Significance?
Statistical significance concerns evidence against H₀
Clinical significance concerns practical importance
What Two Questions should we ask about a Study Result?
Is it statistically significant?
Is the effect clinically meaningful?
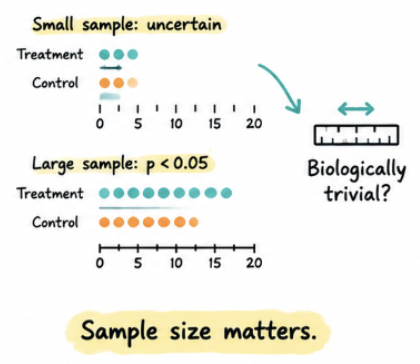
How can Sample Size Affect Statistical Significance?
Large samples may detect very small effects
Small samples may miss real effects
Why is 'No Difference' Incorrect for P = 0.15?
A nonsignificant result does not prove that the groups are equivalent
How should a Study Result with P = 0.15 be Reported?
No statistically significant difference was found between the groups
What is a Confidence Interval (CI)?
An interval estimate expressing uncertainty about a population parameter

What does a 95% Confidence Interval Mean?
Across repeated samples, 95% of intervals made using this method would contain the true parameter
What is the Relationship between Confidence Level and α?
Confidence level = 1 − α; α = 0.05 corresponds to 95% confidence
What Changes with Repeated Sampling: the CI or the True Parameter?
The confidence interval changes
The true population parameter remains fixed
What does a Wider Confidence Interval indicate?
Greater uncertainty and lower precision in the estimate
What does a Narrower Confidence Interval indicate?
Less uncertainty and greater precision in the estimate
What is a Type II Error?
A false negative: failing to reject H₀ when a real effect exists

What is Statistical Power?
The probability of detecting a true effect
Power = 1 − β
What are the Main Steps of Statistical Inference?
Estimate the effect
Quantify uncertainty
Test H₀
Interpret p-values and CIs
Consider errors
What is a Cohort Study?
FOLLOWING exposed AND unexposed animals over time to measure new disease occurrence
What is a Case-Control Study?
SELECTING diseased cases AND nondiseased controls, then comparing previous exposure
What does a Cohort Study Directly Estimate?
Disease incidence or risk in exposed and unexposed groups
What does a Case-Control Study Compare?
The odds of exposure in cases versus controls
What is the Risk Ratio (RR) Formula?
RR =
Risk in exposed animals
÷
Risk in unexposed animals

What is the Odds Ratio (OR) Formula?
OR =
Odds of exposure in cases
÷
Odds of exposure in controls

What is the 2 × 2 Table Formula for an Odds Ratio?
OR = (A × D)/(B × C)
A/B are exposed/unexposed cases
C/D are exposed/unexposed controls.

Why can't Case-Control Studies Directly Calculate Disease Risk?
Researchers predetermine case and control numbers → so population incidence cannot be calculated directly
When can the Odds Ratio Approximate the Risk Ratio?
When the disease is rare
Incidence below 5% as a rule of thumb


How is the Leptospirosis Odds Ratio Calculated?
OR = (60 × 70)/(40 × 30)
= 3.5

What does OR = 3.5 Mean in the Leptospirosis Study?
The odds of puddle exposure were 3.5 times higher among leptospirosis cases than controls
Why is '3.5 Times the Risk' Incorrect for This Study?
Case-control sampling provides an odds ratio, not a direct risk ratio
What is the Main Purpose of Case-Control Studies for Rare Diseases?
To efficiently examine exposure associations without following a large population over time
How do Case-Control Studies Select Participants?
Researchers predetermine cases and controls based on disease status
What can Cohort Studies Estimate Besides Risk Ratios?
Incidence odds ratios, using the disease odds in exposed and unexposed groups

Why must the Null Hypothesis be Carefully Constructed?
It must clearly specify the exposure, outcome, and association being tested
What is an Appropriate Null Hypothesis for the Puddle Study?
“Rainwater puddle exposure does not increase the odds of leptospirosis in dogs”
Why is a P-value Not an Effect Measure?
It measures compatibility with H₀ → not the magnitude of an effect or association
Why should Cases and Controls be Comparable?
To reduce differences unrelated to the exposure being investigated
What are the Key Practical Limitations of Case-Control Studies?
They cannot directly estimate absolute risk
Odds differ from probabilities
Adequate statistical power is important
Hypothesis Testing and P-value Interpretation SUMMARY
Concept | Meaning | Interpretation |
Null hypothesis (H₀) | No difference or association | Assumed true during testing |
P-value | Probability of observed or more extreme results if H₀ is true | Measures evidence against H₀ |
P ≤ 0.05 | Statistically significant | Reject H₀ |
P > 0.05 | Not statistically significant | Fail to reject H₀ |
α (alpha) | Significance threshold | Commonly 0.05 |
Statistical significance | Evidence against H₀ | Does not guarantee clinical importance |
Clinical significance | Effect matters clinically | Consider effect size and practical relevance |
Remember: Failing to reject H₀ does not mean H₀ is true
Type I vs. Type II Errors SUMMARY
Feature | Type I Error | Type II Error |
Meaning | False positive | False negative |
Mistake | Reject a true H₀ | Fail to reject a false H₀ |
Reality | No real effect | Real effect exists |
Symbol | α | β |
Example | Conclude treatment works when it doesn't | Fail to detect an effective treatment |
Related concept | Significance level | Power = 1 − β |
Remember:
Type I = False alarm
Type II = Missed effect
P-values vs. Confidence Intervals SUMMARY
Feature | P-value | Confidence Interval (CI) |
Purpose | Tests evidence against H₀ | Quantifies uncertainty |
Main question | How surprising are the data if H₀ is true? | What range of values is compatible with the data? |
Example | P = 0.03 | 95% CI |
Interpretation | Smaller p-value = stronger evidence against H₀ | Narrower CI = greater precision |
Measures effect size? | No | Provides a range for the effect size |
Important point | Does not prove clinical importance | Reflects uncertainty around an estimate |
Remember:
P-value = evidence against H₀
CI = estimate precision and uncertainty
Cohort vs. Case-Control Studies SUMMARY
Feature | Cohort Study | Case-Control Study |
Groups selected by | Exposure status | Disease status |
Groups | Exposed vs. unexposed | Cases vs. controls |
Measures | Disease incidence/risk | Odds of exposure |
Main ratio | Risk ratio (RR) | Odds ratio (OR) |
Directly calculates disease risk? | Yes | No |
Useful for rare diseases? | Less practical | Yes |
Direction | Exposure → disease | Disease → previous exposure |
Remember:
Cohort = RR
Case-control = OR
Odds Ratio Formulas and Interpretation SUMMARY
Concept | Formula / Interpretation |
Risk ratio (RR) | Risk in exposed ÷ Risk in unexposed |
Odds ratio (OR) | Odds of exposure in cases ÷ Odds of exposure in controls |
OR calculation | (A × D) ÷ (B × C) |
OR = 1 | No association |
OR > 1 | Positive association |
OR < 1 | Negative association |
OR ≈ RR | When disease is rare (lecture rule: incidence below 5%) |

Leptospirosis example: How to Calculate Odds Ratio SUMMARY

Correct interpretation: “Dogs with leptospirosis had 3.5 times the odds of rainwater puddle exposure compared with controls.”
Incorrect: “Dogs exposed to puddles had 3.5 times the risk of leptospirosis.”