Fertility monitoring
 Call Kai
 Learn
 Practice Test
 Spaced Repetition
 Match
 Flashcards
 Knowt Play
1/29

There's no tags or description
Looks like no tags are added yet.
30 Terms
What is measured when monitoring fertility?
Calving interval
Preg rate
Look for which groups within herd have poor performance
What is the role of key performance indictors (KPIs)?
demonstrate efficiency to stay in business
show good animal health & welfare
What are the general categories of KPIs?
Conception
Submission
Overall fertility
use industry agreed measures
What are the requirements of a good KPI?
Level
high level e.g. milk/cow/yr of life
low level e.g. preg of individual animal
Convenience vs cost of producing data
What is the minimum data available when monitoring fertility?
Legally required farm records
e.g. movement licences
Data from product purchase
no. sold, dead weight, carcass grade, milk sales & composition
Data from supplier
feed input —> feed rate
AI straw sales & med usage
vet cost
What are the on farm recording systems?
Farm diary & computer packages
Milk recording companies
Vet computer packages
What needs to be assessed when visiting a farm?
Animals —> BCS, type of cow, cleanliness
Building / environ
People —> capabilities, motivation, needs from you
What is this showing?
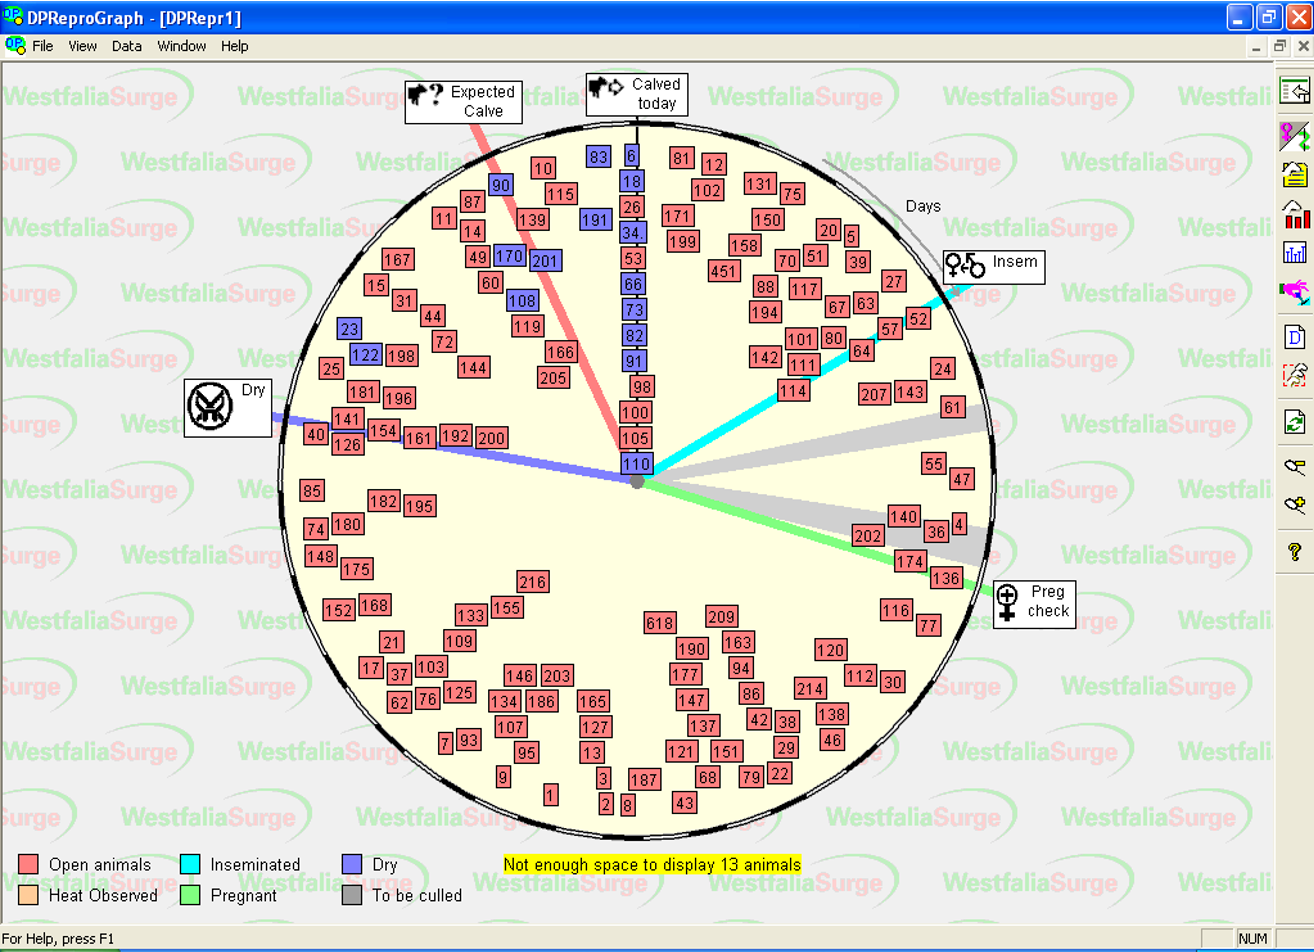
Bray chart —> 1 round shows 1 lactation
Can set targets & see if meeting
Can get linear ones too:
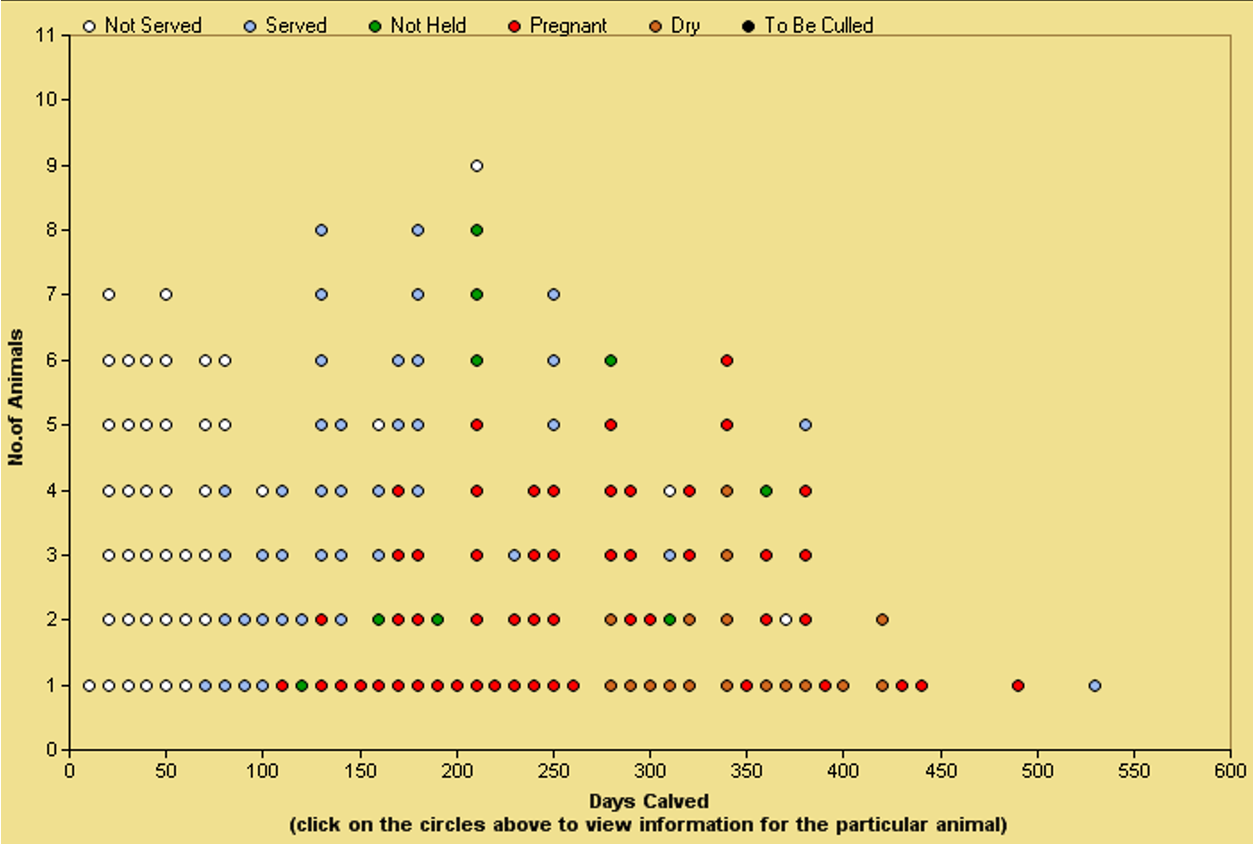
How can you monitor fertility in terms of submission?
Submission rate
No. animals served/ No. Eligible/ 3 week cycle
1st service submission rate
Eligible = All animals after earliest service date who have not yet been served
All services submission rate
Eligible = All animals after earliest service date who are not pregnant
May have been served so do not know if were eligible until return to heat or PD results
What KPI is this graph showing
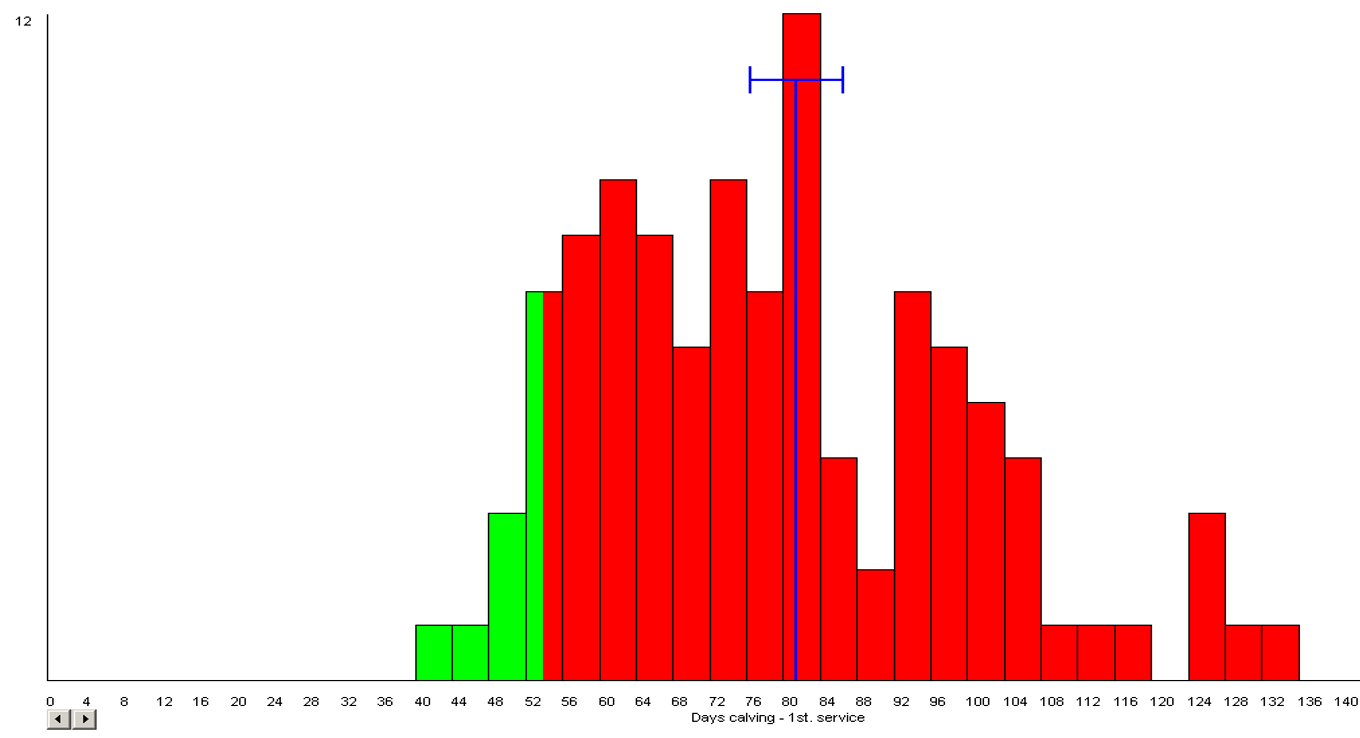
Calving to 1st service for cows calving in a period
Voluntary waiting period ~50d
Can see outliers which are not on average
What KPI can you use to monitor how long it takes to conceive?
Calving interval for individual —> calving index for herd
Too historic
Calving to conception interval —> produce predicted calving index
A few problem cows can affect this interval a lot —> gets worse as animals in group conceive over time
do not try to improve by serving all group earlier
Calving to conception spread
If conception too early there will be a delay in drying off
If conception too late there will be delay in next peak lactation, less milk/cow/year
Explain the following graphs:

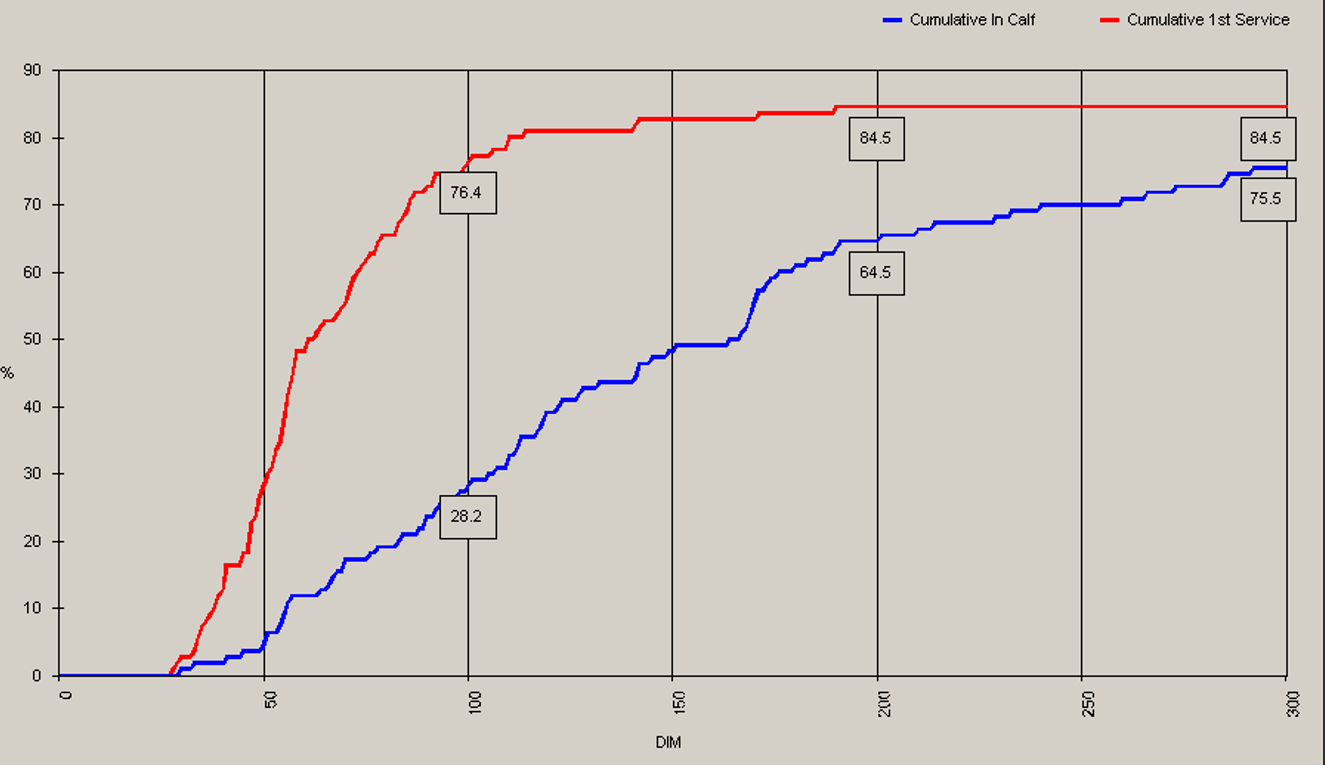
Blue line —> cows in calf over time
Red line —> cows that have had their first service
(The blue line then going up is also including other services)
What is this graph showing?
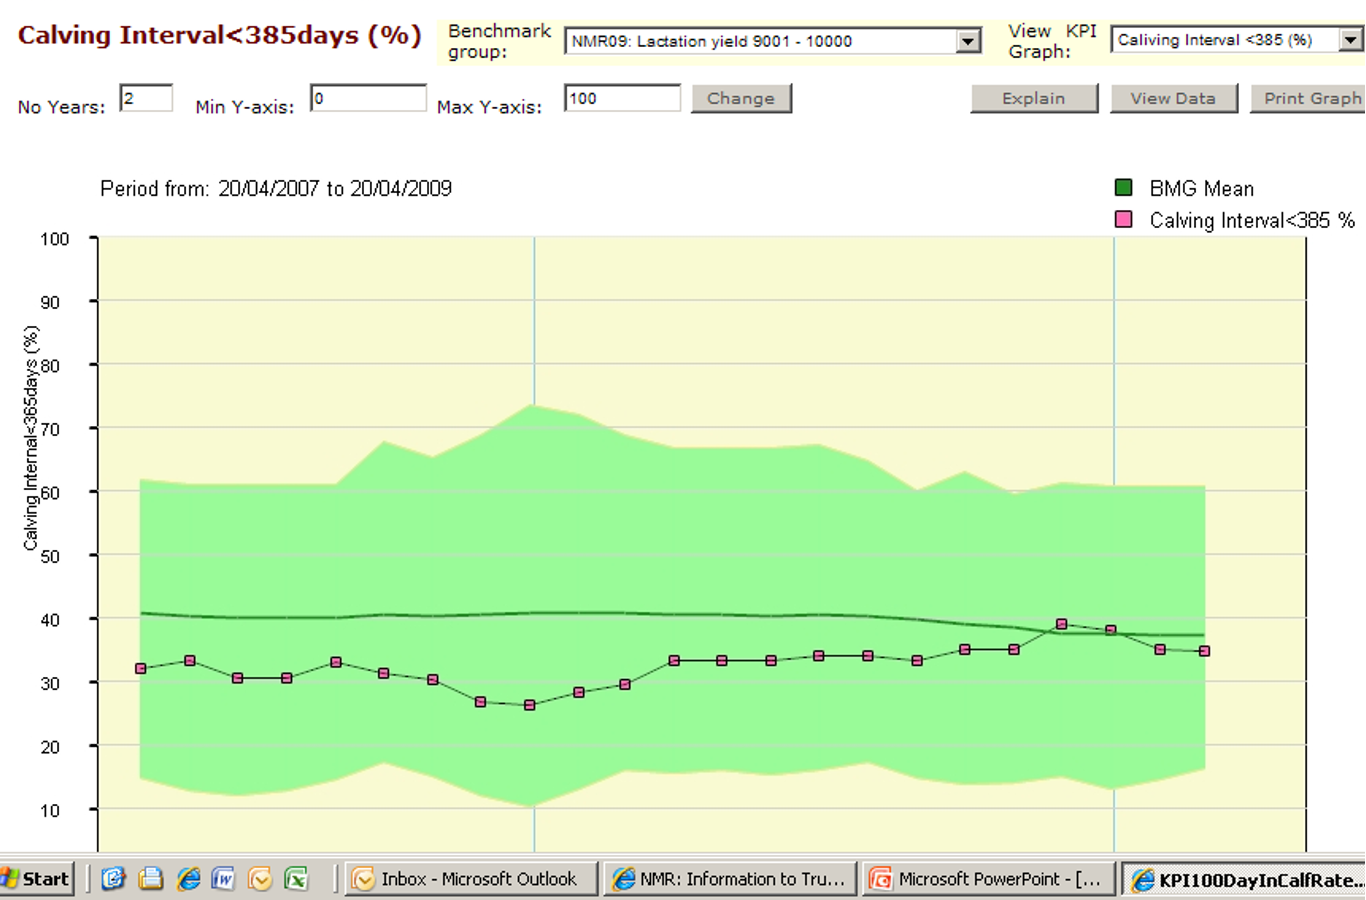
Green area is showing % spread of calving interval under 385 across different farms
Pink is the farm you are looking at —> can compare to other farms
What is preg rate?
No. Preg/ No. eligible to be served/ 3 week
Combines conception (conception= pregnancy rate) w/ service) —> % preg of those served
PD early —> detect empty cows but some loss later
Summarise the physiological events occurring after insemination in cattle —> approx timings
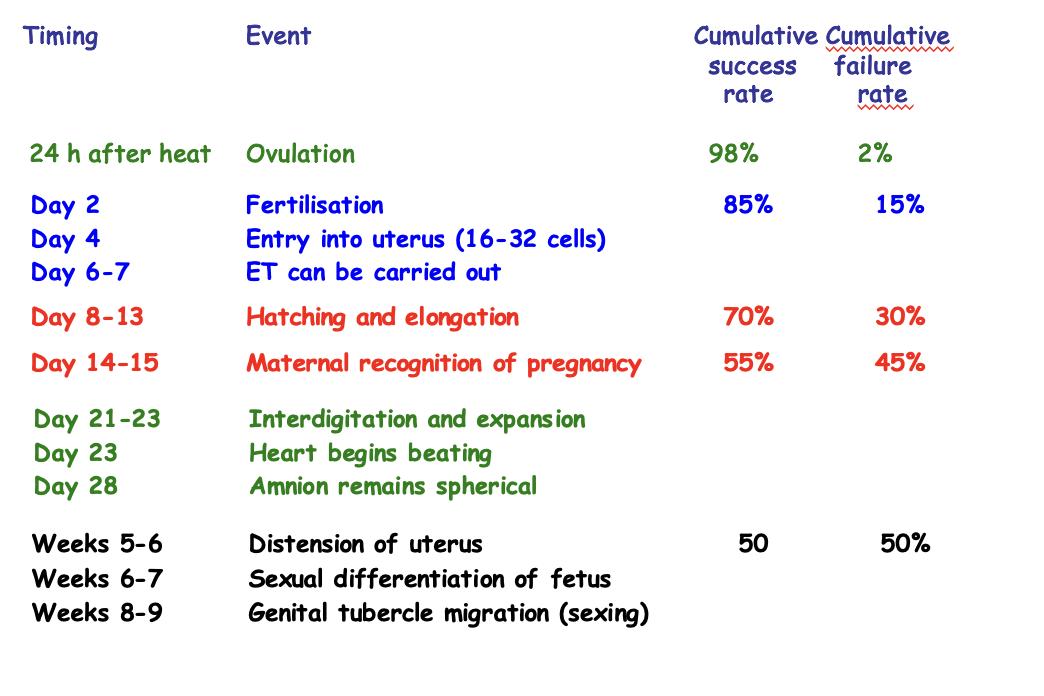
What is this chart showing?
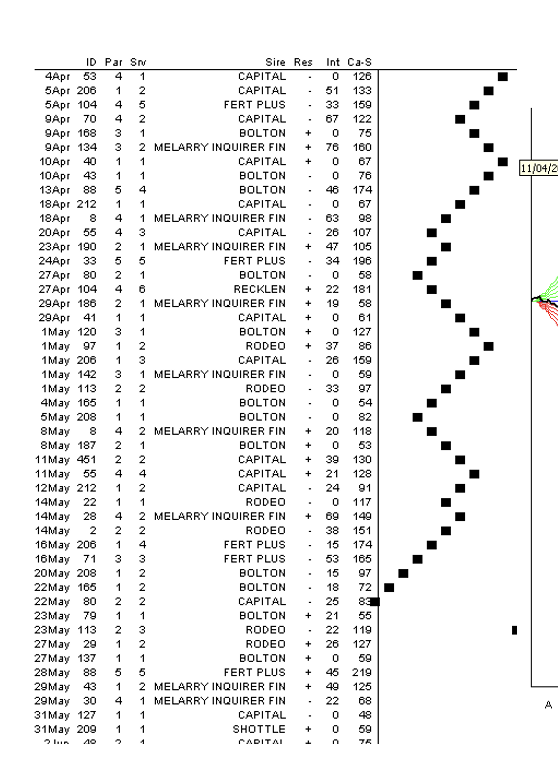
Cu-Sum
Line moves R when pregnant & L when not
If half conceive will get 50% —> higher green line, can see @ what point it is parallel w/ blue line, to see where it goes wrong
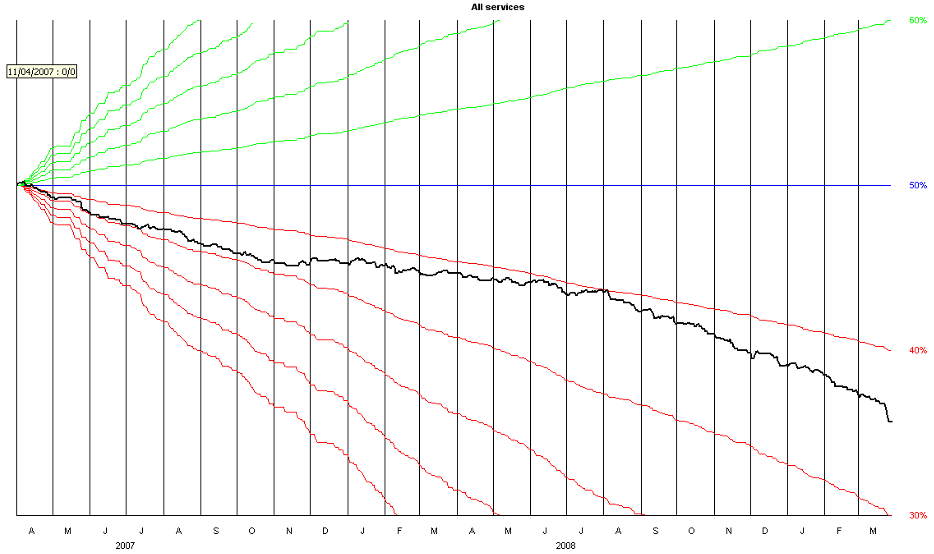
What has changed on this Cu-Sum?
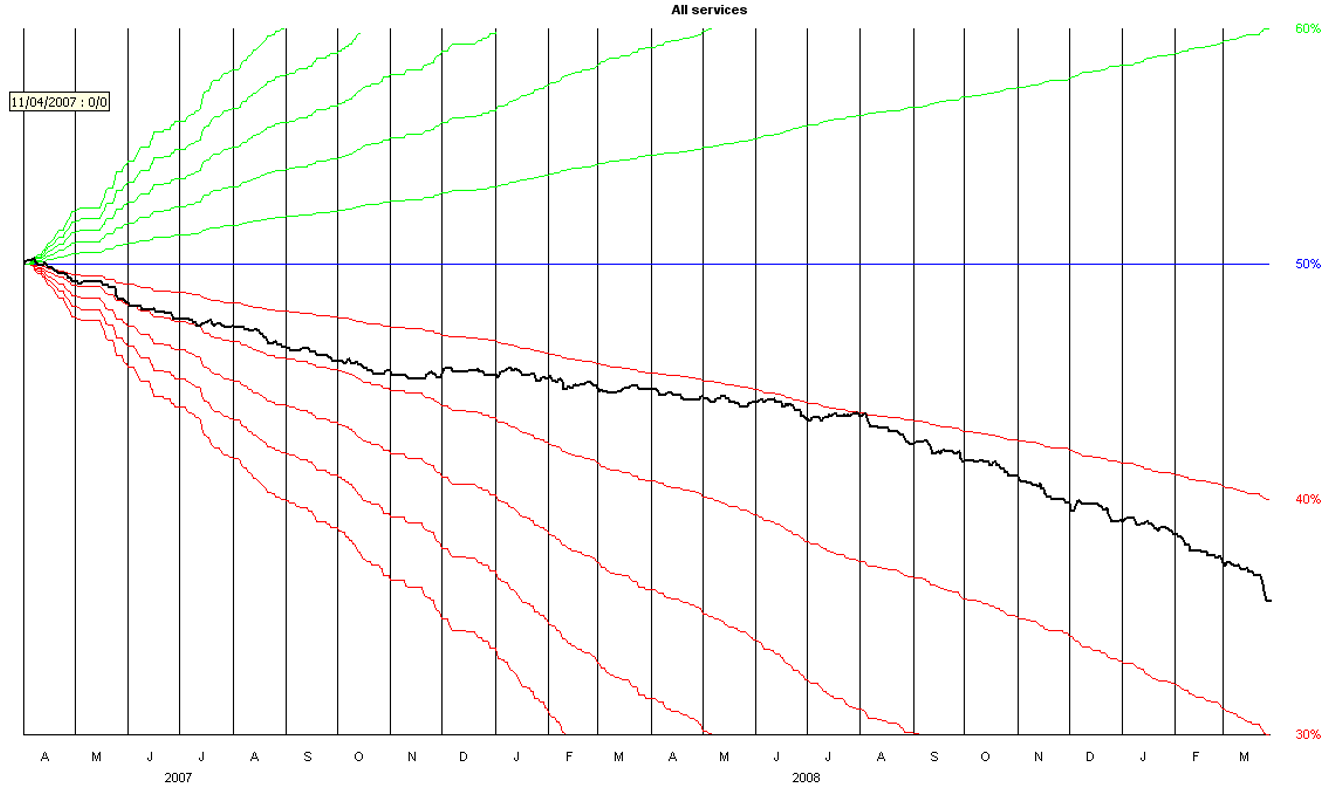
Black line gradient changes indicating a change in performace
Steeper = worse
Flatter = better
Can identify times where something may have changed
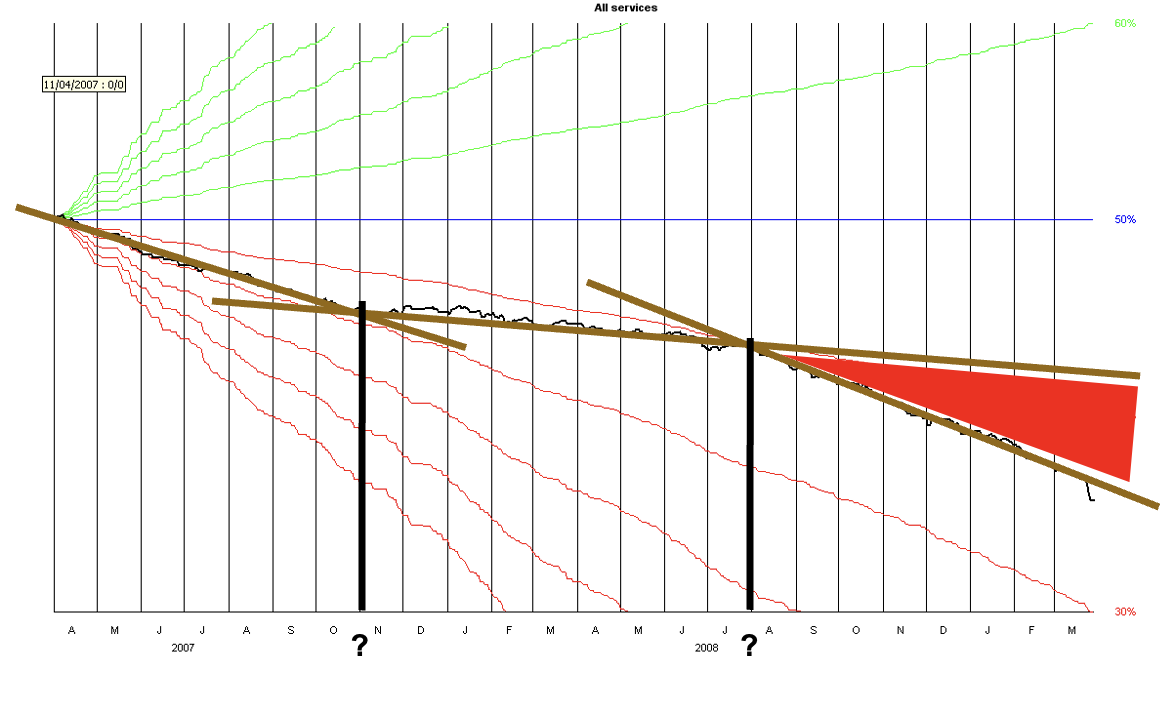
What is this graph showing?
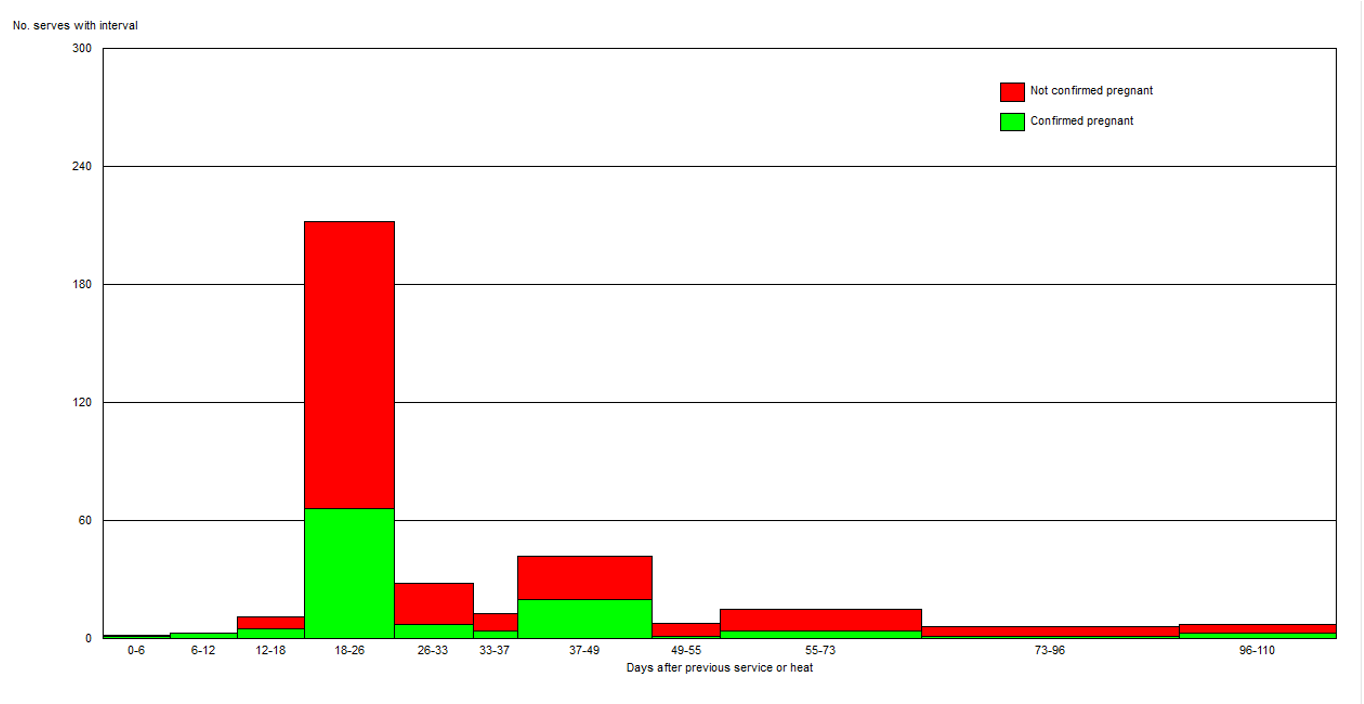
Inter service intervals
Ideally expect all cows to be re-served @ 18-24 days
What is this graph showing?
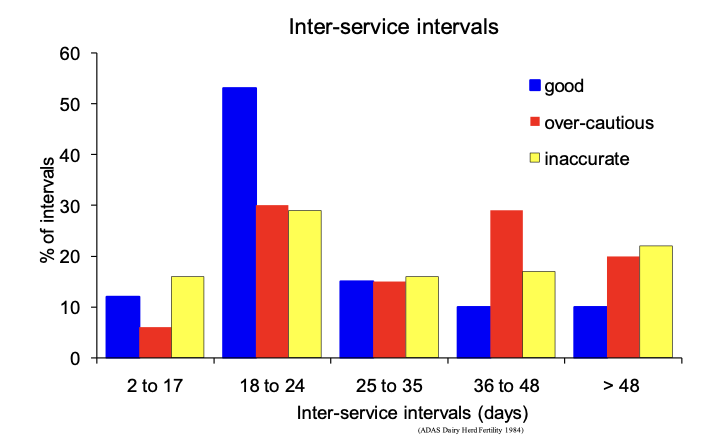
Reiterates some of the causes behind possible patterns of returns to service discussed
What is this table showing?
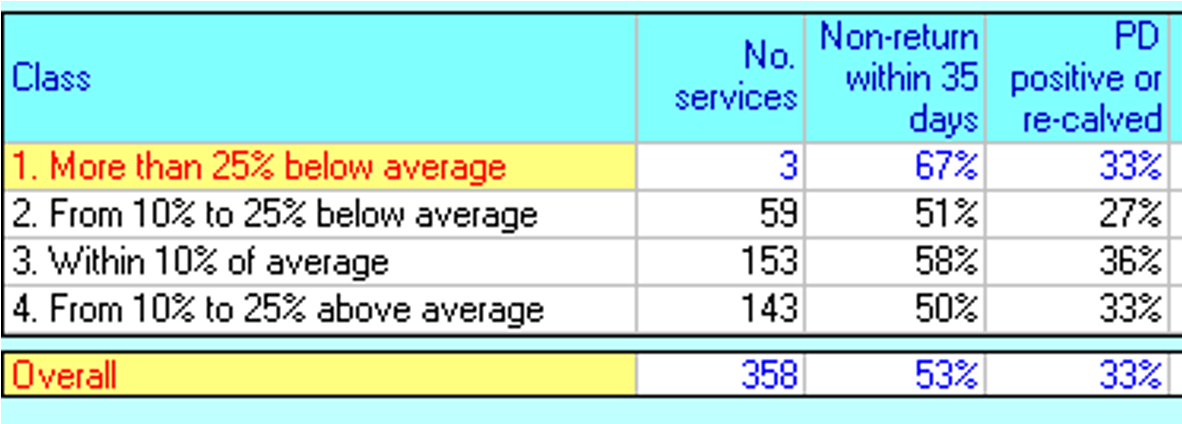
Separated out into milk yield cf to that expected
Can see that cows below expected yield have issue with fertility probably due to concurrent illness
Non return at 35 days means that either PD positive or missed oestrus or not cycling
Explain this graph
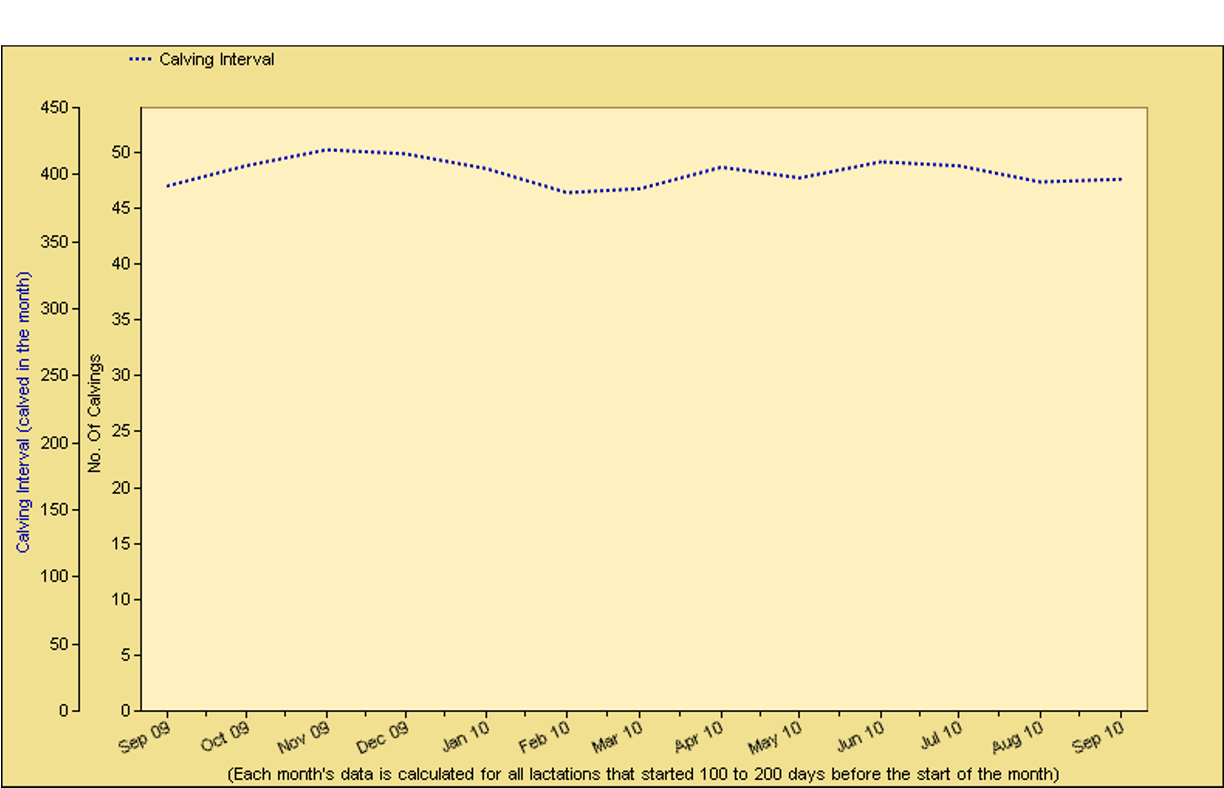
Simply avg. calving interval for the cows on the farm
What are the 3 steps of proactive health planning?
Measure
Manage
Monitor
ongoing cycle by farmer, nutritionalist, vet, agricultural advisors
What raw fertility data contributes to KPIs
Calving date
Date of insemination
Result of PD
Dry off dates
Culls (ID of cow)
What is this showing?
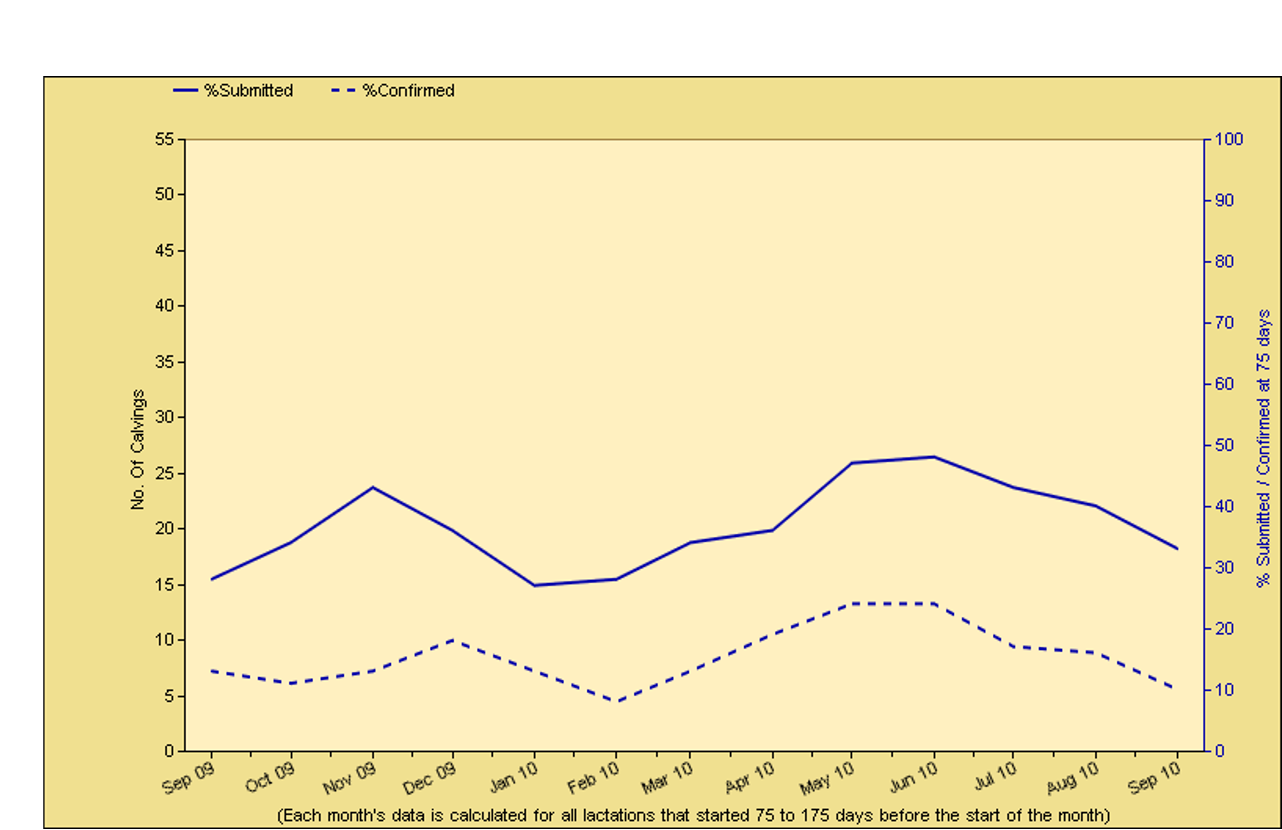
Submission & pregnancy
% submitted = served
Confirmed = PD +ve so conceived
What is this graph showing?
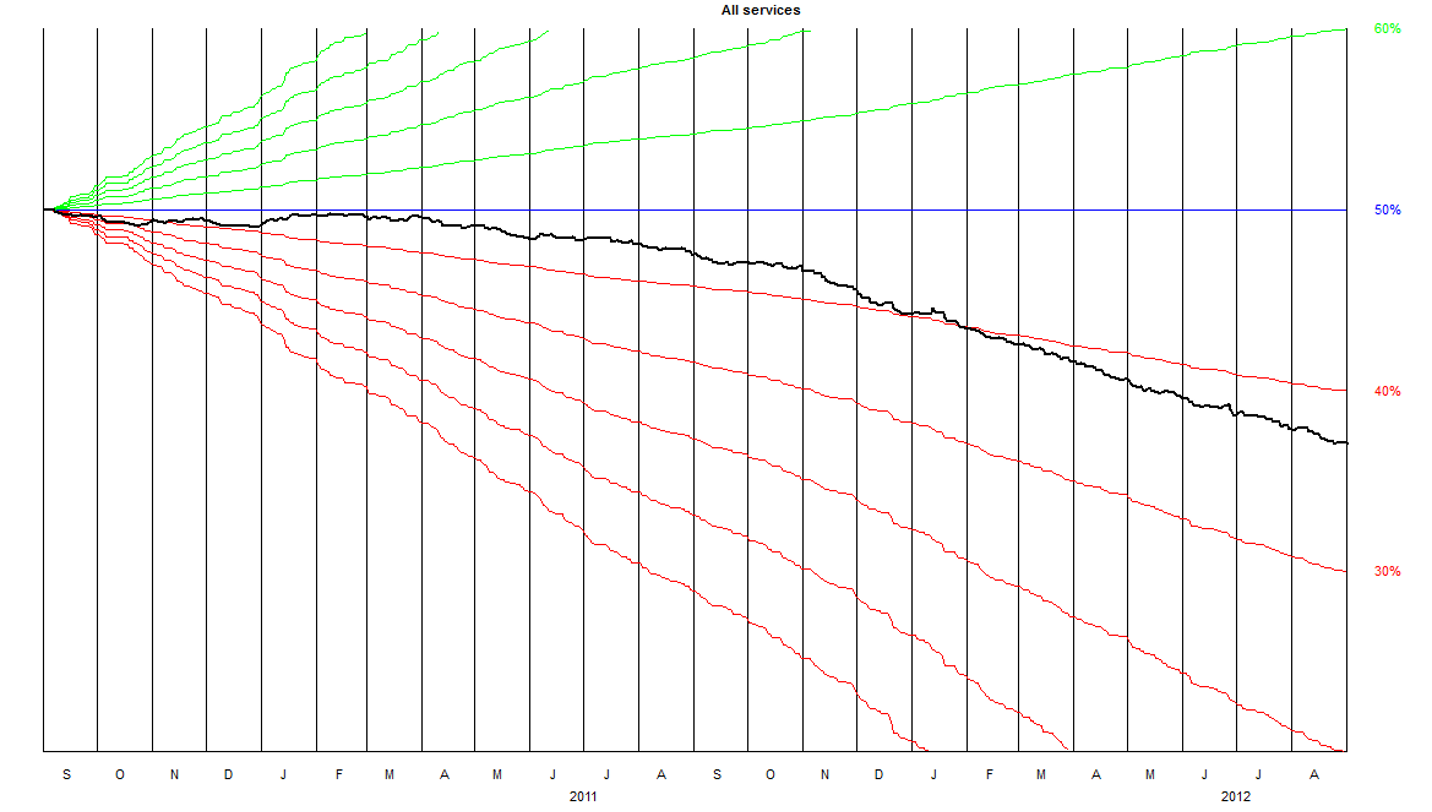
All services —> basically just pregnancy rate
So for all milking cows overall about 37% but can see changes in gradient
What is this showing?
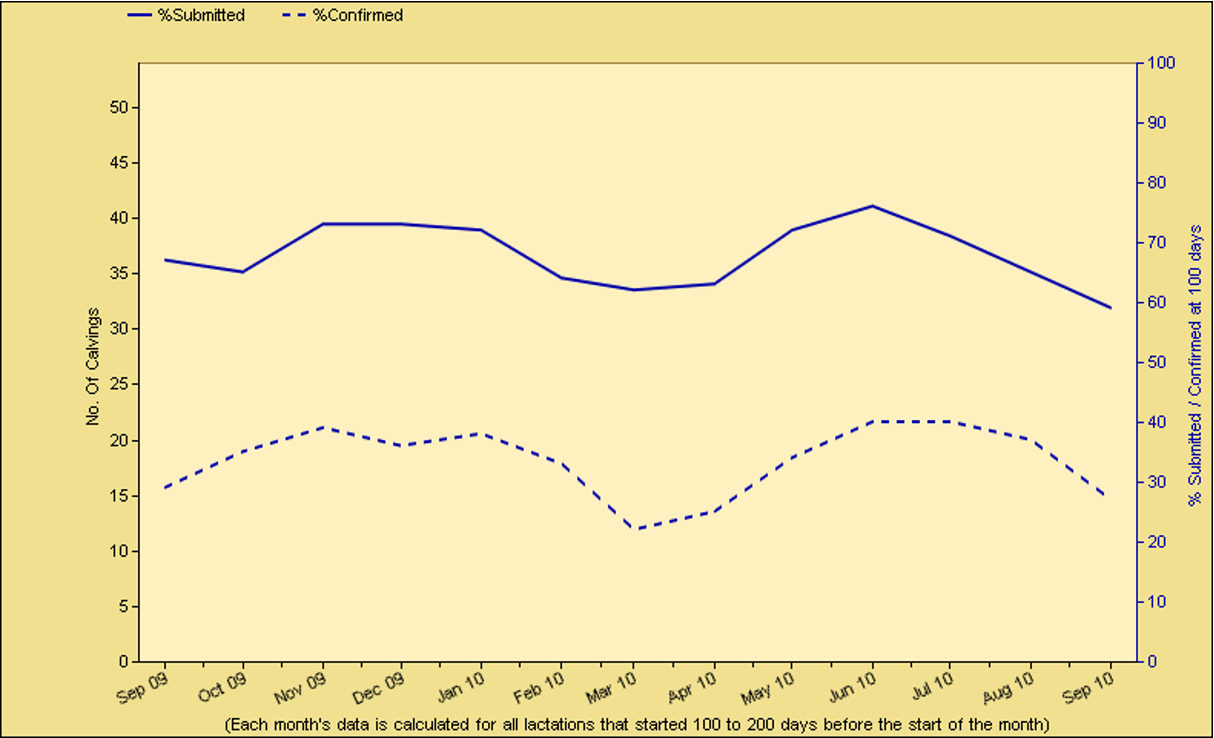
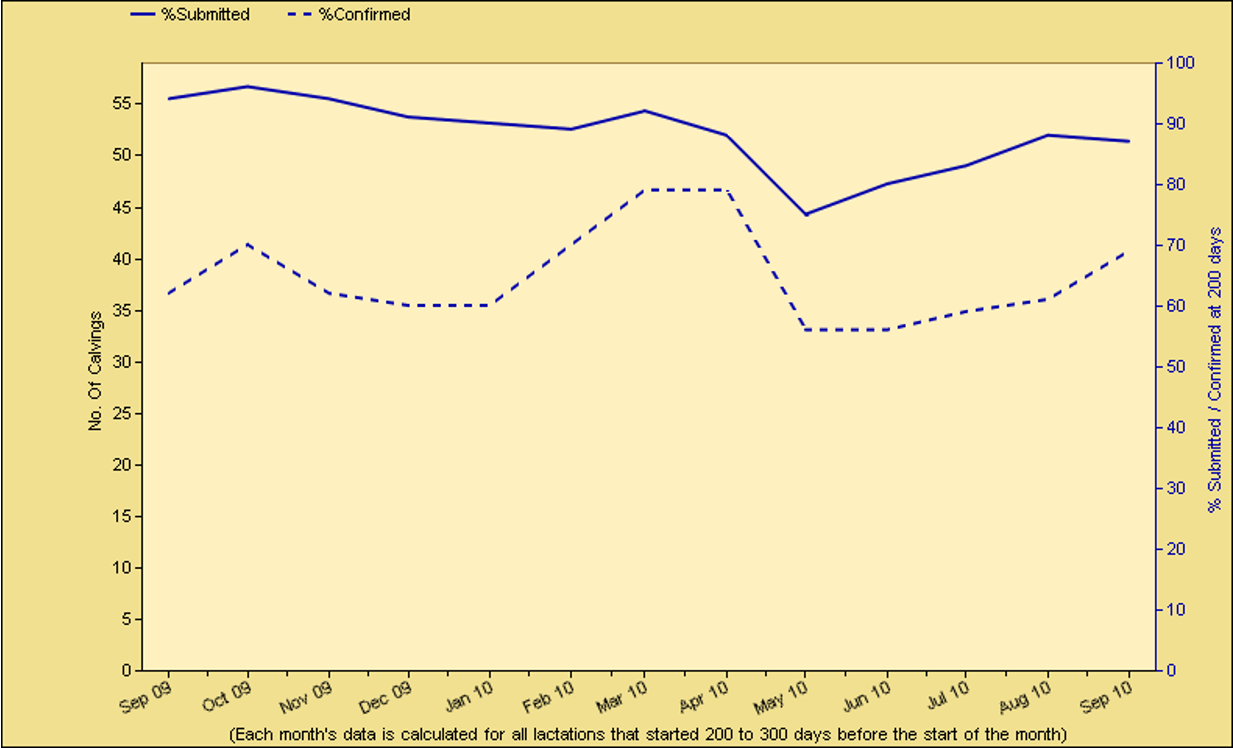
Submission & Pregnancy by 100 & 200 days pp
Submitted = served
PD = +ve so conceived
If a farmer wants to seasonally calve in spring or autumn will stop at specific date so cows do not conceive outside period they want.
First graph —> It is a 100 day submission rate and 100 day in calf rate- target would be 50% (Ideally 100%)
Second graph:
200 days after calving is reasonable to carry on serving if calving all year round
All services for their first lactation
What is this showing?
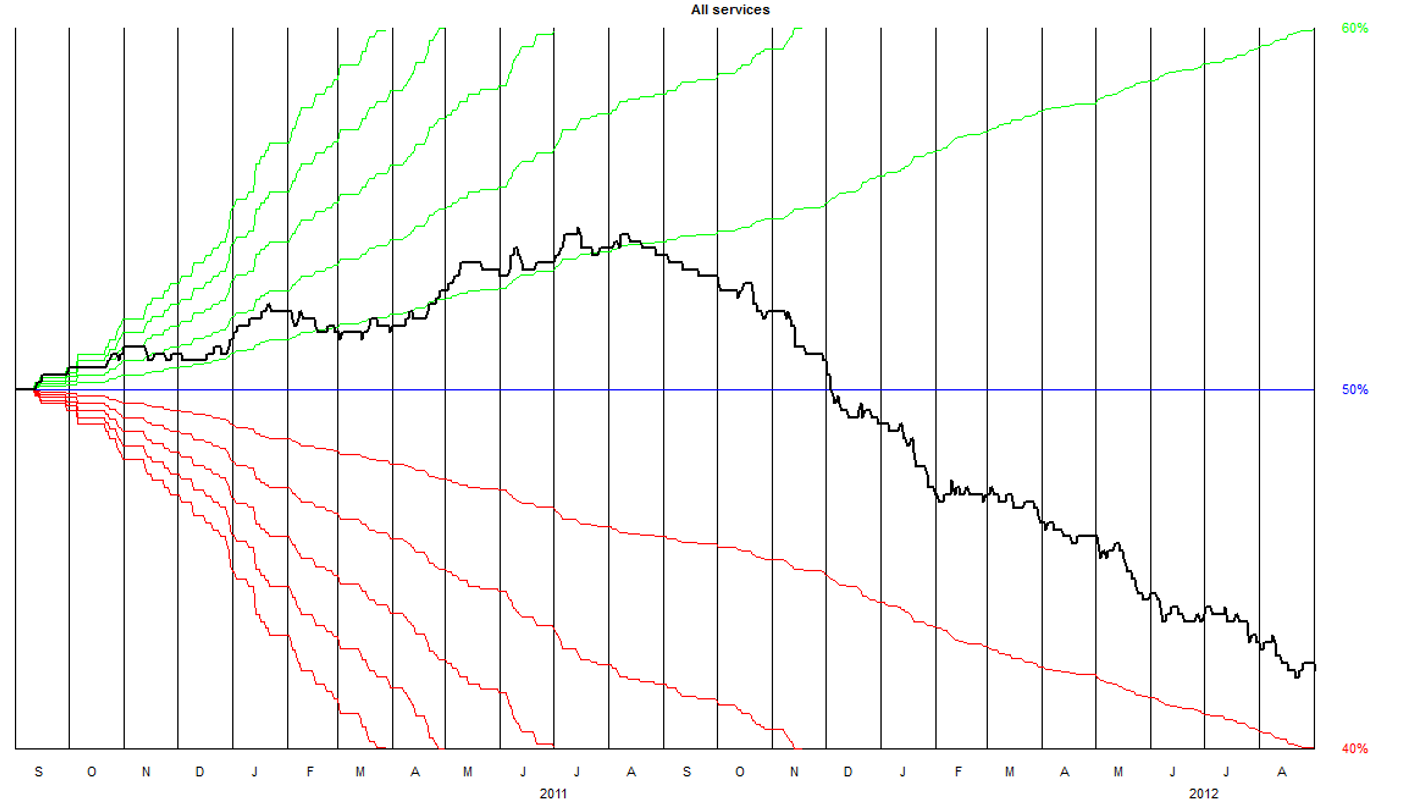
Very good then got very poor
Over two years so disease/ diet etc may have contributed to this? Lots of reasons —> ask the farmer what the change was between the two groups
What raw fertility data contributes to KPIs
Calving date
Date of insemination
Result of PD
Dry off dates
Culls (ID of cow)
** See Jo's word document of KPIs
All services- 2nd lactation
What is this showing?
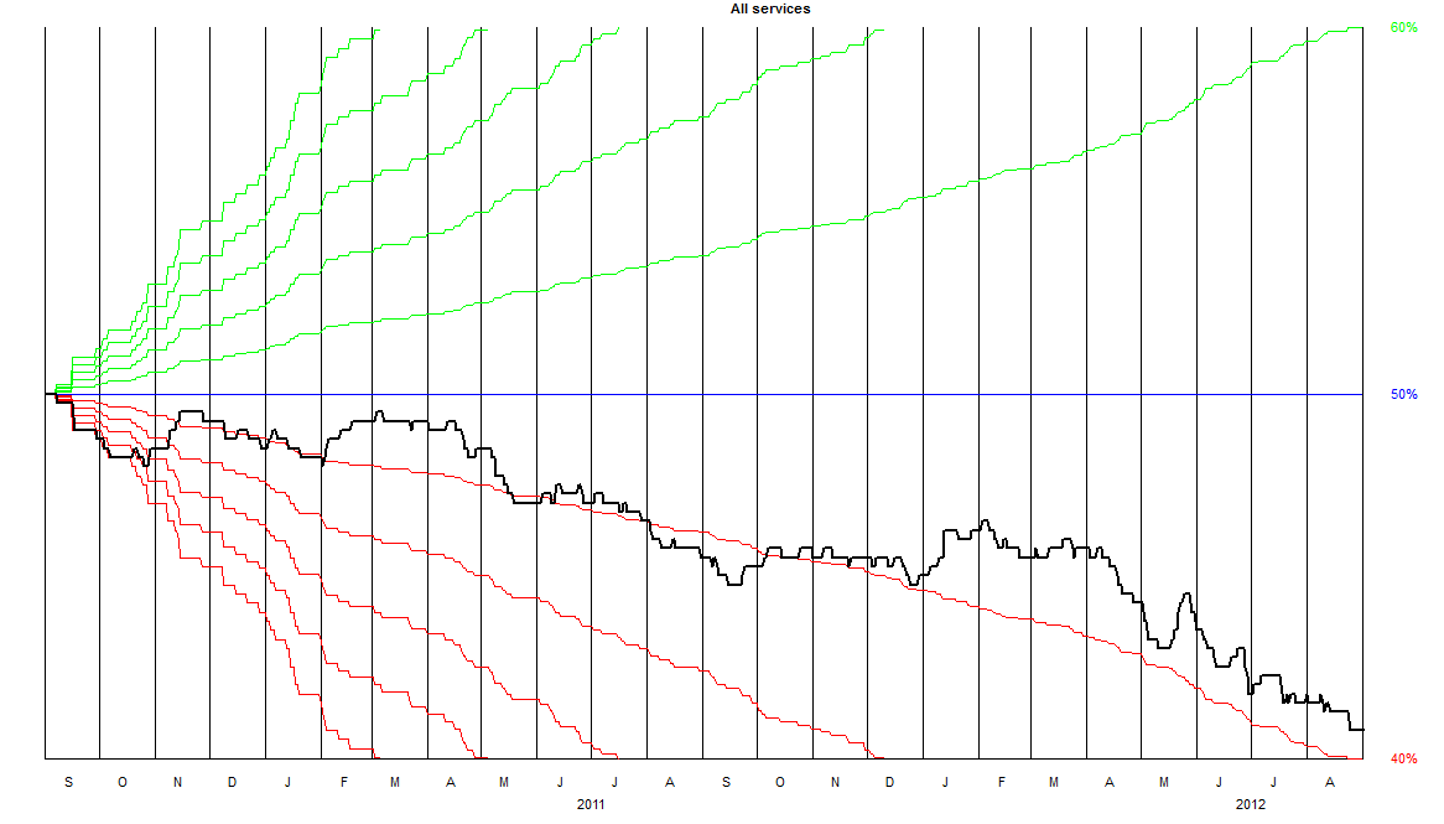
Less animals so line more variable but about 40% throughout
All services- 3rd lactation
What is this showing
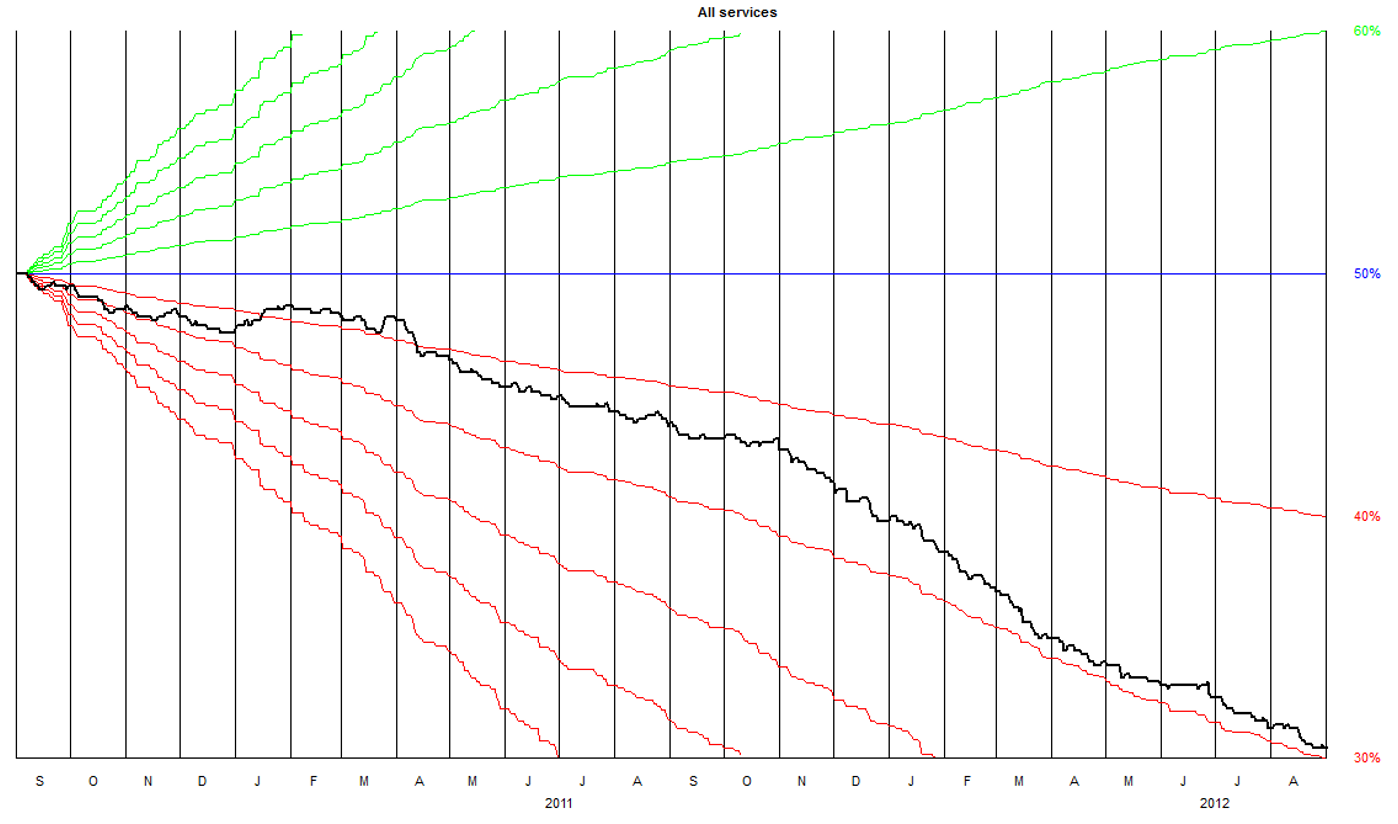
35% then worse but recovered to 30%
This group have a big problem November to March. So what is the difference in management between the groups- ask the farmer
NB: compare the gradient to the red line for the specific time period to interpret the percentage