2A-2D
 Call Kai
 Learn
 Practice Test
 Spaced Repetition
 Match
 Flashcards
 Knowt Play
1/54

There's no tags or description
Looks like no tags are added yet.
55 Terms
Two-way table
one that lists the categories for one variable across the top and the categories for a different variable down the left side
Joint relative frequency
In a two-way table, we find this by dividing the a certain count by total number in the table
What is a joint in a two-way table?
A joint is where two bones meet and this is where the row and column meet.
Marginal distribution
Also called marginal relative frequency. Is found by dividing the total counts for a category by the total number of data.Wh
Why is marginal distribution called that?
•It’s called “marginal” because we divide the numbers in the margins (which are row or column totals) by the overall number of data (which should be in the bottom right corner of your table).
Conditional relative frequency
•gives the proportion of individuals that have a specific value for one categorical variable among individuals who share the same value of another categorical variable.
•This “same value of another categorical variable” is known as the “condition”.
•When finding things that are “conditional”, we aren’t considering the entire table of data, just the single row or the single column that meets our condition.
Side-by-side bar graphs
•compare the conditional relative frequencies that cover the entire set of data.
•For our example it can be two sets of three bar graphs OR three sets of two bar graphs.
•Make sure you are consistent with the order of the bars.
Segmented bar graphs
•the same idea as side by side bar graph but with the bars vertically connected instead of next to each other horizontally.
Mosaic plots
are just like segmented bar graphs but the widths of the bars indicate the number of individuals in that category/condition.
distribution
means a listing of everything that can happen and how often each of those things happen
•There is an association between two variables if
knowing the value of one variable helps us predict the value of the other. If this isn’t true, there is no association.
Another word that is mentioned when comparing two variables is ____. That refers specifically to a linear relationship between quantitative variables, and is hence not appropriate to use in this context
correleation
Random process
generates outcomes that are determined purely by chance
Probability
Of an youtcome of arandom process is a number between 0 (inclusive) and 1 (inclusive) that describes the propportion of times that particular outcome would occur in a very long series of trials.
law of large numbers
•says that if we observe more and more trials of any random process, the proportion of times that a specific outcome occurs approaches its probability.
Simulation
•imitates a random process in such a way that simulated outcomes are consistent with real-world outcomes.
What are the three steps of a simulation?
•Describe how you will use a random process to perform one trial of the simulation. State what you will record at the end of each trial.
•Perform many trials of the simulation.
•Use the results of your simulation to answer the question of interest.
•we expect our field hockey team will win 70% of its games. Use a random number table to simulate how many games it will take to win 9 games.
•We will use digits. What will signify a game? What will signify a win? What will signify a loss?
•Since we can represent wins with single digits, each digit represents a game.
•We need seven of the ten digits to signify a win. Let’s say 1-7 is a win. So 8/9/0 is a loss.
•We need to keep going until we get nine wins. Keep counting digits (with each digit representing a game) until we get to our ninth win. Then count the number of games/digits we needed. This is the output of our simulation, because it answers the question that was asked.
•That’s a single simulation. Do it a bunch of times and then average those results.
probability model for a random process…
•lists (1) all the possible outcomes and (2) the probability associated with each outcome.
•We call the list of all possible outcomes the _____
•We call a collection of one or more outcomes an ____.
sample space.
event
If all outcomes in the sample space are equally likely, then the probability that event A occurs =

•In addition to the formula from the previous page, we have a few more important rules that all valid probability models must follow. What are the two?
•Rule: The probability of any event is a number between 0 and 1 (inclusive).
•Rule: All possible outcomes must have probabilities that add up to 1.
•A complement of an event is…
everything that isn’t part of that event.
•The complement of Heads is ___
•The complement of “rolling a die and getting a 4” is ____
•If A is an event, the complement of A looks like ____
Tails.
“rolling a die and NOT getting a 4”.
A’ or A^c.
Complement rule and why it is true?
•P(A′ )=1-P(A)
•This is true because P(A)+P(A^′ )=1, which is to say that 100% of the time A either happens or doesn’t happen.
•Two events are mutually exclusive or ____if they have ____
disjoint, no outcomes in common.
If event A is “Rolling a total of 8 on our two dice” and event B is “Rolling a total of 5 on our two dice”, A and B are…
If event C is “Rolling a 3 on the green die”, then event A and event C are…
disjoint because they can never occur at the same time.
NOT disjoint because you can roll a total of 8 on our two dice while also rolling a 3 on our green die: the combination 3 + 5 = 8 is in both Event A and Event C.
•Two events that are complements of each other are, by definition, …
mutually exclusive or disjoint.
•General Addition Rule: if A and B are any two events resulting from some random process:
•(A or B)=P(A)+P(B)-P(both A and B).
In the General Addition Rule, when A and B are disjoint, this simplifies to
P(A or B)=P(A)+P(B).
“A or B” is called the ____ of events A and B. It consists of…
union, all the outcomes that are in event A or event B or both, and it is written as A∪B.
“A and B” is called the ____ of events A and B. It consists of…
intersection, all the outcomes that are common to both events, and it is written as A∩B.
General addition rule with correct signs?
P(A ∪ B)=P(A)+P(B)-P(A∩B).
•Venn diagram
consists of one or more circles surrounded by a rectangle. Each circle represents an event. The region inside the rectangle represents the sample space of the random process.
Conditional probability
the probability that one event happens given that another event is known to have happened.
Symbols for conditional probability
P(A | B)
Meaning: the probability of even A given that even B happens.
What is the symbol for complement of an event F?
F’
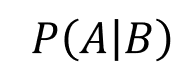
Formula?
•The denominator is the probability that the given event occurs.
•The numerator is the probability that both events occur.

P(A│B)= P(B|A) True or false?
False
A and B are independent events if…
•In other words, events A and B are independent if:
knowing whether or not one event has occurred does not change the probability that the other event will happen.
P(A│B)=P(A│B′ )=P(A) and P(B│A)=P(B│A′ )=P(B)
•Independence means…
the probability doesn’t change or depend on the other event happening.
Derive the General Multiplication Rule

P(A∩B)=P(B)∗P(A|B)
•In words: the probability that both events occur is…
the probability that one event occurs times the probability that the other event occurs given that the first one did.
•If the events are independent, the general multiplication rule is
P(A∩B)=P(A)∗P(B)=P(B)∗P(A).
What is the other way to check if events are independent using the general multiplication rule?
•if the product of their separate probabilities equals the probability of their intersection.

Answer to 2?
Use the complement of P(Always late) since that is easy to calculate and that complement is P(late just once) so P(late just once) = 1- 0.9^5
When asked to create a segmented bar chart, do you use relative frequency?
Assume yes.
When making a segmented bar graph remember to:
Make a key, add titles, y-axis will be rel frequency
If a questiona asks to: Interpret this probability. Then say…
If you take a very large random sample of times that (event), about x% of the time a (event).
Many women choose to have annual mammograms to screen for breast cancer after age 40. A mammogram isn’t foolproof. Sometimes the test suggests that a woman has breast cancer when she really doesn’t (a “false-positive”). Other times, the test says that a woman doesn’t have breast cancer when she actually does (a “false-negative”). Suppose the false-negative rate for a mammogram is 0.10.
Explain what this probability means.
If you take a very large random sample of women with breast cancer, about 10% of the women will have a mammogram that indicates she does not have breast cancer when she does have breast cancer.
What is another way to explain why someone is not “due” for success after many failures?
The law of large numbers only says that over a large number of trials, the overall proportion of successes will tend to get closer to the true probability. It does not mean that after a short streak of failures, a success becomes more likely on the next trial.



Other way involving intersection

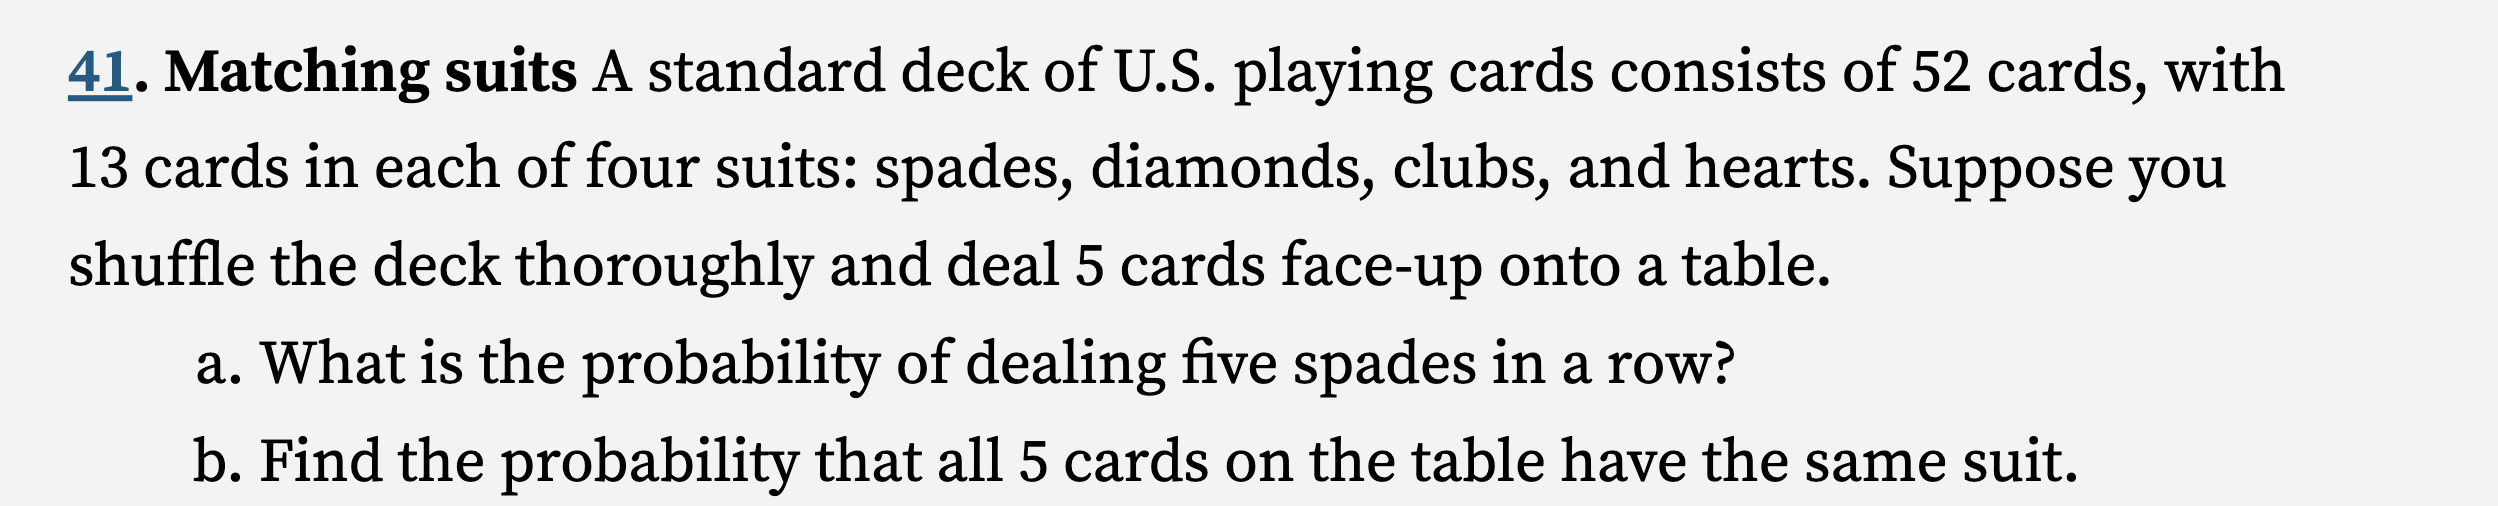
Specifically (B)!

How do you determine whether two categorical variables have an association using a two-way table?
A: Calculate and compare the conditional relative frequencies for each group. If the percentages differ, there is an association; if they're equal, there is no association.
Example: 22% of English students vs. 30.7% of American students want telepathy. Since the percentages differ, there is an association.