Math 1200 Exam 2 Study Guide
 Call Kai
 Learn
Learn Practice Test
 Spaced Repetition
 Match
Match Flashcards
 Knowt Play
1/89

Earn XP
Description and Tags
Contains Chapters 5.1 to 7.2
Name | Mastery | Learn | Test | Matching | Spaced | Call with Kai | Chat |
|---|
No analytics yet
Send a link to your students to track their progress
90 Terms
Random
The word _________ suggests an unpredictable result (or outcome).
Simulation
__________ is a technique used to re-create a random event. __________ can be tactile (as in physically flipping a coin) or virtual (using a computer to pretend it is flipping a coin). In both instances, the goal of the __________ is to measure how often a certain outcome (such as a head in coin flipping) is observed.
Random process
A(n) __________ represents scenarios where the outcome of any particular trial of an experiment is unknown, but the proportion (or relative frequency) a particular outcome is observed approaches a specific value as the number of trials increases.

Probability
__________ is a measure of the likelihood of a random phenomenon or chance behavior occurring. __________ deals with experiments that yield random short-term results or outcomes yet reveal long-term predictability.
outcomes
Probability is a measure of the likelihood of a random phenomenon or chance behavior occurring. Probability deals with experiments that yield random short-term results or _________ yet reveal long-term predictability.
Law of Large Numbers
The __________ is often interpreted as a nonexistent law called the Law of Averages by folks who misunderstand the ___________. For example, in baseball you may hear an announcer say that a certain player is due to get a hit because he has gone a number of at-bats without getting a hit.
Experiment
In probability, a(n) _________ is any process with uncertain results that can be repeated. The result of any single trial of the experiment is not known ahead of time. However, the results of the _________ over many trials produce regular patterns that allow accurate predictions.
Sample space
The __________, S, of a probability experiment is the collection of all possible outcomes.
Event
A(n) ________ is any collection of outcomes from a probability experiment. A(n) ________ consists of one outcome or more than one outcome. We will denote ________ with one outcome, sometimes called simple _______, ei. In general, ________are denoted using capital letters such as E.
Fair die
A(n) __________ is one in which each possible outcome is equally likely. For example, rolling a 2 is just as likely as rolling a 5.
Loaded die
We contrast this with a(n) ________, in which a certain outcome is more likely. For example, if rolling a 1 is more likely than rolling a 2,3,4,5, or 6 the die is loaded.
Rules of Probabilities
o The probability of any event E, P(E), must be greater than or equal to 0 and less than or equal to 1. That is, 0≤P (E)≤1 .
o The sum of the probabilities of all outcomes must equal 1. That is, if the sample spaceS={e1,e2,⋯,en}
Rules of Probabilities
What is the picture showing?

probability model
A(n) __________ lists the possible outcomes of a probability experiment and each outcome’s probability. A(n) __________ must satisfy Rules 1 and 2 of the rules of probabilities.
Impossible
If an event is _________, the probability of the event is 0.
Certainty
If an event is a(n) ________, the probability of the event is 1.
Unusual event
A(n) __________ is an event that has a low probability of occurring.
Typically, an event with a probability less than 0.05 (or 5%) is considered _________, but this cutoff point is not set in stone.
Approximation Probabilities Using the Empirical Approach
What is this photo showing?

Equally likely outcomes
An experiment has __________ when each outcome has the same probability of occurring.
Computing Probability Using the Classical Method
What is this picture showing?
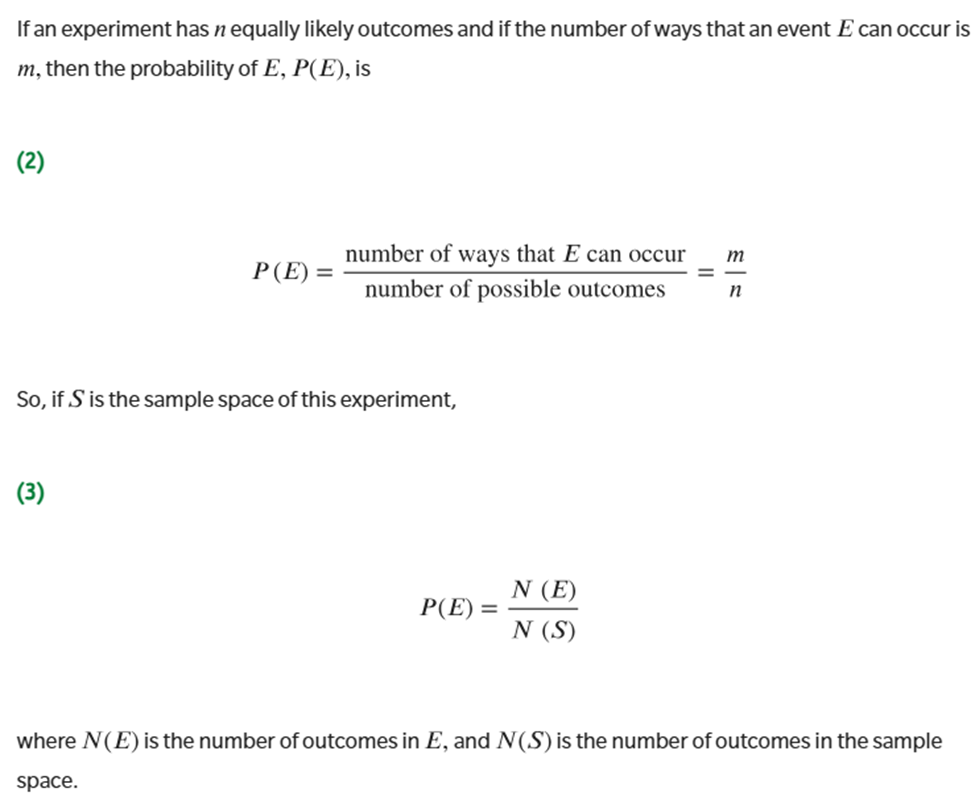
Tree diagram
To determine the sample space, construct a(n) __________ to list the equally likely outcomes of the experiment.

Subjective probability
Nonetheless, the forecast of 20% does satisfy the criterion that a probability be between and inclusive. This forecast is known as a(n) ___________. A(n) ____________ of an outcome is a probability obtained on the basis of personal judgment.
Mutually exclusive
Two events are disjoint if they have no outcomes in common. Another name for disjoint events is __________ events.
Venn diagrams
We can use __________ to represent events as circles enclosed in a rectangle. The rectangle represents the sample space, and each circle represents an event.


Addition Rule for Disjoint Events
These pictures are showing?


The General Addition Rule
What is this picture showing?

Contingency table or two-way table
This table is called a(n) ___________, because it relates two categories of data. The row variable is marital status, because each row in the table describes the marital status of an individual. The column variable is gender. Each box inside the table is called a cell.

Complement of an Event
Let S denote the sample space of a probability experiment and let E denote an event. The complement of E denoted EC, is all outcomes in the sample space S that are not outcomes in the event E.

Complement Rule
What are these pictures showing?


Independent
Two events E and F are __________ if the occurrence of event E in a probability experiment does not affect the probability of event F.
Dependent
Two events are _________ if the occurrence of event E in a probability experiment affects the probability of event F.
True
(True or False) Two events that are disjoint are not independent.
Multiplication Rule for Independent Events
What is this picture showing?

Multiplication Rule for n Independent Events
What is this picture showing?
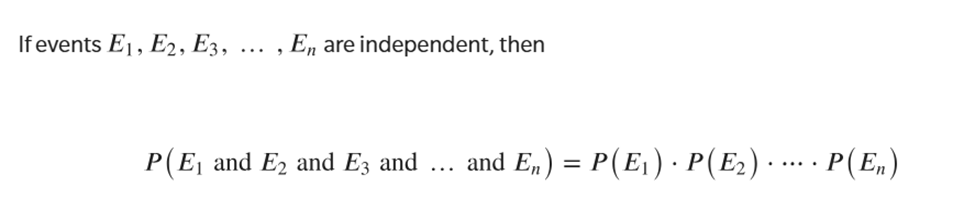
Conditional Probability
The notation P(F|E) is read “the probability of event given event F given event E.” It is the probability that event F occurs, given that event E has occurred.
Conditional Probability Rule
What is this picture showing?

General Multiplication Rule
What is this picture showing?

Multiplication Rule of Counting
What is this picture showing?

Factorial symbol
If n ≥ 0 is an integer, the ________, 𝑛!, is defined as follows:
n! = n(n−1) ⋅ ⋯ ⋅ 3 ⋅ 2 ⋅ 1
0!=1 1!=1
Permutation
A(n) __________ is an ordered arrangement in which r objects are chosen from n distinct (different) objects so thatr≤n and repetition is not allowed. The symbol nPr, represents the number of _________s of r objects selected from n objects.
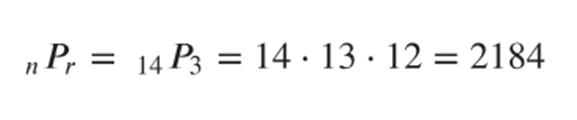
Number of Permutations of n Distinct Objects Taken r at a Time
What is this picture showing?

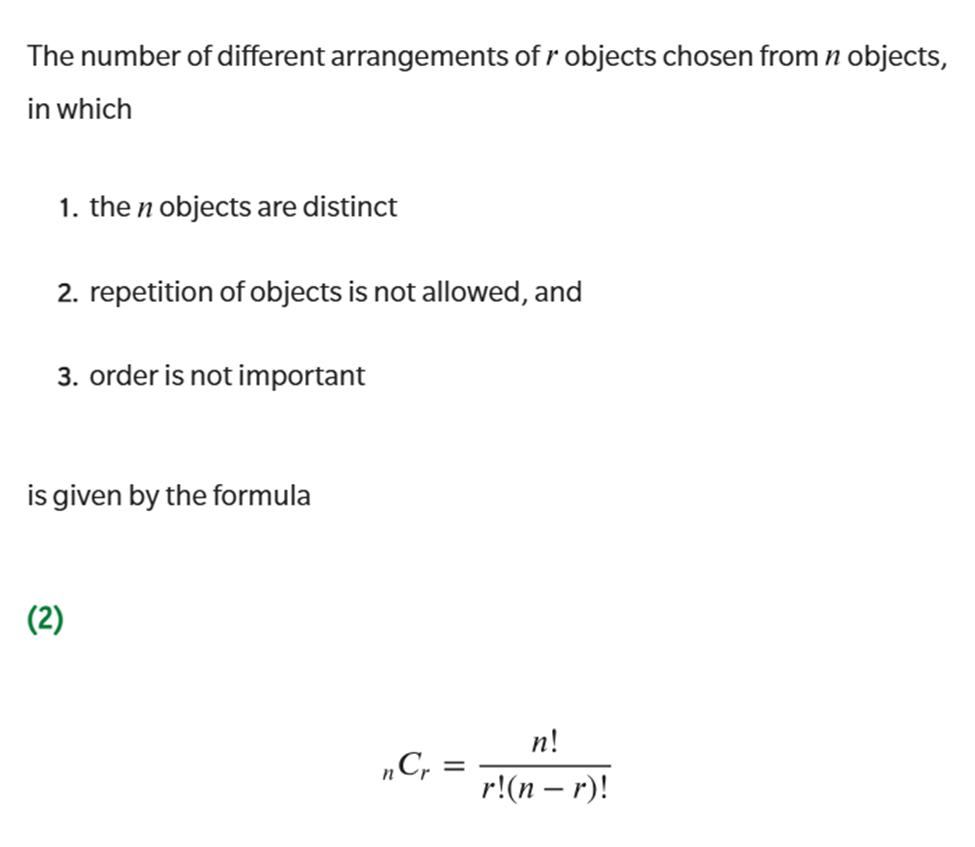
Combination
A(n) ___________ is a collection, without regard to order, in which r objects are chosen from n distinct objects with r ≤ n and without repetition. The symbol nCr represents the number of combinations of n distinct objects taken r at a time.

Number of Combinations of n Distinct Objects Taken r at a Time
What is this picture showing?
Permutations with Nondistinct Items
What is this picture showing?

Use classical approach: P(E) = N(E) / S(S)
Which method do I use?
Are you finding the probability of a single event? - Yes
Are the outcomes equally likely? - Yes
Use P(E) = Frequency of E / Number of trials
Which method do I use?
Are you finding the probability of a single event? - Yes
Are the outcomes equally likely? - No
Is it possible to get empirical data? - Yes
Use subjective probability
Which method do I use?
Are you finding the probability of a single event? - Yes
Are the outcomes equally likely? - No
Is it possible to get empirical data? - No
Use P(E or F) = P(E) + P(F)
Which method do I use?
Are you finding the probability of a single event? - No
Do the events involve ‘OR‘, ‘AND‘, or ‘At Least‘? - OR
Are the events disjoint (mutually exclusive)? - Yes
Use P(E or F) = P(E) + P(F) - P(E and F)
Which method do I use?
Are you finding the probability of a single event? - No
Do the events involve ‘OR‘, ‘AND‘, or ‘At Least‘? - OR
Are the events disjoint (mutually exclusive)? - No
Use P(E and F) = P(E) * P(F)
Which method do I use?
Are you finding the probability of a single event? - No
Do the events involve ‘OR‘, ‘AND‘, or ‘At Least‘? - AND
Are the events independent? - Yes
Use P(E and F) = P(E) * P(F | E)
Which method do I use?
Are you finding the probability of a single event? - No
Do the events involve ‘OR‘, ‘AND‘, or ‘At Least‘? - AND
Are the events independent? - No
Use P(at least 1) = 1 - P(none)
Which method do I use?
Are you finding the probability of a single event? - No
Do the events involve ‘OR‘, ‘AND‘, or ‘At Least‘? - At Least
Use the Multiplication Rule of Counting (p * q * r * …)
Which method do I use?
Are you making a sequence of choices? - Yes
Are the number of choices at each stage independent of previous choices - Yes
Use tree diagram
Which method do I use?
Are you making a sequence of choices? - Yes
Are the number of choices at each stage independent of previous choices - No
Use nPr = n! / (n - r)!
Which method do I use?
Are you making a sequence of choices? - No
Does the order of arrangements matter? - Yes
Are you selecting all n objects, or only r objects? - Only r
Use n!
Which method do I use?
Are you making a sequence of choices? - No
Does the order of arrangements matter? - Yes
Are you selecting all n objects, or only r objects? - Only n
Are the objects all distinct? - Yes
Use n! / n1! n2! … nk!
Which method do I use?
Are you making a sequence of choices? - No
Does the order of arrangements matter? - Yes
Are you selecting all n objects, or only r objects? - Only n
Are the objects all distinct? - No
Use nCr = n! / r!(n - r)!
Which method do I use?
Are you making a sequence of choices? - No
Does the order of arrangements matter? - No
Random variable
A(n) __________ is a numerical measure of the outcome of a probability experiment, so its value is determined by chance. __________ are typically denoted using capital letters such as X.
Discrete random variable
A(n) __________ has either a finite or countable number of values. The values of a __________ can be plotted on a number line with space between each point.
Continuous random variable
A(n) __________ has infinitely many values. The values of a __________ can be plotted on a line in an uninterrupted fashion.
Probability distribution
The __________ of a discrete random variable provides the possible values of the random variable and their corresponding probabilities. A(n) _________ can be in the form of a table, graph, or mathematical formula.
Rules for a Discrete Probability Distribution
What is this picture showing?

The Mean of a Discrete Random Variable
What is this equation?

Expected value
Because the mean of a random variable represents what we would expect to happen in the long run, it is also called the __________, E(X). The interpretation of __________ is the same as the interpretation of the mean of a discrete random variable.
Standard Deviation of a Discrete Random Variable
What is this equation?

Binomial probability distribution
The __________ is a discrete probability distribution that describes probabilities for experiments in which there are two mutually exclusive (disjoint) outcomes. These two outcomes are generally referred to as success (such as making a free throw) and failure (such as missing a free throw).
Binomial experiment
An experiment is said to be a(n) __________ if
o The experiment is performed a fixed number of times. Each repetition of the experiment is called a trial.
o The trials are independent. This means that the outcome of one trial will not affect the outcome of the other trials.
o For each trial, there are two mutually exclusive (disjoint) outcomes: success or failure.
o The probability of success is the same for each trial of the experiment.
Binomial random variable
Let the random variable be the number of successes in trials of a binomial experiment. Then is called a(n) _________.
Binomial Probability Distribution Function
What is this picture showing?

≥
What math symbol uses the phase
“at least“ or “no less than“ or “greater than or equal to“
>
What math symbol uses the phase
“more than“ or “greater than“
<
What math symbol uses the phase
“fewer than“ or “less than“
≤
What math symbol uses the phase
“no more than“ or “at most“ or “less than or equal to“
=
What math symbol uses the phase
“exactly“ or “equals“ or “is“
Mean (or Expected Value) and Standard Deviation of a Binomial Random Variable
What is this picture showing?

Uniform probability distribution
The random variable X can be any value in the interval from to that is, 0≤x≤30 . Because any two intervals of equal length between 0 and 30 inclusive, are equally likely, the random variable X is said to follow a(n) __________.
Probability density function (pdf)
A(n) __________ is an equation used to compute probabilities of continuous random variables. It must satisfy the following two properties:
The total area under the graph of the equation over all possible values of the random variable must equal
The height of the graph of the equation must be greater than or equal to for all possible values of the random variable.
Model
In mathematics, a(n) _________ is an equation, table, or graph used to describe reality.
Normal curve
The red curve in a model called the _________, which is used to describe continuous random variables that are said to be normally distributed.

Normal probability distribution
A continuous random variable is normally distributed, or has a ___________, if its relative frequency histogram has the shape of a normal curve.
Inflection points
The points at x=μ−σ and x=μ+σ are the __________ on the normal curve, the points on the curve where the curvature of the graph changes.
Properties of the Normal Density Curve
o The normal curve is symmetric about its mean, μ .
o Because mean = median = mode, the normal curve has a single peak and the highest point occurs at x=μ .
o The normal curve has inflection points at μ−σ and μ+σ .
o The area under the normal curve is 1
o The area under the normal curve to the right of μ equals the area under the curve to the left of μ , which equals 21 .
o As x increases without bound (gets larger and larger), the graph approaches, but never reaches, the horizontal axis. As x decreases without bound (gets more and more negative), the graph approaches, but never reaches, the horizontal axis.
o The Empirical Rule:
Approximately 68% of the area under the normal curve is between x=μ−σ and x=μ+σ ;
approximately 95% of the area is between x=μ−2σ and x=μ+2σ ;
approximately 99.7$ of the area is between x=μ−3σ and x=μ+3σ .
The Empirical Rule
What is this picture showing?

Normal probability density function
The equation (or model) used to determine the probability of a continuous random variable is called a probability density function (or pdf). The ___________ is given by

Area Under a Normal Curve
Suppose that a random variable is normally distributed with mean and standard deviation . The area under the normal curve for any interval of values of the random variable represents either
o the proportion of the population with the characteristic described by the interval of values or
o the probability that a randomly selected individual from the population will have the characteristic described by the interval of values.
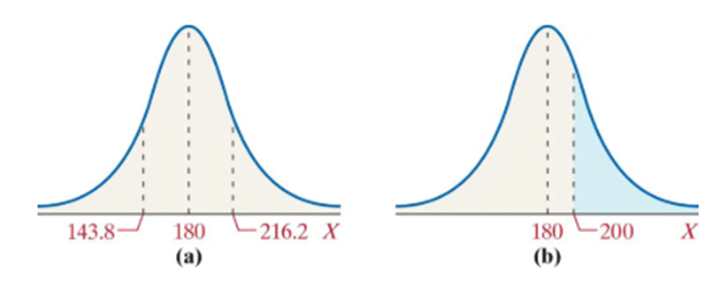
Standardizing a Normal Random Variable
What is this picture showing?

Standard normal random variable
If a normal random variable X has mean different from 0 or a standard deviation different from 1, X can be transformed into a(n) ___________ Z whose mean is 0 and standard deviation is 1.
Standard normal curve
What do you call the graph shown in Figure 10?

za
The notation __ (pronounced “z sub alpha”) is the z-score such that the area under the standard normal curve to the right of __ is a.
