Cluster Analysis - DSCI 4520
 Call Kai
 Learn
 Practice Test
 Spaced Repetition
 Match
 Flashcards
 Knowt Play
1/17

Earn XP
Description and Tags
Vocabulary flashcards covering fundamental concepts, distance metrics, standardization techniques, and algorithms in cluster analysis from DSCI 4520.
Name | Mastery | Learn | Test | Matching | Spaced | Call with Kai | Chat |
|---|
No analytics yet
Send a link to your students to track their progress
18 Terms
Cluster
Is a descriptive collection of data objects that exhibits high similarity among objects within the same group and dissimilarity among objects in different groups.
Cluster Analysis
Involves Subjective Judgements -We don’t know how many clusters there are until the output
Is an unsupervised classification technique, also known as segmentation, meaning there’s no pre-determined classes. It groups data points based on similarity without prior labels. The number of clusters is often determined post-analysis.
Cluster Analysis in applied in these two…
either as a stand-alone exploratory analysis or as a pre-processing step for predictive models
.It helps uncover patterns and structures in data before applying supervised learning techniques.
Market Segmentation
A business application of cluster analysis that groups customers to develop tailored marketing strategies, allocate resources efficiently, differentiate offerings, and improve customer satisfaction.
Intra-Class Similarity
Sign of good clustering; is how similar the data objects within the same cluster are
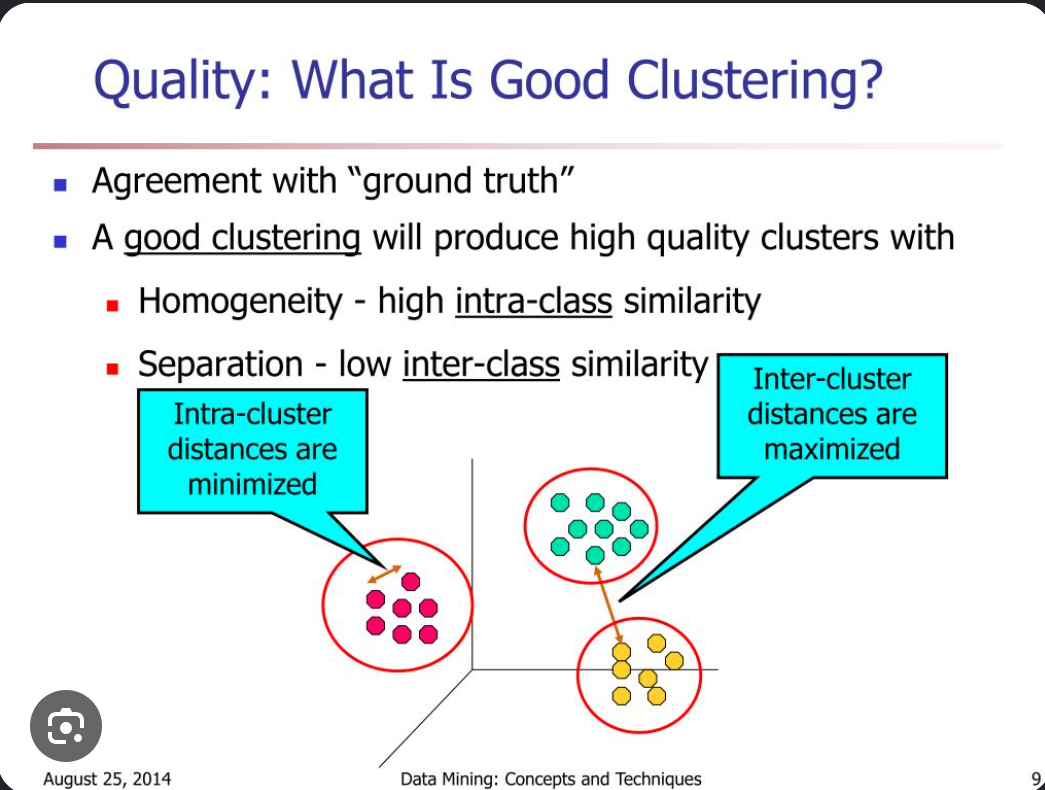
Inter-Class Similarity
Sign of good clustering; is how similar the data objects across different clusters,

Minkowski Distance
A metric for calculating distance between points in multidimensional space expressed
includes…
Euclidean Distance (A to C) and
Manhattan Distance (AB + BC)

Euclidean Distance
The straight-line distance between two points corresponding to Minkowski distance where p=2, calculated ad(x,y)=∑i=1n(xi−yi)2
calculated a2*b2*c2 AND then square root it
Calculation for Euclidean distance: how similar are jim and mike?
Compared to what? Well if we look at mike and kate, jim and mike arent that similar.

Manhattan Distance
A distance metric between two points measured along axes at right angles, corresponding to Minkowski distance where p=1, calculated as d(x,y)=∑i=1n∣xi−yi∣.
calculated as Manhattan Distance (AB + BC)
Standardization
The pre-processing practice of converting variables to a common scale (squish the range from a bigger range to a smaller one), using z- score, ie, turning 1 billion - billion to 0 to -3.
-Do this because similarity is measured in terms of distance
- Now mike is more similar to jim than kate
Two ways to standardize
z-score
Scaling [0,1]
z-Score Standardization
A standardization technique calculated as z=sx−xˉ , Subtract the mean from each
observation and divide by the sample standard deviation
-Resulting data will have a mean of 0 and a standard deviation of 1.
z-Score Standardization Calculation Practice
Let's calculate the z-score for Jim's Age using the data tables visible on your screen:
z=sx−xˉ
x = 38 Jims age:
1: xˉ (average of ages = 38 + 97 + 22/ 3 = 52.33 xˉ)
2: σ (Std Dev Age = ((Jim 52.33 - 38)² + ( Mike 97 - 52.33)² + Kate 52.33 - 22)² = 3120.67 σ
3: 3120.67 σ / 2(n-1) = 1560.33
4. get square root of 1560.33 = 39.50 s
so, x (38) - 52.33 (average) / 39.50 s = -0.36 (for Jim’s age) and you rinse and repeat until you get a mean of 0 and a standard deviation of 1 .

Partitional Clustering
Take a big cluster and make smaller ones
K means average
A clustering approach that divides a dataset of n objects into discrete clusters to optimize a specific partitioning criterion.
Hierarchical Clustering
-clustering technique where the goal is to identify the hierarchies between objects n in the dataset such
that they can be represented in a nested tree structure
k-Means Algorithm
A heuristic partitional clustering algorithm introduced by MacQueen (1967) where each cluster is represented by a calculated centroid based on variable averages.
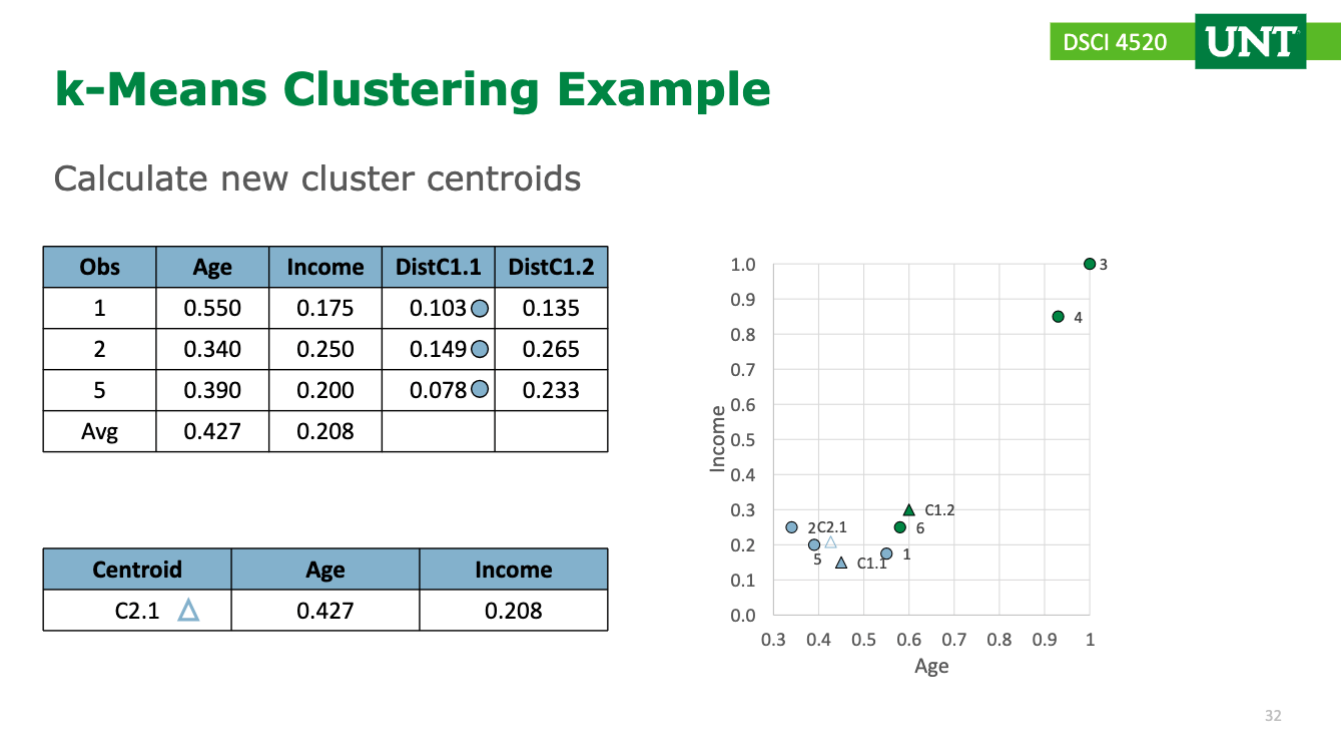
k - Means Clustering example
Randomly select two seeds as the
initial centroids
Assign each observation to
the closest centroid by calculating the distance between them
(Assign observations to clusters based on distance)
Recalculate cluster centroids by finding the average of the subject of the point: age for example)
Rinse and repeat until nothing moves
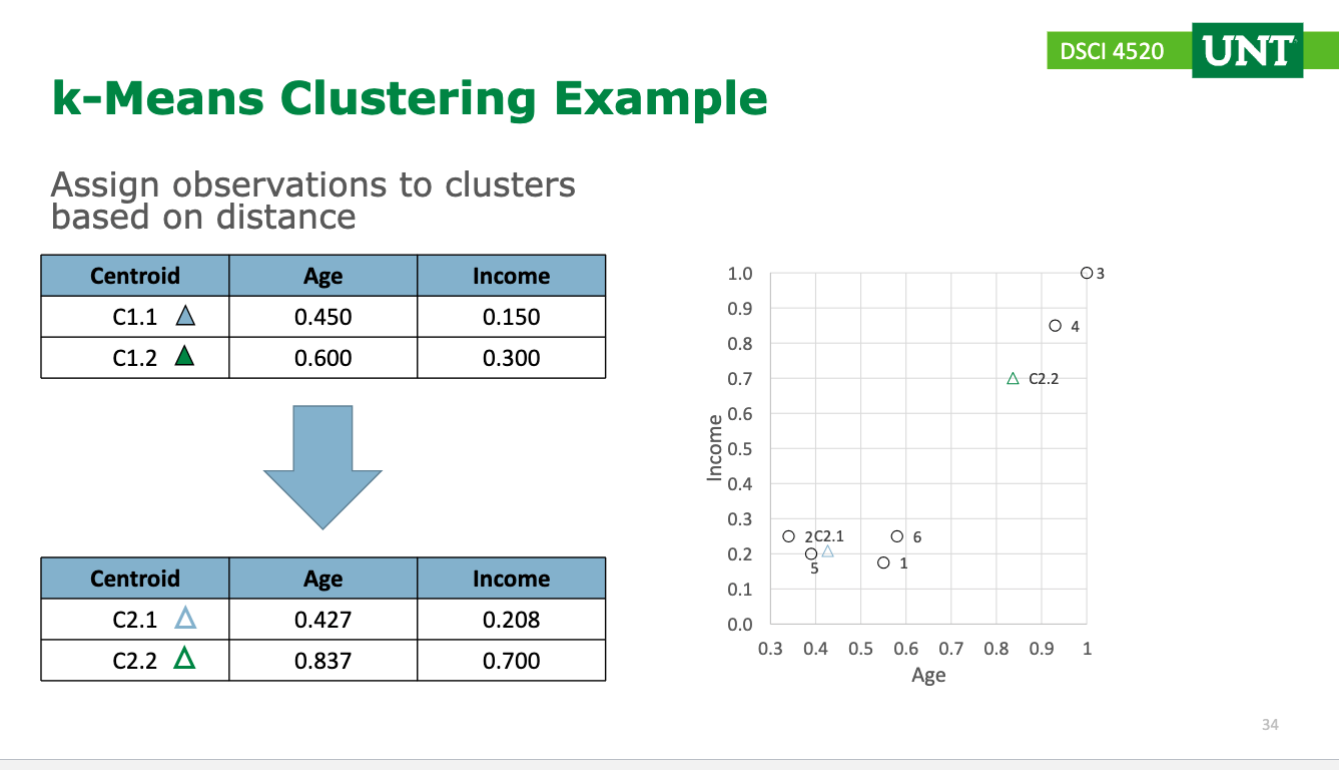
Cluster Centroid
The representative center of a cluster formed by calculating the average value across each variable for all observations assigned to that cluster.
Sum of Squared Errors (WSS)
cluster sums of squared errors- when you calculate the points within a cluster…and the more clusters there are, the less errors there are. It creates a chart that decreases and becomes gradually horizontal. You stop at the point where it decreases.
A measure of cluster compactness calculated by summing the squared distances between each data point and its assigned cluster centroid.