6. Training and Generalization
 Call Kai
 Learn
Learn Practice Test
 Spaced Repetition
 Match
Match Flashcards
 Knowt Play
1/44

There's no tags or description
Looks like no tags are added yet.
Name | Mastery | Learn | Test | Matching | Spaced | Call with Kai | Chat |
|---|
No analytics yet
Send a link to your students to track their progress
45 Terms
What is Generalization and why is it important in DL?
Generalization: model’s ability to make accurate pedictions on unseen data, not just its training examples
Training: Minimizes errors on observed data
Generalization: Measures how well the model performs on new data
→ A model have low training loss but poor generalization. Therefore, good training performance alone does not guarantee a useful model

What are training, validation, and test datasets?
3 different purposes:
Training → Learns model parameters (weight and biases)
Validation → Guides model development and hyperparameter selection
Test→ Evaluates final performance on unseen data
Validation data can be reused during development, but test data must remain untouched until final evaluation

What i the difference between supervised and unsupervised learning?
Supervised learning: use inputs pair with correct labels to learn mapping from inputs to outputs. Examples include classification and regression
Unsupervised learning: use inputs without explicit target labels to discover patterns, structures, or representations
How does the supervised learning process work?
Supervised learning follows a repeated cycle:
Dataset: Provides inputs and correct targets
Model: Produces predictions
Loss function: Measures differences between predictions and targets
Optimizer: Updates model parameters to reduce loss
→ Repeating this process improves performance on the training objective

What are the common examples of supervised learning ?
All use paired inputs and targets, but their output types and loss functions differ

What is the difference between classification and regression?
Classification: Predicts category or class, such as cat, dog, or spam
Regression: Peedicts a continuous numerical value, such as house price
→ Classification normally uses cross-entropy loss, while regression commonly uses mean squared error(MSE)

How does cross-entropy loss work for classification?
Cross-entropy penalizes the model when it assigns a low probability to the correct class
The model produces class scores(logits)
Softmax converts scores into probabilities
Cross-entropy measures the probability assigned to correct class
For example: L=−log(pcorrect)
higher correct-class probability means lower loss
p = 0.77 gives loss → 0.26
p = 0.10 gives loss → 2.30
Binary classification commonly uses binary cross -entropy

How does mean squared error(MSE) work for regression?
MSE measures the average squared difference between predictions and actual values
MSE=n1i=1∑n(yi^−yi)2
where:
yi^ : Predicted value
yi: Actual value
n: Number of examples
→ page 9: (2.8−3.5)2=(−0.7)2=0.49
Large errors receive stronger penalties because they are squared. Other regression loss can emphasize different error properties

What is regularization and how does it affect the total loss?
Regularization adds a penalty to discourage undesireable model complexity and help reduce overfitting
Ltotal=Ldata+λR(θ)
where:
Ldata : Prediction error
R(θ): Regularization penalty
λ: Controls regularization strength
→ Stronger regularization may reduce overfitting, but too much can cause underfitting
This applies to both classifications and regressions
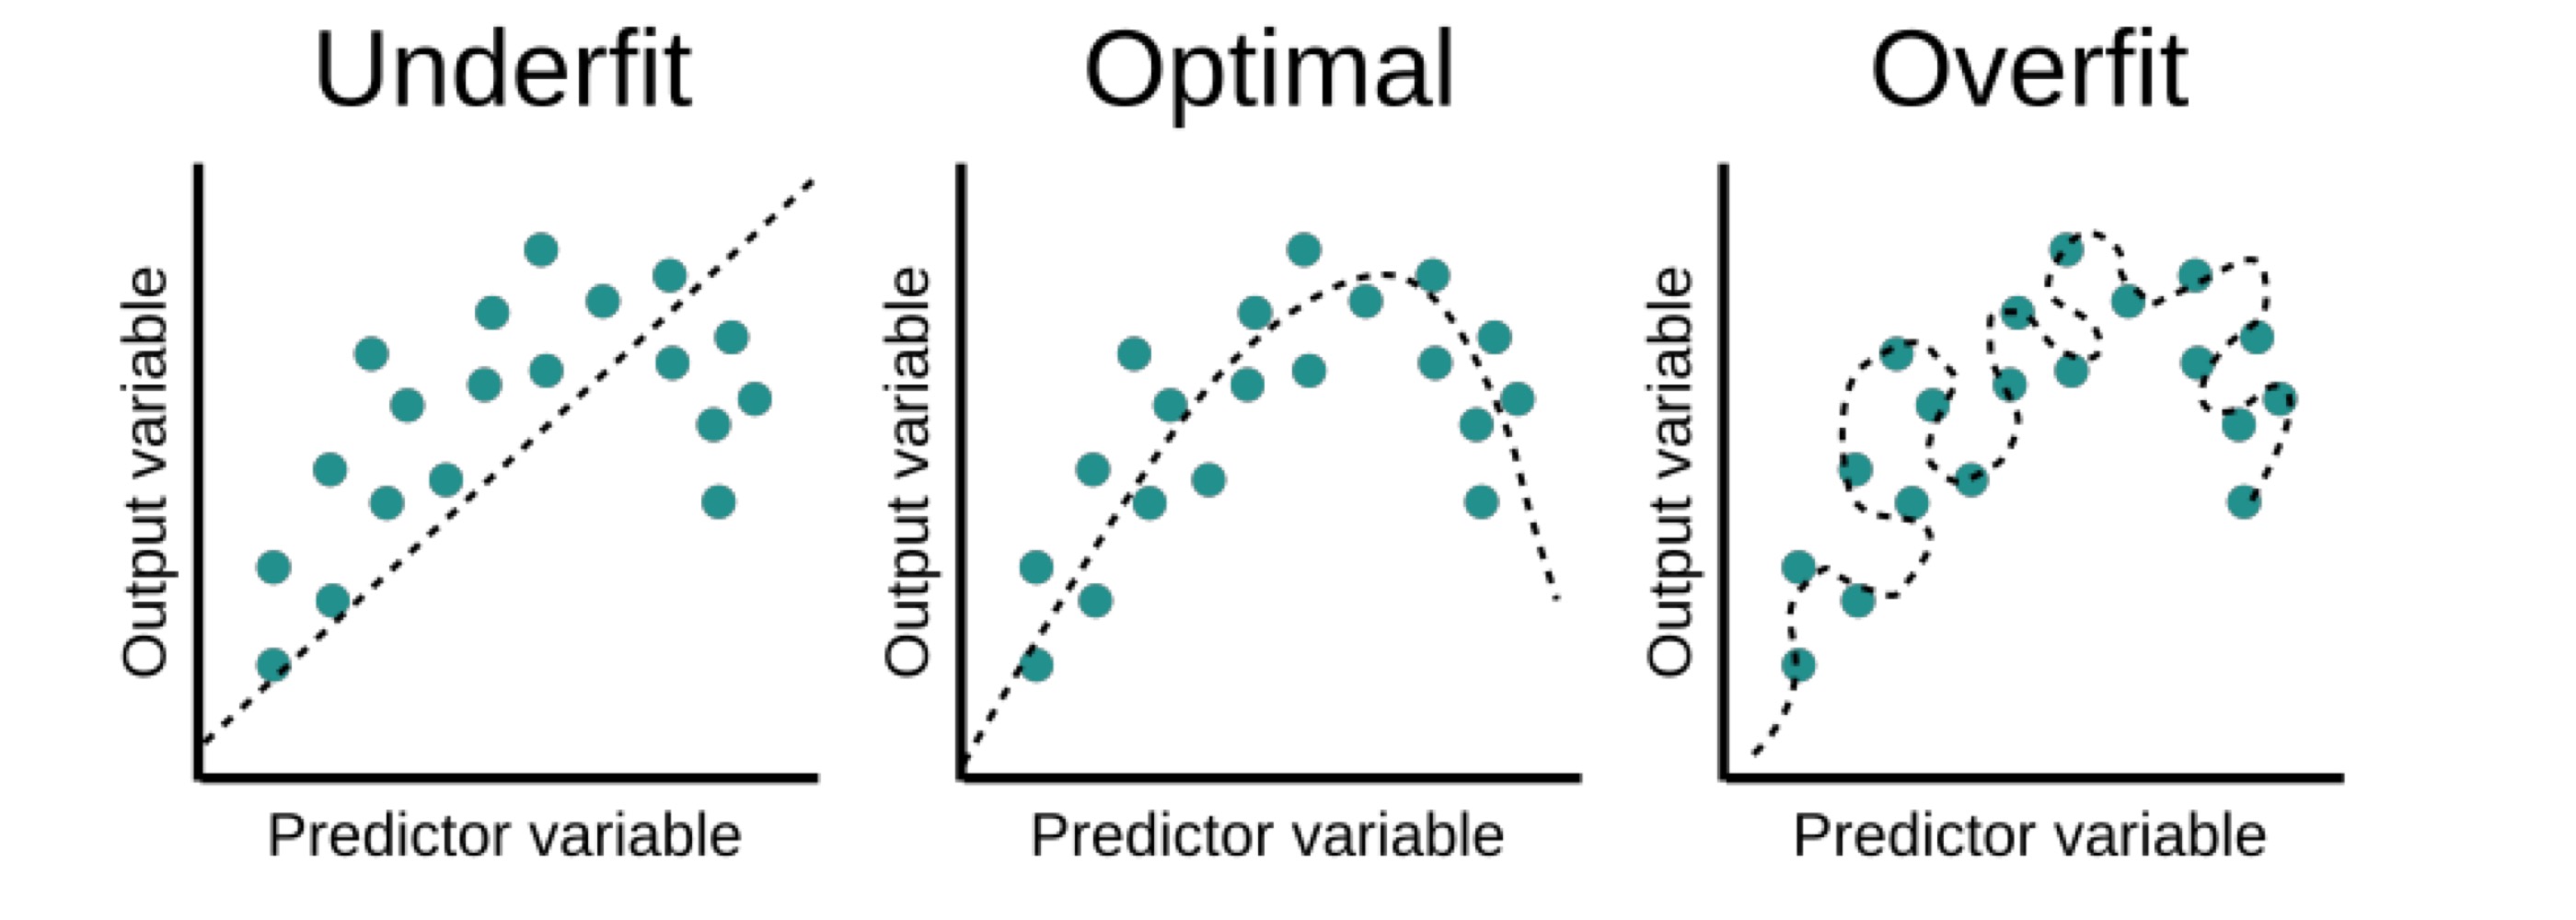
What is the difference between underfitting and overfitting ?
Underfitting:
Models learns too little
Poor performance and training
Poor validation performance
Often insufficient capacity
Overfitting!
Models adapt too closely to training data
Very good training performance
Poor validation performance
Often excessive effective capacity
→ Goal: to learn useful patterns that generalize , rather than memorise training examples

How does model capacity affect underfitting and overfitting?
Model capacity: how much complecity a model can represent or fit
Low effective capacity: May be unable to learn important patterns → causing underfitting
High effective capacity: Can fit complicated patternsbut may memorixe training data → causing overfitting
→ Regularization consrains effective capacity to help balance fitting and generalization
What is generalization gap and what does it indicate?
The generalization gap: difference between training and validation performance
For loss, it can expressed as: Gap=Lval−Ltrain
Large gap: Often indicates overfitting
Small gap: May indicate good generalization, but can also occur during underfitting
Therefore, examine both absolute performance and the gap

How can training and validation loss curves reveal underfitting and overfitting?
Underfitting: Both training and validation losses remain relatively high, often with a small gap
Overfitting! Training loss continues decreasing, while Validation loss stops improving or increasing
Healthy learning: Both losses decrease and remain reasonably close
→ page12 illustrates why low training loss alone is insufficient

Why is validation data considered development data?
Validation results influence decisions such as:
Hyperparameter selection
Model architecture
Training adjustments
Because validation data is reused , repeated tuning can overfit the validation set
→ this makes validation performance less independent over time, so a separate untouched test set is needed for final evaluation

What is data leakage, and why should the test set remain untouched?
Data leakage occurs when information that should be unavailable influences model training or development
For example, choosing hyperparameter based on test accuracy leaks test information into development
This can produce misleadingly high evaluation results
The test set should only be used after the model and its configuration are finalized

What are the different dataset splitting strategies?
The correct strategy depends on on the data
The split should reflect real deployment conditions to avoid misleading evaluation

How are Dataset and DataLoader are used in PyTorch?
Dataset: Stores or provides access to examples
DataLoader: Loads examples in mini-batches for traing or evaluation
Recommended DataLoader:
Training loader: ‘shuffle=True’
Validation loader: ‘shuffle=False’
Test loader: ‘shuffle=False’
Keep satasets separate and save split indices for reproducibility


How does the PyTorch dataset splitting example work?
This creates:
80% training data.
10% validation data.
10% test data.
‘manual_seed(42)’ makes the random split reproducible.
The three DataLoaders then use batch_size=64, with shuffling enabled only for training.

What is a baseline model and why is it important?
A baseline provides a reference for judging whether a model’s performance is useful
Examples:
Majority-class baseline: Always predicts the most common class
Simple model: Test whether a complex model is necessary
Previous model: Provides a historical comparison
A new model should demonstrate improvements relative to an appropriate baseline

What is a confusion matrix and what are TP, TN, FP, FN?
A confusion matrix organizes classification prediction into 4 outcomes:
TP: Correct positive prediction
TN: Correct negative prediction
FP: Incorrect positive prediction
FN: Incorrect negative prediction → missed positive example
These 4 values are used to calculate classification metrics

What is accuracy and how is it calculated?
Accuracy measures the proportion of all predictions that are correct
Accuracy=TP+TN+FP+FNTP+TN
Example: if 90 out of 100 predictions are correct
Accuracy= 90/100=90%
→ However, accuracy can be misleading for imbalanced datasets

What is precision and how is it calculated?
Precision measures how many predicted postive examples are actually positive
Precision=TP+TNTP
Example: if model predicts 10 positive cases, but only 8 are correct
Precision=8/10=80%
→ High precision means fewer false positive predictions

What is recall and how is it calculated?
Recall measures how many actual positive examples the model successfully identifies
Recall=TP+FNTP
Example: if there are 20 actual positive cases and model detects 15:
Recall = 15/20=75%
→ High recall means fewer positive cases are missed

What is the difference between precision and recall?
Precision:
Focuse on prdicted positives
Penalizes false positives
“How reliable are positive predictions?”
Recall:
Focuses on actual positives
Penalizes false negatives
“How many positives were found?”
Remember:
Precision→ Avoid false alrams
Recall→ Avoid missing positives

What is F1 score and how is it calculated?
F1 score combines precision and recall using their harmonic mean
F1=P+R2PR
P: Precision
R:Recall
Example: P=0.8 and R=0.6
F1=0.8+0.62(0.8)(0.6)=0.686
→ the result becomes high only when both P and R are reasonably strong

What is precision-recall trade off?
Changing the classification decision threshold can affect precision and recall differently
Lower threshold: Usually detects more positives, increasing recall but potentially adding false positives
Higher threshold: Usually reduces false positives, improving precision but potentially missing positives
F1 helps evaluates the balance between both metrics

How should we choose between accuracy, precision, recall, and F1 ?
Choose based on the cost of different errors:
Recall: Important when missing a positive is costly, such as medical screening
Precision: Important when false alarms are costly, such as automatic content removal
F1: Useful when balancing precision and recall
Accuracy: Useful dpfor overall correctness, but may hide class imbalance
The best metric depends on the application’s consequences

What is class imbalance, and why is it a problem?
Class imbalance occurs when some classes have many more examples than others
For example:
Majority class: 90%
Minority class: 10%
a model that always predicts majority class achieves 90% accuracy but 0% minority recall
Minority classes also contribut fewer training gradient signals
Therefore, evaluate per-class performance, not accuracy alone

How can class imbalance be handled?
3 approaches:
Oversampling method → Increases minority class example frequency
Undersampling method → Reduces majority class example frequency
Weighted loss → Changes how strongly each class contributes to loss and gradients
Sampling changes which examples appear in mini-batches, while loss weighting changes their influence during learning
→ Avoid applying multiple corrections mechanically

What is the difference between model parameters and hyperparameters?
Model parameters: Values learned from training data, such as weights and biases
Hyperparameters: Configuration choices set before or during model development
Example of hyperparameters:
Learning rate
Batch size
Model architecture
Regularization strength
What do the main training hyperparameters control
Learning rate → controls magnitude if parameter updates
Batch size→ controls number of examples per update
Model architecture→ controls model capacity
Regularization strength → controls constraints on learning
→ different choices can produce different trained models
How are hyperparameter selected?
Hyperparameters selection uses validation performance
Choose candidate configurations
Train a model for each configuration
Evaluate each model on validation data
Select the best configuration
Keep the test set untouched until final evaluation
→ page26 illustrates selecting the configuration with the strongest validation score

What is cross-validation and how does it work?
Cross-validation evaluates a model across multiple data splits to obtain more stable performance estimates
In 5-fold cross-validation:
Divide data into 5 folds
Train using 4 folds
Validate using the remaining fold
Repeat until every fold has been used for validation
Average the validation results
→ it is useful when data is limited, but repeated deep learning training increases computational cost

How can training curves help diagnose model performance?
Training curves show how loss changes across epochs
Training loss shows optimization progress, while validation loss indicates generalization behavior.

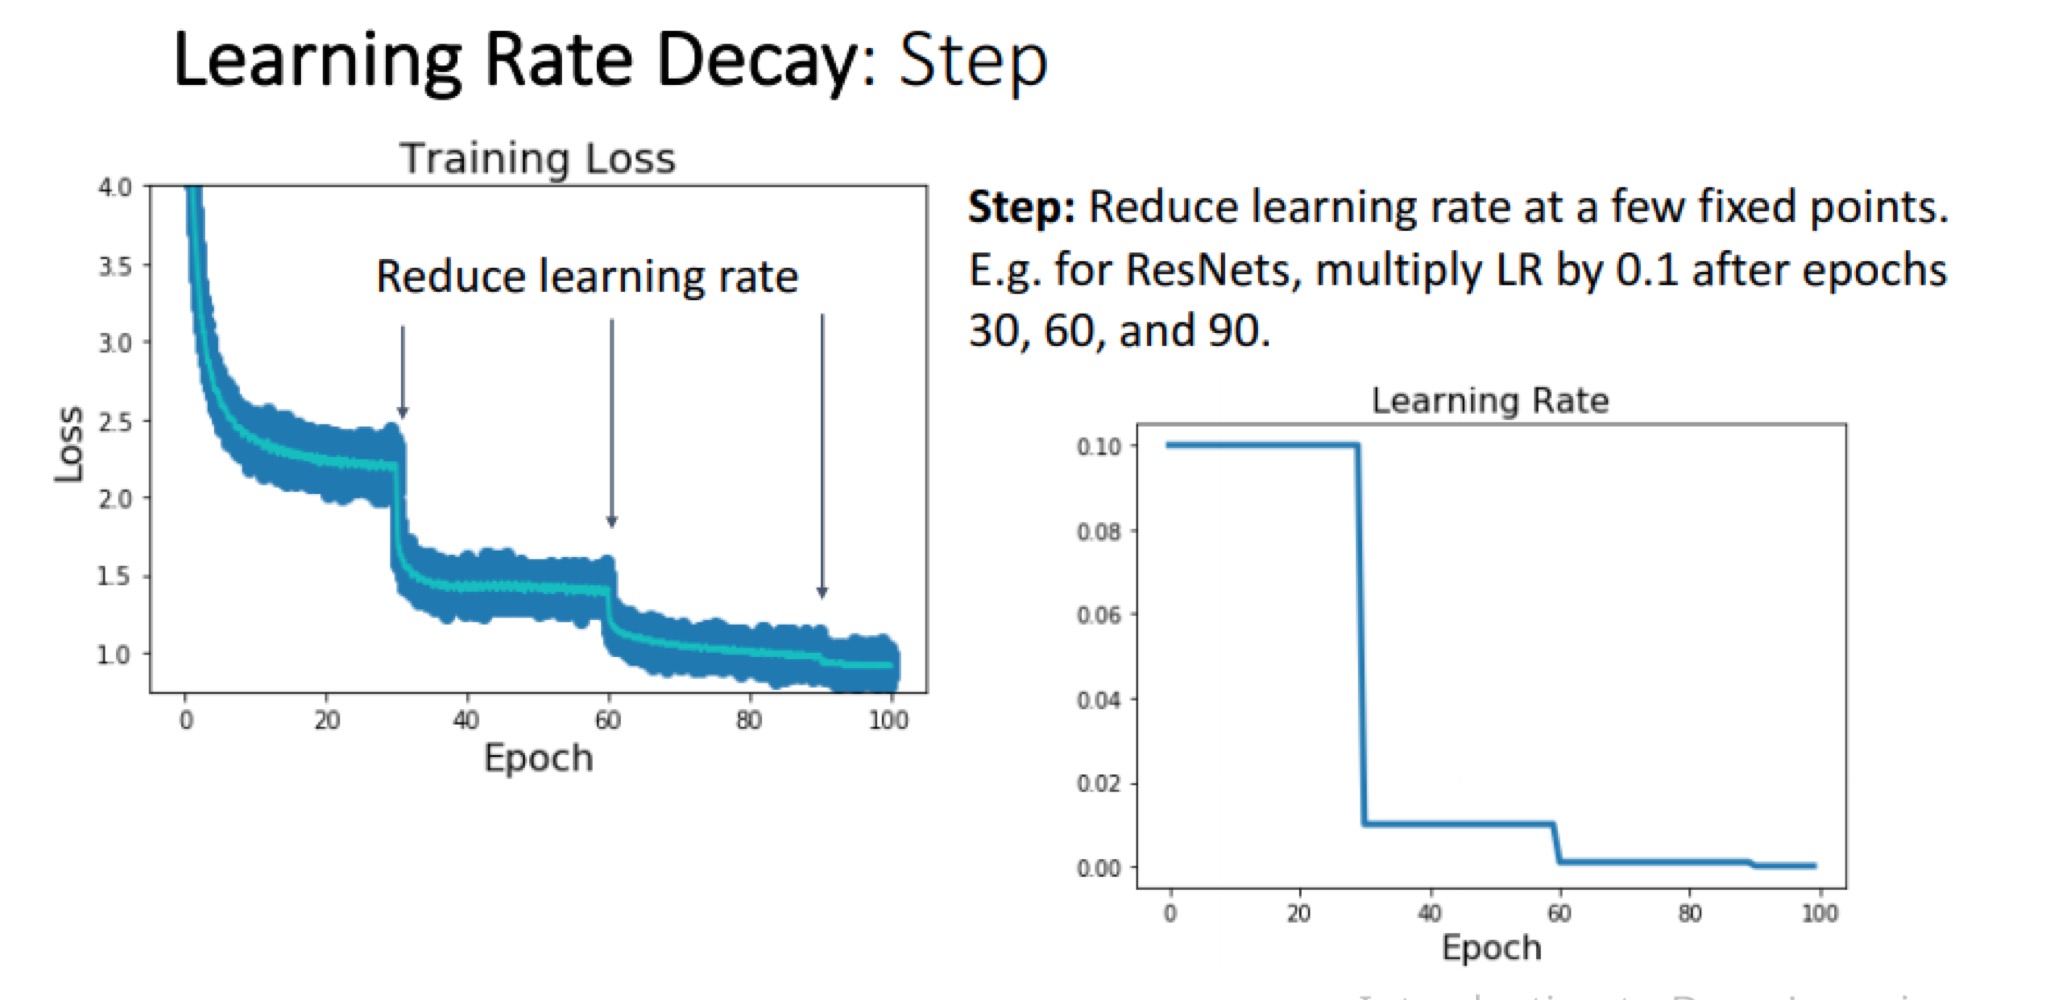
What is learning rate scheduling, and why is it useful?
Learning rate scheduling changes learning rate during training
Larger early updates: can speed up initial learning
Smaller later updates: allow finer adjustments
2 approaches:
Epoch-based: changes the learning rate according to training progress
Metric-based: changes it based on validation results
→ page29 illustrates step decay, where learning rate decreases at specified points
What is early stopping and how does patience work?
Early stopping ends training when validation performance stops improving for a sustained period
Patience specifies how long to wait before stopping
For example: patience=3 → training may stop after 3 consecutive validation checks without improvement
This prevents stopping bcs of temporary fluctuations and helps avoid unnecessary training
What is checkpointing and how should the best checkpoint be restored?
Checkpointing saves the model’s state during training
Best checkpoint: Model state with best selected validation performance
Last checkpoint: Model state from the final training epoch
→ The best midel may occur bfr training ends, so restore the best checkpoint bfr final testing
What sanity check should be performed before full training?
Sanity checks are small, inexpensive tests that detect problems before costly training
Recommended sanity check:
Data inspection: Check inputs and labels
Shape check: Verify tensor dimensions
Tiny dataset fit: Confirm model can intentionally overfit a small dataset
Gradients check: Verify gradents and parameter updates
→ Full training should begin only after these checks pass

Why should model intentionally overfit tiny datset during sanity checking?
A model should usually be able to fit a very small training dataset extremely well
If it cannot, there may be problems with:
Data or labels
Model implementation
Gradients calculation
Parameter updates
This is debugging test, not a recommendation to overfit the final model
What are the 5 main categories of training failure?
5 Causes:
Optimization: model fails to minimize training loss
Capacity: model cannot fit training patterns
Generalization: model fits training data but performs poorly on unseen data
Labels: incorrect or inconsistent supervision
Distribution: training data differs from deployment sata
→ Different failures require different solutions

How can optimization failure be identified?
Optimization failurd occurs when the model cannot successfully minimize its training objective
Coopmmon signs:
Training loss remains nearly constant
Loss diverges or oscillates strongly
Gradient vanish or explode
Parameters fail to update
Possible causes include inappropriate learning rates, grafients problems, or implementation errors

How can underfitting and overfitting be diagnosed and what causes them?
Underfitting: The model cannot fit training patterns sufficiently
Overfitting: The model fits training examoles but fails to generalize well

How can label problems and distribution shift cause poor performance?
Not all performance problems come from the model architecture
Label problems:
Incorrect labels: examples have wrong targets
Inconsistent labels: similar examples receive conflicting targets
Ambiguous labels: the correct target is uncertain
Distribution problems:
Training data may not represent real deployment inputs
Validation data may share the same collection bias
Distribution shift occurs when deployment data differs from training data, reducing real-world performance

What is reproducibility and how can a deep learning experiment be made reproducible?
Reproducibility means preserving enough information to reconstruct an experiment and verify its results
Importance practices include:
Save dataset versions and split definitions
Record model architecture and training configurations
Set and document random seeds when appropriate
Record software versions and environments details
Save the best checkpoints and evaluation outputs
Evaluate the selected model on untouched test data
Report enough information to reconstruct experiment
What are the key principles of reliable training and generalization?
Reliable deep learning depends on the entire experimental pipeline, not training accuracy alone.
Remember these principles:
Generalization: Unseen-data performance matters most.
Validation vs test: Validation guides development; test protects final evaluation.
Data leakage: Can make results misleading.
Metrics: Different metrics reveal different classification errors.
Training curves: Help diagnose learning failures.
Failure diagnosis: Different causes need different interventions.
Implementation: PyTorch pipeline choices affect experimental validity.
Reproducibility: Makes experimental conclusions more trustworthy.