Macroeconomics Topic 3 Part 2
 Call Kai
 Learn
 Practice Test
 Spaced Repetition
 Match
 Flashcards
 Knowt Play
1/29

Earn XP
Description and Tags
IS-LM Model
30 Terms
What does equilibrium in the goods market mean?
It means that total economic output (Y) equals total demand for goods (Z): Y=Z.
What does investment depend on and why?
Investment (I) isn’t a fixed number, it depends on:
Production/Sales (Y): Higher sales mean businesses invest more.
Interest Rate (i): Higher interest rates make borrowing expensive, so businesses invest less.
What is the full equation for investment?
Y=C(Y - T) + I( Y,i) + G
How would you demonstrate equilibrium in the goods market graphically?
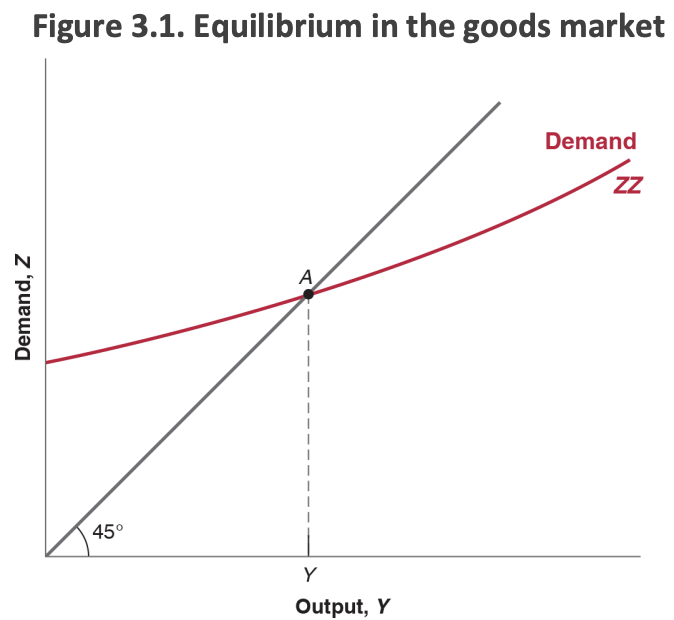
Why is the demand function increasing (curved)?
For 2 reasons:
An increase in output leads to an increase in income, and thus to an increase in disposable income. This leads to an increase in consumption.
An increase in output also leads to an increase in investment and sales.
What happens graphically when the interest rate increases? Why?

A higher interest rate leads to lower investment and lower demand: the demand curve therefore shifts downwards. Leading to the new equilibrium of A’.
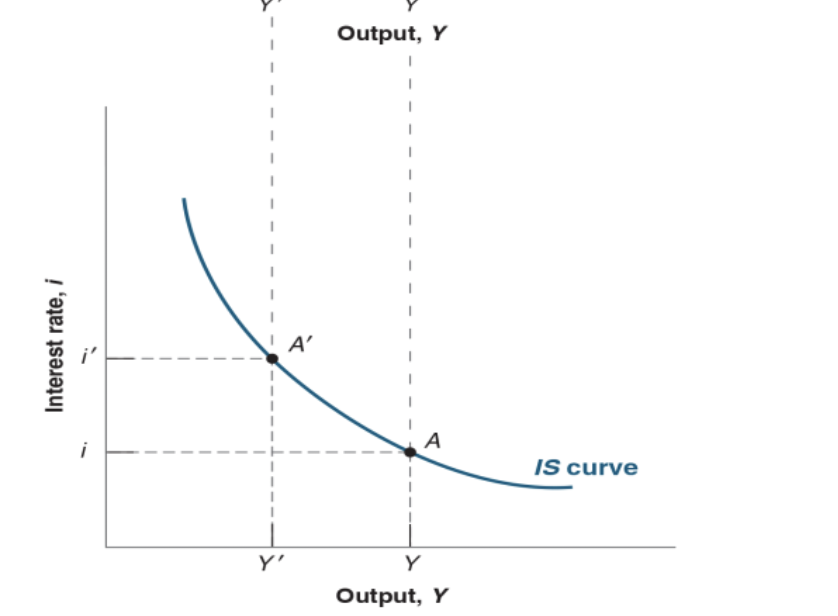
How would you compare the IS Curve and Equilibrium in the goods market graphically?

Using the figure at the top (a), we can find the equilibrium value of output associated with any value of the interest rate.
The figure at the bottom (b) represents the relation between equilibrium output and the interest rate.

How would you show the IS curve graphically?
The relation between the interest rate and output is represented by the downward-sloping curve in figure b: the IS Curve.
What factors shift the IS curve?
Changes in T (taxes) or G (government spending), or changes in consumer confidence, will shift the IS curve.
How do changes in taxes shift the IS curve?
The IS shifts left when taxes increase, government spending decreases or, when confidence falls.
It will shift to the right when taxes decrease, government spending increases or when confidence rises.

Why would the IS curve shift either left or right?
Changes in factors that decrease the demand for goods, given the interest rate, shift the IS curve to the left.
Changes in factors that increase the demand for goods, given the interest rate, shift the IS curve to the right.
What is the equation for the supply of money in equilibrium? Explain.
MS=$YL(i)
In equilibrium the supply of money must equal the demand for money.
What are the two factors that money demand depends on?
Income (Positive relation): When people earn more money, they carry out more transactions and therefore want to hold more money.
Interest Rate (Negative relation): When interest rates are high, people prefer to keep their wealth in assets that earn interest instead of holding money. The demand for money falls when interest rates rise.
What is the term for real money supply? What does it mean?
M/P.
M/P=YL(i)
It measures the purchasing power of the money supply rather than the number of euros in circulation.
What does this equation mean: $Y=YP?
This means that nominal GDP is equal to real GDP multiplied by the price level.
What approach do modern banks take to operating?
They choose the interest rate and then adjust the money supply as necessary to achieve that rate.
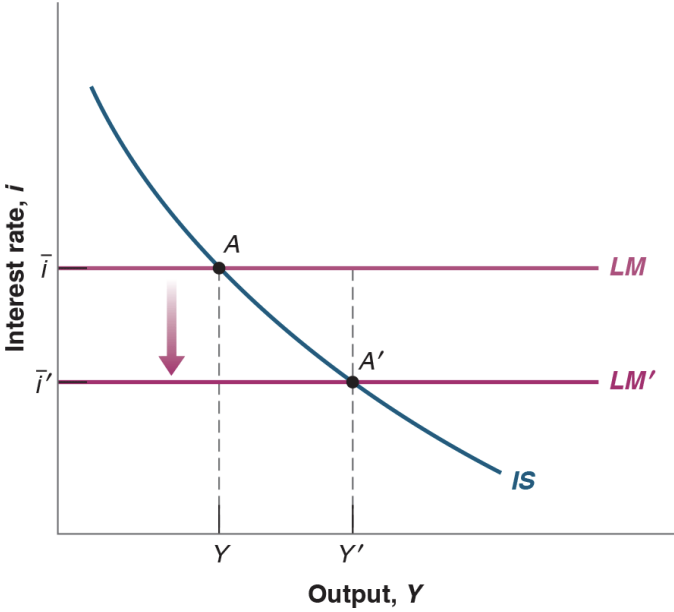
How would you represent the LM curve graphically? Why does it look like that?

It is a straight line because i is constant.
If output rises and people demand more money, the central bank simply increases the money supply so that the interest rate does not change.
What does the IS-LM curve look like? Explain the parts of the graph.

The IS curve shows all combinations of output and interest rates that keep the goods market in equilibrium.
The LM ‘curve’ shows the same thing, under the assumption that the central bank fixes the interest rates.
A indicates equilibrium between the goods market and the financial market.
What is a policy mix?
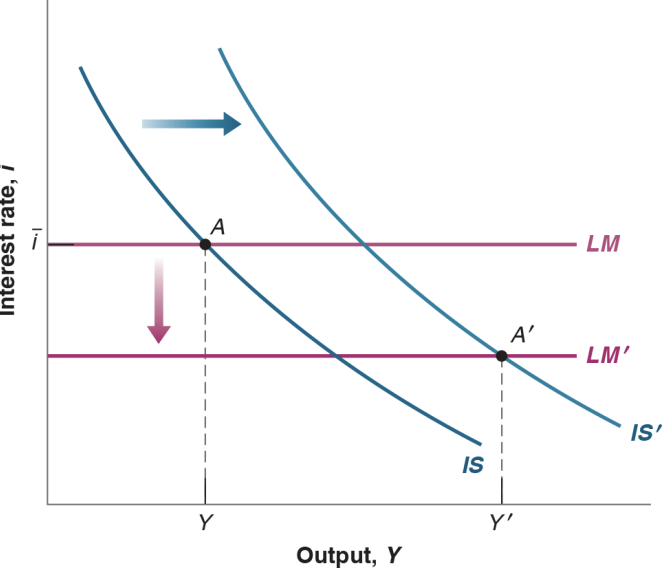
A policy mix occurs when fiscal policy and monetary policy are used together to influence economic activity.
What is monetary policy?
Monetary policy is conducted by the central bank through changes in interest rates.
What is fiscal expansion and how does it affect the IS curve?
This is when the government increases spending or reduces taxes.
The IS curve shifts to the right.
What is fiscal contraction and how does it affect the IS curve?
When the government reduces spending or increases taxes.
This causes the IS curve to shift to the left.
How can you show fiscal contraction graphically?

Explain what happens to production when the government increases tax.
When taxes rise, households have less disposable income.
As a result, consumption decreases.
As consumption is a component of aggregate demand, overall demand falls.
Firms will then respond to the lower demand by reducing production, leading to a fall in output.
What is a monetary expansion?
When the central bank lowers the interest rate, borrowing becomes cheaper.
Firms therefore increase investment spending, leading to aggregate demand rising and then output rising.
What is a monetary contraction?
This is where the central bank raises the interest rate, meaning borrowing becomes more expensive. Then, investment falls, aggregate demand falls and output decreases.
How would you show a monetary expansion graphically?
Show graphically what happens when expansionary fiscal policy and expansionary monetary policy are used together.
What is fiscal consolidation?
This refers to governmental actions designed to reduce budget deficits and slow the growth of public debt. Typical measures include:
Increasing taxes.
Reducing government spending.
How would you show fiscal consolidation and expansionary monetary policy graphically?
