Sampling
 Call Kai
 Learn
 Practice Test
 Spaced Repetition
 Match
 Flashcards
 Knowt Play
1/33

There's no tags or description
Looks like no tags are added yet.
34 Terms
Random Samples
Deterministic Sample:
Sampling Scheme doesn’t involve chance
Random Sample:
Before the sample is drawn, you have to know the selection probability of every group of people in the population
Not all individuals/ groups have to have equal chance of being selected
Simple Random Sample
A random sample in which:
every individual in the population has an equal chance of being selected
individuals are not replaced in the population before the next is drawn
selecting one individual doesn’t affect the probability of selecting another individuals
Sample of Convenience
example: sample consists of whoever walks by
just because you think you’re sampling “randomly”, doesn’t mean you gave a random sample
if you can’t figure out ahead of time
what’s the population
what’s the chance of selection, for each group in the population
then you don’t have a random sample
Probability Distribution
random quantity with various possible values
“Probability distribution”
all the possible values of the quantity
the probability of each of these values
Empirical distribution
“Empirical”: based on observations
Observations can be from repetitions of an experiment
“Empirical Distribution”
all observed unique values
the proportion of times each value appears
Law of Averages/ law of large Numbers
if a chance experiment is repeated many times, independently and under the same conditions, then the proportion of times than an event occurs gets closer to the theoretical probability of the event
As you increase the number of rolls of a die, the proportion of times you see the face with firve get closer to 1/6
Empirical distribution of a Sample
if the sample size is large
then the empirical distribution of a random sample with replacement
resembles the distribution of the population
with high probability
A statistic
Instead of always looking at histograms, sometimes we just want to summarize the histogram with a single number
Inference
Statistical Inference:
Making conclusions based on data in random sample
Ex: use the data to guess the value of an unknown (fixed) number create an estimate of the unknown quantity (depends on the random sample)
Parameter
A number associated with the population
Statistic
A number calculated from the sample
*A Statistic can be used as an estimate of a parameter
Probability Distribution of a Statistic
Values of a statistic vary because random samples vary
“Sampling distribution” or “probability distribution” of the statistic:
All possible values of the statistic,
and all the corresponding probabilities
Can be hard to calculate
Either have to do the math
Or have to generate all possible samples and calculate the statistic based on each sample
Empirical Distribution of a Statistic
Empirical distribution of the statistic:
Based on simulated values of the statistic
Consists of all the observed values of the statistic,
and the proportion of times each value appeared
Good approximation to the probability distribution of the statistic
if the number of repetitions in the simulation is large
Simulating Statistic (ex: United)
Define function
def sample_median (size):
return np.median(united.sample(size).column(‘Delay’))
sample_median = make_array()
for i in np. arange(1000):
new_median = sample_median(10)
sample_median = np.append(sample_medians, new_median)
Probability Sample
is one for which it is possible to calculate, before the sample is drawn, the chance with which any subject of elements will enter the sample
In a probability sample, all elements need nt have the same chance of being chosen
Simple Random Sample
is a sample drawn at random without replacement. Sampled individuals are not replaced in the population before the next individual is drawn.
to use np.random.choice for simple random sampling, you must include the argument replace = false
Convenience Samples
If you stand at a street corner and take as your sample the first ten people who pass by, you might think you’re sampling at random because you didn’t choose who walked by.
But it’s not a random sample – it’s a sample of convenience.
You didn’t know ahead of time the probability of each person entering the sample; perhaps you hadn’t even specified exactly who was in the population.
Empirical Distribution
The word “Empirical” means “observed”. Empirical distribution are distributions of observed data, such as data in random sample
A Probability Distribution
The histogram helps us visualize the fact that every face appears with probability 1/6. We say that the histogram shows the distribution over all the possible faced. Since all the bars represent the same percent change, the distribution is called uniform on the integers 1 through 6.
variables who’s successive values are separated by the same fixed amount, such as the value on rolls of a dies (successive value separated 1), fall into a class of variables that are called discrete.
the histogram is called a discrete histogram. its bins are specified by the array die_bins and ensure that each bar is centered over the corresponding integer value
The probability of each face is 1/6, which is 16.67% when rounded to two decimal places. The width of each bin is 1 unit. So the height of each bar is 16.67% per unit
*Theoretical probability of each face —- “probability distribution” and not based on observed data

Table menthod for random sample with replacement
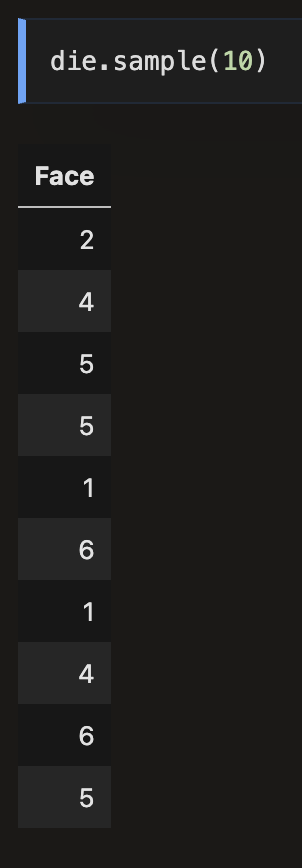
The table method Sample draws at random with replacement from the rows of a table.
Its argument is the sample size, and it returns a table consisting of the rows that were selected
Optional argument:
with_replacement = False — specifies that the sample should be drawn without replacement. But that does not apply to rolling a die
ex: die.sample(10)
Law of Averages
if a chance experiment is repeated independently and under identical conditions, then, in the long run, the proportion of times that an event occurs gets closer and closer to the theoretical probability of an event
Here “independently and under identical conditions” means that every repetition is performed in the same way regardless of the results of all the other repetitions.
Under these conditions, the law above implies that if the chance experiment is repeated a large number of times then the proportion of times that an event occurs is very likely to be close to the theoretical probability of the event.
Converfe of the Empirical Histogram of the Sample
For a large random sample, the empirical histogram of the sample resembles the histogram of the population, with high probability
The idea is that since a large random sample is likely to resemble the population from which it is drawn, quantities computed from the value in the sample are likely to be close to the corresponding quantities in the population
Parameter
Frequently, we are interested in numerical quantities associated with a population.
in a population of voters, what percentage will vote for candidate A
In a population of Facebook users, what is the largest number of Facebook friends that user has
In a population of United flights, what is the median departure delay
Numerical quantities associated with a population are called parameters.
ex: for the population of flights in united, we know the value of the parameter “median delay”
Statistic
In many situations, we will be interested in figuring out the value of an unknown parameter. For this we will rely on data from a large random sample draw from the population
*A statistic is any number computed using the data in a sample. The sample median, therefore is a statistic
The statistic could have different. A fundamental consideration is using any statistic based on a random sample is that the sample could have come out differently, and therefore the statistic could have come out differently too
Just how different could the statistic have been?
One way to answer this is to simulate the statistic many times and note the values. A histogram of those values will tell us bout the distribution of the statistic
Simulating a Statistic
Overview: We will simulate the sample median using the steps we setup in an earlier chapter when we started studying simulation. You can replace the sample size of 1000 by any other sample size, and the sample median by any other statstic
Step 1: Decide which statistic to simulate. We have already decided that: we are going to simulate the median of a random sample of size 1000 drawmn from the population of flight delays
Step 2: Define a function that returns one simulated value of the statistic. Draw a random sample of size 1000 and compute the median of the sample.
def random_sample_median():
return np.median(united.sample(1000).column(‘Delay’))
Step 3: Decide how many simulated values to generate. Lets do 5,000 repetitions
Step 4: use a for loop to generate an array of simulated values. As usual, we will start by creating an empty array in which to collect our results. We will then set up a for loop for generating all the simulated values. the body of the loop will consist of generating one simulated values of the sample median , and appending it to our collection array
medians = make_array()
for i in np.arange (5000)
median = np.append (medians, random_sample())
Visualization
Table:
simulated_median = Table().with_column(‘Sample Median’, median)
Histogram:
simulates_medians.hist(bins = np.arange(0.5,5,1))
you can see that the sample median is very likely to be about 2, which was the value of the population median. Since samples of 1000 flight delays are likely to resemble the population of delays, it is not surprising that the median delays of those samples shelf be closer to the median delay in the population

Simple Random Sample
sample at random with out replacement (with_replacement = False)
If you are sampling from a population of individuals whose data are represented in rows of a table, use
use the table method: sample
If you are sampling from a population of individuals whose data are represented as an array, use
use: np.random.choice
Default: with replacement
#the faces of a die, as an array
faces
array (1,2,3,4,5,6])
#7 rolls of the die
np.random.choice(faces,7)
array([4,1,6,3,5,4,6])
The argument replace = False allows you yo get a simple random sample, that is, a sample drawn at random without replacement
Sampling from a Categorical Distribution
Sometimes we are interested in a categorical attribute of our sampled individuals. For example, we might be looking at whether a coin lands heads or Tails. Or we might be interested in the political parties of randomly selected voters
In such cases, we frequently need the proportions of sample voters in the different categories
Sample_proportions
It is tailored for sampling at random with replacement from a categorical distribution and returns the proportions of sampled elements in each category.
The sample_proportions functions function takes two arguments:
the sample size
the distribution of the categories in the population, as a list or array of proporotions that add up to 1
It returns an array containing the distribution of the categories in a random sample of the given size taken from the population. That’s an array consisting of the sample proportions in all the different categories, in the same order in which they appeared in the population distribution.
Example using Sample_proportions
For example, suppose each plant of a species is red-flowering with chance 25%, pink-flowering with chance 50%, and white-flowering with chance 25%, regardless of the flower colors of all other plants. You can use sample_proportions to see the proportions of the different colors among 300 plants of the species.
# Species distribution of flower colors:
# Proportions are in the order Red, Pink, White
species_proportions = [0.25, 0.5, .25]

sample_size = 300

# Distribution of sample
sample_distribution = sample_proportions(sample_size, species_proportions)
sample_distribution
array([0.24333333, 0.50333333, 0.25333333])
sum(sample_distributions)
1
The categories in species_proportions are in the order Red, Pink, White. That order is preserved by sample_proportions
If you just want the proportion of pink-flowering plants in the sample, you can use item
sample_distribution. item(1)
0.503333333