Microeconomics : 1.2 How markets work
 Call Kai
 Learn
 Practice Test
 Spaced Repetition
 Match
 Flashcards
 Knowt Play
1/48

There's no tags or description
Looks like no tags are added yet.
49 Terms
What is meant by rational decision making? In terms of consumers and firms?
a form of behavioural economics that helps fills gaps in knowledge for traditional economics
consumers aim to maximise their utility
whilst firms or producers aim to maximise profit
How would producers aim to maximise profit?
producers aim to maximise profit
therefore rational producers would increase the price of their goods or services to increase revenue and thus potentially increase profits
Define what is meant by maximising consumer utility
the total satifaction received from consuming a good or service
consumers aim to maximise utility by getting good value for money
therefore if the price of a product increases
rational consumers would opt for cheaper alternatives to maximise their utility
What is the bounded rationality model ?
The assumptions of this model are:
The first alternative that is satisfactory is selected
The decision maker recognises that they perceive the world as simple
The decision maker recognises the need to be comfortable making decisions without considering every alternative
Decisions could be made by heuristics.
Heuristics simplify the decision making process to come to a reasonable decision. They are shortcuts to avoid taking too long to make the decision, and they avoid the problem of having imperfect information or limited time.
Define what is meant by demand, draw the graph for a demand curve
demand - the quantity of goods and services consumers are willing and able to purchase in a given time and at a given price
curve shows that as the price of the product increases the quantity demanded decreases
curve slopes downwards = the inverse relationship between price & quantity

Draw and label the two types of movement along the demand curve and explain the cause
expansion - from A to B due to a price decrease = quantity demanded increases
contraction - movement along the curve from C to B due to a price increase = quantity demanded decreases
movements along a demand curve are only affected by price factors

Draw and label the two types of shift on the demand curve and explain their cause
increase - always shown by a shift to the right (outwards)
decrease - always shown by a shift to the left (inwards)
population - increase in population = increase in quantity demanded
income - for most goods, when income increases quantity demanded increases as people can afford to buy more / however for income elacticity of demand, the quantity demanded for products decreases even when income increases
trends and tastes - increase in trends = increase in quantity demanded
related goods - complements or subsitutes = a change in the price of another good can cause a shift in the demand curve —→ substitues prices may increase = demand for prodcut increases / complement price may decrease = increase in demand for product increases
advertising - increase in advertising = increase in brand or product awareness hence demand is likely to increase

How does diminishing marginal utility affect the demand curve?
assume consumers behave rationally
the satisfaction derived from the consumption of an additional unit of a good will decrease as more of a good is consumed
thus the demand curve slopes downwards: if more of a good is consumed, there is less satifaction derived from the good —→ consumers are less willing to pay high prices at high quantities due to less satisfaction gained
Define what is meant by supply, draw the graph for a supply curve
supply - the quantity of good and services supplied by a firm at a given time and a given period
curve shows that as the price of a product increases the quantity supplied decreases
curve slopes upwards = to show a positive direct relationship between price and quantity supplied

Draw and label the two types of movement along the supply curve and explain the cause
extension - from A to B as the quantity supplied rises due to an increase in price
contraction - from A to C as the quantity supplied falls because of a decrease in price
movements occur along a supply curve are only affected by prive factors

Draw and label the two types of shift on the supply curve and explain their cause
increase - always shown by a shift to the right
decrease - always shown by a shift to the left
cost of production - decrease in the cost of production would increase the quantity supplied
new technology - increase in quantity supplied —→ as there are better capital goods and so better quality machinery hence increased productivity
taxes - increase in the cost of production = a decrease in the quantity supplied as there are higher total costs so a lower profit
weather - (agricultural goods) quantity supplied is affected by weather conditions e.g dorughts would likely impede supply
introduction of a subsidy - a grant / loan that does not need to be paid back —→ decrease in the cost of production = increase in quantity supplied

How does rising marginal costs affect the supply curve?
To increase production, you will need to use up more resources which will cost more
the only way to do this is that you should receive more money (increased revenue or capital e.g a subsidy)
this assumes that the cost of producing a unit increases as output increases
Define what is meant by the price mechanism
can be defined as how the free market (free of government intervention) is controlled by market forces of supply and demand
i.e the invisible hand - referenced by Adam Smith allocates resources efficiently resulting in an equilibrium
where supply = demand.
State and explain the three functions of the price mechanism?
SIR:
signal
incentive
ration
Explain the function of the price mechanism in terms of signal
the price mechanism acts as a signal to where resources should be allocated
when prices rise, this signals to producers to enter the market as it means a higher chance of making profit → hence an extension in supply (increase in supply)
when prices rise, this signals to consumers a decrease in the utility of their money and thus would result in a contraction in demand
Explain the function of the price mechanism in terms of incentive
the price mechanism acts as an incentive for both consumers and producers dependng on the change in equilibrium
an increase in price, creates an incentive for producers to increase supply due to a greater profit incentive as they aim to maximise profit
a increase in price, creates a disincentive for consumers to purchase goods and services as the incentive to maximise their utility decrease.
Explain the function of the price mechanism in terms of ration
the price mechanism is a way of rationing scarce goods
this is because when price increases only those who are able to afford to buy the product will purchase it whilst others may no longer have the desire to buy the good
if there is a surplus, then price falls and so more consumers can afford to buy them
Draw and label a diagram to show excess demand
excess demand occurs when the demand is greater than the supply
it occurs when price is too low or when demand is too high - hence leading to disequilibrium due to the misallocation of resources

Describe and explain how markets would respond to a disequilibrium in terms of excess demand
market response: suppliers increase prices
this causes a contaction in quantity demanded, as an increase in price signals to consumers a decrease in their utility therefore the incentive to purchase the product decreases. —→ this results in the rationing of resources as only those who can afford to purchase it would purchase it
this causes an extension in quantity supplied as it signals to suppliers that there would be a greater profit incentive when selling at higher prices
ultimately reaching market equilibrium

Draw and label a diagram to show excess supply
excess supply occurs when the suuply is greater than the demand
it can occur when prices are too high or when demand falls unexpectedly

Draw and explain how markets would respond to a disequilibrium in terms of excess supply
market response: suppliers decrease price
this causes a contraction in the supply curve, as this signals to suppliers that there is a smaller profit incentive when selling at lower prices, as a result less firms would enter the market
this causes an extension in the demand curve, as this signals to consumers an opportunity to maximise their utility, hence a greater incentive for the usefulness of their money
ultimately reaching market equilibrium

Define the term consumer surplus and draw how you would illustrate it on a graph
consumer surplus is the difference between the price the consumer is willing to pay and the price that they actually pay, set by the price mechanism.

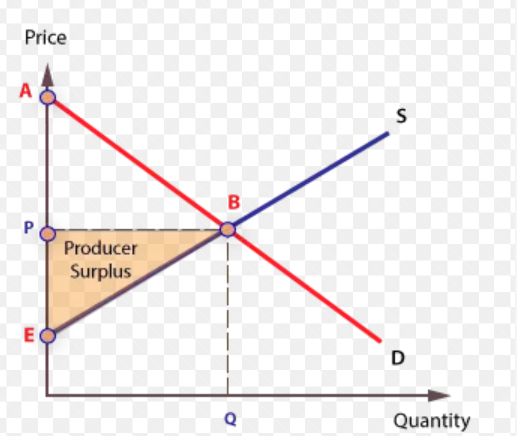
Define the term producer surplus and draw how you would illustrate it on a graph
producer surplus is the difference between the price that producers are willing to sell for and the price they actually sell at, set by the price mechanism.

State and explain the impact on consumer surplus from an increase or decrease in supply
draw a diagram to illustrate this
when supply decreases consumer surplus also decreases, so would move from ABP1 to ADP2 as shown in the diagram. this is because:
price increased, therefore consumers have a smaller incentive to purchase the product
the quantity supplied decreases
vice versa for an increase in supply

State and explain the impact on producer surplus from an increase or decrease in supply
draw a diagram to illustrate this
when supply decreases producer surplus also decreases, so would move from 0BP1 to CDP2 as shown in the diagram. this is because:
price increased, so less consumers are willing to pay a higher price so profit decreases.
the quantity supplied decreased so decreased profit


State and explain the impact on consumer surplus from an increase or decrease in demand
draw a diagram to illustrate this
an increase in demand results in an increase in consumer surplus, as shown on the diagram, this is because:
the quantity demanded increases, thus the price increases, creating a temporary shortage —→ thus the equilibrium price increases
consumer welfare also increases


State and explain the impact on producer surplus from an increase or decrease in demand
draw a diagram to illustrate this
when there is an increase in demand, there is an increase in producer surplus, as shown on the diagram. this is because:
the quantity supplied increases, at higher prices therefore there is a greater profit incentive to increase supply

Define the term PED or price elasticity of demand and write the equation to work out PED
this is the responsiveness of demand to a change in the price of a good

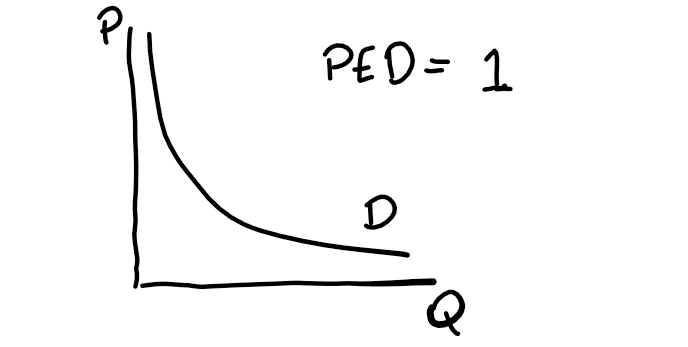
Define what is meant by unitary elastic PED and draw a demand curve to illustrate what it looks like
unitary elastic PED is where PED = 1 —→ this shows that the quantity demanded changes by exactly the same percentage as a change in price
quantity demanded is neither responsive or unresponsive as the percentage change is proportional
total revenue remains the same when price changes
Define what is meant by relatively elastic PED and draw a demand curve to illustrate what it looks like
relatively elastic PED is where PED > 1 —→ this shows that the % of quantity demanded changes by a larger % than the change in price
hence the quantity demanded is relatively responsive to a change in price e.g a decrease in income would decrease the demand for luxury or normal goods

Define what is meant by realtively inelastic PED and draw a demand curve to illustrate what it looks like
relatively inelastic PED is where PED < 1 —→ this shows that the % of quantity demanded changes by a smaller % than the change in price
hence the quantity demanded to relatively unresponsive to a change in price e.g goods that take a small proportion of their income

Define what is meant by perfectly elastic PED and draw a demand curve to illustrate what it looks like
perfectly elastic PED is where PED = infinity —→ this shows that even when the is absolutely no % change in price that quantity demanded changes significantly
hence the quantity demanded is highly responsive even when there is no change in price

Define what is meant by perfectly inelastic PED and draw a demand curve to illustrate what it looks like
perfectly inelastic PED is where PED = 0 —→ this shows that a change in price has no effect on output or quantity demanded
hence the quantity demanded is completely unresponsive to a change in price

State the six factors affecting PED
N.A.S.B.I.T
Necesity
Addictive
availability of Substitutes
Brand loyalty
proportion of Income
Time (long run/ short run)
Explain how the factors necesity and addictive influence the PED
necesity - demand curve will be inelatic as consumers are unresponsive to a change in price as the product is needed e.g milk or bread
addictive - demand curve will be inelastic as no matter how high the change in price is, people are still willing to buy the good to fulfill their addiction e.g coffee, cigarettes
Explain how the factors: substitues and proportion of income influence the PED
availability of substitutes - if a product has a lot of substitutes, consumers will switch to other products when prices increases —→ thus PED is elastic as quantity demanded is responsive to a change in price.
If there are no substitues, then the demand curve will be inelastic as even if prices go up, people will have to buy the product as there are no alternatives
proportion of income - if a good/ service represents a very small % of consumer’s income, a significant increase in price would have a small change on quantity demanded —→ it is unresponsive so is inelastic
Explain how the factors: brand loyalty and time influence the PED
brand loyalty - if a firm has good brand loyalty (good customer base e.g cadbury), then the good/service is likely to be inelastic —→ change in price wouldn’t have a large change in quantity demanded as relationships and loyalty has been built
time - in the long run, it is easier for the consumer to find an alternative product so is elastic change in QD > change in P. in the short run, many goods are inelastic as consumers may not even notice the price difference or are in an emergency e.g travel
State what is meant by:
an inferior good
a normal good
a luxury good
and give examples of each of the following
inferior good - goods for which demand decreases as consumer income increases (as people switch to better-quality alternatives). e.g tesco branded cereal
a normal good - goods for which demand increases as consumer income increases e.g kellogs cereal
luxury goods - a type of normal good whereby when incomes rise, consumers spend a larger proportion of their extra income on these goods; when incomes fall, demand drops sharply. e.g porsche cars, iphones
Define the term YED or income elasticity of demand and write the equation to work out YED
this is the responsiveness of demand to a change in income of consumers

Draw and explain the YED for an inferior good
YED < 0 —→ this is because demand decreases when income increases as consumers can afford to purchase better quality products

Draw and explain the YED for a normal (necesity) good
YED is between 0-1 —→ normal goods are income inelastic as demand is unresponsive / less responsive to a change in income
this is because the product is needed by consumers so regardless of the decrease in income consumers are still willing to purchase the product
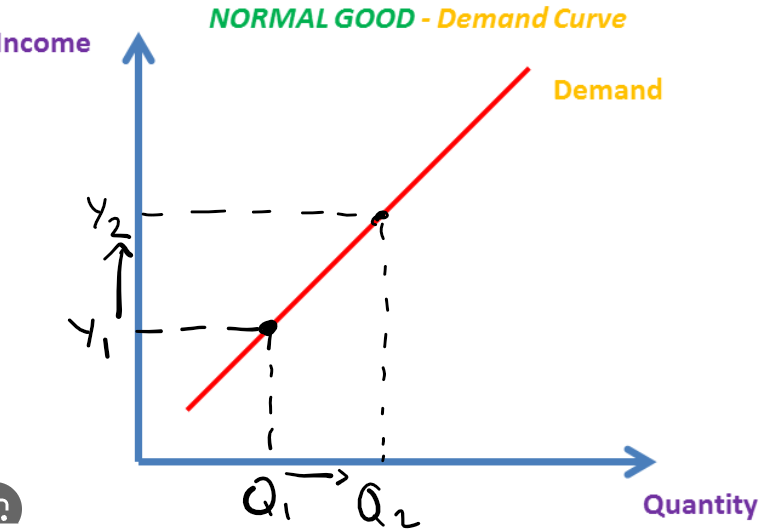
Draw and explain the YED for a normal (luxury) good
YED > 1 —→ this is because quantity demanded increases by a greater percentage than an increase in income, so it is income elastic
hence demand is relatively more responsive to a change in income

Define the term XED or cross price elasticity of demand and write the equation to work out CED
cross elasticity of demand measures the responsiveness of the change in quantity demanded for good A to a change in the price of good B

Draw the graph and explain the cross elasticity of demand for complementary goods
the XED for complementary goods is negative (XED< 0)
as as the price of one good increases the quantity demanded by it’s complement would decrease
for close complements a small fall in the price of good X leads to a large increase in the QD of Y - so the XED value would be fruther away from 0
for weak complements a large fall in price of good X leads to a small increase in QD of X - so the XED value would be closer to 0

Draw the graph and explain the cross elasticity of demand for substitute goods
the XED for substitute goods is positive (XED > 0)
as the price of good A increases, the demand for good B would also increase
for strong substitutes a small increase in the price of good A leads to a large increase in QD of B, so the XED value is further away from 0
for weak substitutes a large increase in the price of good A leads to a smaller increase in the QD of B, so the XED value is closer to 0

Draw the graph and explain the cross elasticity of demand for independent / unrelated goods
the XED for unrelated goods is 0 —→ this is because a change in the price of good A leads to little or no change in the quantity demanded of B
Why would firms be interested in the XED value of it’s products?
allows them to see how many competitors they have.
Therefore, they are less likely to be affected by price changes by other firms, if they are selling complementary goods or substitutes.
Describe the impact of an inelastic PED on total revenue when the price is increased
when price is increased, the total revenue also increases, this is because demand is unresponsive to a change in price
therefore a change in price would lead to a smaller change in quantity demanded

Describe the impact of an elastic PED on total revenue when the price is increased
when price is increased, the total revenue also increases, this is because demand is very responsive to a change in price
therefore a change in price would lead to a larger change in quantity demanded
