Math 105 Exam
 Call Kai
 Learn
Learn Practice Test
 Spaced Repetition
 Match
Match Flashcards
 Knowt Play
1/47

There's no tags or description
Looks like no tags are added yet.
Name | Mastery | Learn | Test | Matching | Spaced | Call with Kai | Chat |
|---|
No analytics yet
Send a link to your students to track their progress
48 Terms
Function
This is a rule that takes numbers as inputs and assigns to each input number exactly on output number. The output is a function of the input
Therefore in math this is a relationship between two quantities.
If the value of the first quantity determines exactly one value of the second quantity, we say the second quantity is a function of the first.S
What are inputs and outputs also called
Inputs and outputs are also called variables
Mathematical models
This is what a function is called when we use it to describe a situation.
For example, the Formula T = 1.4R + 40 is a _______ ______ of the relationship between the temperature and the crickets chirp rate. Such models can be powerful tools for understanding phenomena and making predictions.
In everyday language, saying that T is a function of R suggest that making the cricket chirp faster somehow makes the temperatures change. Clearly this is not the case. In Mathematic, saying that the temperature “depends” on the chip rate means only that knowing the chip rate is rate is sufficient to tell us the temperature.
Function Notation
To indicate that a quantity Q is a function of a quantity t, we abbreviate using this and write, what is in the image.
Thus applying the rule f to the input value gives the output value f(t), which is a value of Q.
Here Q is called the dependent variable and t is called the independent variable.

What functions can be defined by
not all function can be repressed by formulas. Some are given only by tables or graphs.

When is a relationship not a function
It is possible for two quantities to be related and yet neither quantity be be a function of the others.
In this case this is when one x-value corresponds to exactly ONE y-value. This means that if one x-value has more than one y-value It is not a function.
We can test this by doing the vertical line test in which a vertical line runs straight through the function on a graph and if it crosses two points that means it is not a function (because it has more than one output for a given input)

Average Rate of change
How we calculate the average rate of change for a set of given points would be the:
(Change in Units sold) / (Change in time)
(Change in y-values) / (Change in x-values)

Interpretation for the average rate of change
How we interpret the average rate of change would be:
For example in a instance in which the sales of smart phones is a function of the change in time in years, and we calculated the average rate of change we would interpret it as:
Thus, the number of smartphones sold has increases on average by 260.3 million units per years between 2012 and 2015 (makes sure to be specific and include average)
The structure:
From (starting x-value) to (ending x-value), (Context of output/dependent variable) (Increased/decreased) at an average rate of (numerical value) (output units) per (input unit)
(For example, Between the years of 2005 and 2010, the number of acres of wetlands in Alabama decreased at an average rate of 2.2 acres per year.
What Not to do:
Do not drop the qualifier “on average”
Do not double up negative words “if you say decreases, drop the negative sign from the number”
Do not forget he units (for example dollars per televisions, or miles per hour)
Do not confused it with “average value” As average rate of change measures how fast the output rises or falls over an interval, where’s average value clcueld the mean height of the function over that interval.
However, we drop the word average and instead talk about the rate of change over an interval
When we would do this if the phrase is “over the interval” completely replaced the need for the word “average” as the boundary points tell you mathematically that is has to be an average
When the function is a straight line (linear) the rate of change never changes. because it is perfect constant, the “average “ rate of change over an interval is exactly the same as the rate of change at any single point. In this case you can just say “the rate of change”
Increasing and Decreasing functions implication of their average rate of changes
if a function (Q = F(t)) for the t in the interval a <= t <= b is an increasing function, that means the as the values of f increases as t increases in this interval. This means that the graph of f rises when read from left to right and the average rate of change of Q with respect to t is positive on every interval
If f is a decreasing function if the values of f decreases as t increases in this interval. This means that the graph of f falls down when read from left to right. And the average rate of change of Q with respect to t is negative on every interval.
Remember though many function has some intervals on which they are increasing and other interval on which they are decreasing. These intervals can often be identified from the graph.
Rate of Change and slope
The rate of change is equal to the slope of a function.
Remember though for non-linear functions (like curves or parabolas) the rate of change varies from point to point, so the function does not have a single, universal slope. However if you pick two points on a curve, the rate of change is equal to the slope of the secant line connecting these two points.
Linear function
This is a function that that has the same average rate of change on every interval this, and therefore it has a graph that is a line.
Remember for many functions the average rate of change is different on different intervals
Interpreting the vertical intercept of a function
This is the initial value of the function when the x-value is zero.
How we interpret it would be:
When the (Input variable) is 0 (Input units), the (Output variable) is (intercept value) (Output units)
For example “at zero weeks, before the semester begins, the initial balance on the dining cars is 600 dollars”
Remember for some mathematical models it has to have a logical interruption of the y-intercept (for example what would the y-intercept of the functions in Example 2 say about oxygen consumption. The y-intercept would be the oxygen consumption of a person whose pulse is zero. Sine a peons running a treadmill must have a pause, it does not make sense to interpret the y-intercept this way. The formal for oxygen consumption is useful only for realistic values of the pulse)
The general formula for linear function
The general formula for linear functions would be
Output (Y) = Initial value (b) + Rate of change (M) * Input (X)
So:
Y = b + mx
The initial value would be the vertical intercept, or the y-intercept (so the value when x = 0, and in mathematical modes, b typically represents an initial or starting value of the output)
Tables for Linear Functions
A table of values could represents a linear function if the rate of change is constant for all pairs of points in the table, that means
Rate of change of linear function = (Change in output / Change in input) = Constant
Therefore if the values of x goes up by equal steps in a table for a linear function then the value of your goes up, or down, by equal steps.
Remember though it is possible to have data from a linear function where neither the x-values nor the y-values change by equal steps. So to find if that function is linear you would need to find the rate of change and see if its constant.
Not all graphs that look like lines represent linear functions
Remember though the graph for ANY LINERA FUNCTION IS A LINE. However, a graph can look like a line without the function actually being linear.
For example some lines on graphs that are non linear would be:
If a graph looks like a line or pieces of lines but is has jumps or holes or chasing definitions, parts of it are straight, but the overall function may not be a continuous linear equation across its entire domain
A line that is defined as x = 3 (or any number) is a linear equation but not a linear function (as it doesn’t pass the vertical line test)
However linear that is defined as y = 0x is a linear function as it both passes the vertical line test
if a graph doesn’t have a constant rate of change it is not a linear function

How we interrupt the slope of a linear function and what does it represent
In a linear function the, slope (m) represent the constant rate of change between the independent variable (input, x) and the dependent variable (output, y)
This units of a slope are always output units per input units. For example dollars per hour, miles per gallon, or pounds per inch.
How we interpret the slope in the context of a problem:
For each additional (unit of input), the (Output quantity) (increases/decreases) by (absolute value of slope) (Units of output)
For example: “For each additional shirt added to the total purchase, the price-per-shirt decreases by 0.04 dollars”
Slope-intercept form
This is the formula y = b + mx and why it is called this is because the slope and vertical intercept are given expel city.
We can calculate m using two point on the graph of a liner function. Having found m, we can use either of the points to calculate b.
Point-slope form for a linear function
if we know that slope of a function and the coordinate of a point, we can find a formula for a line without having to find its intercept. It would be:
y - y0 = m(x - x0)
So the m value would be the slope and (x0, y0) would be the coordinates of one points.
If you solve this to get the slope intercept form of the line

Standard form for a linear Function
This would be in the form of:
Ax + by = c (where A, B, and C are constants)
In which you relate two values from the function and then you can solve this to get the equation of the line in slope-intercept form
For example, we have $48 to spend on road and chips for a party. A six-pack of Sade cost $6 and a bag of chips costs $4. The number of six-packs we can afford is y, is a function of the number of bas and chips we decide to buy x. Find an equation relating x and y and this would be in standard form is which 4x + 6y = 48. We we solve we get the Slope-intercept form equation in which y = 8 - 2/3(x))
X and y are the variables (or inputs or outputs) represents the coordinate on a line, and C is a constant term.
Equations of Horizontal and Vertical lines
A horizontal line is when the slope of the line is zero, which means that the rat of change of quantity zero, so that means the quantity does not change, for a change in the x values
The equation would be ( y = Value)
For a vertical line the slope would be undefined because the denominator when you are solving for change in y over change in x would be zero. Therefore a veil line is not a graph of a function, since it fails the verity line test. It does not have an equation in the form of y = b + mx (it is just x = value)
Slopes of Parallel and Perpendicular lines
if two lines have two equal slopes that means that the linear are parallel.
If two lines are perpendicular that means that their slopes are the negative reciprocal of the other slopes (so if you were to multiply the two you would always get negative -1) (Why is: we know that two perpendicular lines when graphed intersect at a 90 degree angle, therefore if one line has a positive slope, then a perpendicular lines must have a negative slope)
Remember that any two horizontal lines are parallel because their slope is both zero (so it is equal) and any two vertical lines are also parallel. And a horizontal line and a vertical line are perpendicular.

How we can use the parameter b and m to compare linear functions
We can use the parameter b and m to compared linear functions (in y = mx + b), to compare their initial values (in terms of which ones are higher or lower, and also their slope, in terms which ones has the faster rate of change and which one has the slowest rate of change, or which ones are decreases or increasing)
For example (For town a in the slope-intercept form equation, b = 20,000 and m = 1600. This means that in the year t = 0 town A has 20,0000 people. And it gros by 1600 people per year. For two b we have b = 50,000 and m = -300. This means that town b Starts with 50,000 people. The negative slope indicated that the population is decreasing at the rate of 300 people per year)
Intersection of two lines
The point (x, y) at which two lines intersect satisfies the equations for both lines. Thus, to find this point, we solve the equations simultaneously (so we put them equal to each other).
When modeling real phenomena, the pont of intersection often has practical meaning, such as modeling based on the intersection point which functions are cheaper / and cost more relative to the interaction points x-value. ( you can also find this if you don’t have graph by plugging in the values before and after the points for each equation, and then compare the given y-values)

Linear inequalities
We can solve problems using linear inequalities to get a range of values in which the y-values are in a specific range, we would just have to set an inequality that relates to the expression, and then solve for the input.

Fitting Linear functions to data; Linear regression
When data is collected in the laboratory or the field, they are often subject to experimental error. Even if there is an underlying linear relationship between two quantities, real data may not fit this relationship perfectly as a result. However, we may still be able to use a linear function to analyze the data.
Therefore we do _______ ________ in which is is a statical modeling method used to find the line of best fit for a given set of data points. It serves as a foundational tool for mathematical modeling, allowing you to approximate the trend of real-world data and make predictions using a linear equation ( y = mx + b)
How we do this would be:
Analyze the initial data table
Visualize the data on a scatter plot and drawing the treadline
Writ the linear function equation
Interpret what the sloe (m) and y-intercept (b) mean in the context of the real-world problem
How we would interpret this would be:
“As the independent variable (time) increases, the dependent variables (cost) also appears to increases, suggesting a positive correlation) before the line of best fit is drawn
Based on the breadline, the linear model is y = 2.5x + 10, where 2.5 is the rate of change 10 is the initial value
Interpreting the slope and y-int
“For every additional (x-unit) the y-variable increases/ decreases by m units”
"initially, when (x variable) is zero, the (y variable) is b units” (Example: The y-intercept of 10 means that if a student studies for zero hours, their predicted test score is initially 10 points)
When you are making predictions how you would phrase it would be. “ By substituting ___ into our linear equation, we can predict that a student will earn a ________” (for example: by substituting 8 hours into our linear equation, we can predict that a student will earn a score of 30)
Interpolation vs Extrapolation
When we estimate a value from a line of best fit, and the x-value is between two x-values in which the y-vales is known (we actually recorded it), the estimation of that y-value is said to be an interpolation.
However, if we estimate the value for a given x-input that is outside of the the range of your observe data points it would be know as this; And this is considered unreliable or invalids, unless you are given explicit real-world context that guarantees the trend will continue;
For example (Based on the line of best fit for a given set of data points if we were to predict the y-values, or the viscosity of motor oil at 300 degrees F, it would give us a -12.3 il * sec/in². This is an expropriation because it is outside of the measured/ observes values, due to this it is also unreasonable because viscosity cannot be negative. Therefore by making a prediction at 300 degree Fahrenheit we has assume, incorrectly, that the trend observed in laboratory data extended as far as 300 degree F)

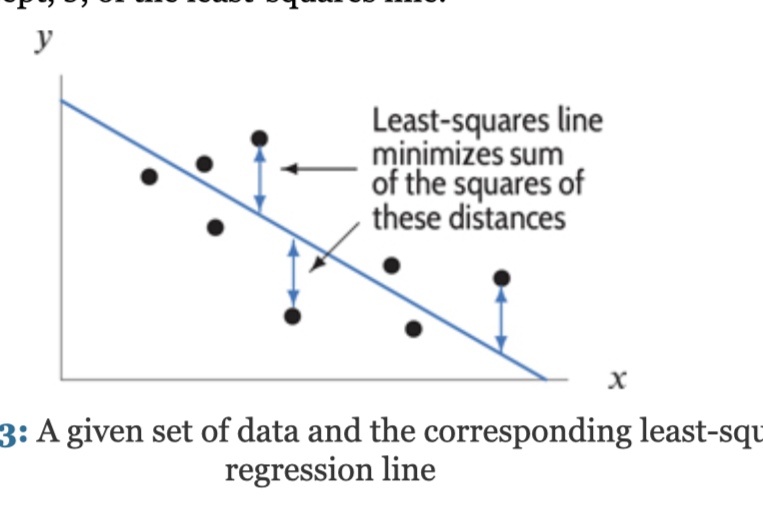
Least-squares line
How a calculator or computer decided which line fits the data best, is we assume that the value of your is related to the value of x, although other factors could influence y as well.
Thus we assume that we can pick the value of x exactly but that the value of y may only be partially determined by this x-value.
One way too fit a line to the data, is a line is chose if it can minimize the sum of the squares of the vertical distance between the data points and the line.
Such line is called a ________-______ ___.
T
Correlation coefficient
This is a number that tells you how strongly two variable are linked in a straight line.
So it is a statistics measure between -1 and 1 that quantity the strength and direction of a linear relationship between two variables.
If the r variable if (r > 0) this means that the linear relationship is positive, if the r variable is (r < 0) this means that the linear relationship is negative.
As the value of r is closer to 1 or -1, that means there is a stronger linear relationship (so the data points sit very close to a perfect line). If the r value is exactly 0 that means their is no linear relationship at all, and close to 0 it is a weaker relationship.
This is given when a computer or calculator calcuatles a regression line.

The difference between Relation, Correlation and Causation.
It is important to understand that a higher correlation (either positive or negative) between two quants does not imply causing.
For example, there Is a high correlation between Children’ reading level and shoe size. however large, feet do not cause a child to read better or vise vers. Large feet and improved reading ability are both a consequent of growing older.
Notice also that a correlation of 0 does not imply that there is no relationship between x and y. As a correlation coefficient of r = 0 usually implies that there’s no linear relations between x and y but this does not mean there is no relationship at all.

Evaluating a function
This means calculating the value of a functions output (y-value) from a particular value of the input (x-value).
if we have a formula for a function we _______ it by substixng the input value into the formula and solving.
You can also do this by looking at a graph and a table
Solving Equations
This is where we know the output of a function (y-value) and we solve the equation so we can the input of the function (x-value).
Remember when you also vole a equation for a quantity that is being used to model a physical quantity, we must choose the solutions that makes sense in the context of the model.
You can also do this by looking at a graph and a table

Domain and Range of a function
Remember a function is often defined only for certain values of the independent variable (x-value). Therefore, the dependent variable often take on only certain values because the amount of the x-values determines how many y-value there will be. This leads to the following defining aspects of a function:
________: Is the set of input values of a function that yield and output value
_____: Is the set of output values that yield an input value
Remember, if the domain of a function is not specific we usually assume that it is as large ass possible (that is all numbers that make sense as inputs for the function. For example, if there are no restrctions, the domain of the function f(x) = x² is the set of all real number, because we can substitute any real number into the formula. However, we may restrict the domain to suit a particular application. So if the function f(x) = x² is used to represent the area of a square of size x, we restrict the domain to positive numbers)
Using a graph to find the domain and range of a function
A good ay to estimate the main and range of a function is to examine the graph. The domain is the set of input values on the horizontal axis that give rise to a point on the graph; the range is the correspond set of output values on the vertical axis

Using Formulas to Find Domain and Range
When a function is defined by a formula, its domain and range can often be determined by examine the formula algebraically.

How to write Domain and range
How we write Domain or Range is awe can use a pair of numbers (from smaller to larger) wrapped in either parentheses or braces to show which values are included:
Domain: All possible input (x) values, read from left to right on a graph
Range: All possible (y) values, read from bottom to top on a graph
Square brackets, this means endpoint it apart of the function (what is looks like on a graph is close circle or a solid line.
Parentheses, this means that the endpoint is not part of the set (what this looks like on the graph is a open circle)
Parentheses with infinity, you can use this with (- infinity, to positive infinity) and this always gets parentheses because it is a concept not a number you can reach (what is looks like on the gray is an arrow pointing force in that direction)
How we write it using interval nation would be;
< and > are used to show the bounds of points not include
<= and >= are used to show the bound of points included
And the x or y variable is sandwiched in between the two variable
you would also say IR , which is all real number (this means (- infinity, infinity)
Piecewise-Defined Functions
This is a function that employ’s many different formulas on different parts of its domain.
Remember these types of functions don’t always have to be connected.
How we write the formula for these types functions would be, provided in photo:
Count the pieces: So look at the graph or problem description to see how many distinct sections or rules the function has
Find each equation: Determine the algebraic equation (y = mx + b, etc for each separate piece)
Determine the Domain (intervals): So find the x-values where each piece is active
Assemble the Notation: So stack the equations and their matching intervals inserts the big curly brace.
Also make sure that you adjust the domains relative to the context of the problem (for example in this scenario in which the the x-value would data usage and -x value for megabytes wouldn’t make sense the domain would be m >= o)

The Absolute Value Function
This is a function in which its equation is the y = The absolute value of x, therefore it is a piecewise function as:
For nonnegative x values the absolute value would be directly to x (so all positive values) (So the range would be all positive values)
For negative x the absolute value would be equal to that x value but positive (so all positive values) (so the range again would be all positive values)
Therefore this would be a piecewise function in which the equation would demonstrate the y = x (for x>= 0) and y = -x (for x<0)
The domain would therefore be all real number and the range would be all real number greater than or equal to zero.
However remember that no matter what for an absolute value function the domain is alway all real numbers
However the range changes when the graph is shifted upward, downward, or reflected
For the parent function of a piecewise function the range would be [0, infinity )
If it is shifted up by 3 units the range would be [3, infinity)
If it is was shifted down by 5 units it would be [-5, infinity)
If it was flipped downward it would be (-infinity, 0]
If it was flipped and shift up 4 units it would be (-infinity, 4]
However the shift in horiziontal impacts its domain for each function
How you would find this would get the equation (such as 2x - 7)
Set it equal to 0 (2x - 7 = 0)
Solve for x (x = 3.5)
Then you know that based of that for any values greater or equal to that x-value it would be positive domain with the positive function (x >= 3.5 equation 2x - 7)
Then you would know that for any values less than that x-value it would be the negative part of the domain that is squared. (x < 3.5 the equation would be -2x + 7)
If the function was flipped leave (it was negative) leave both the domain discover but for their equations multiply both the orignal output expression by -1
Remember that the absolute value of x subtract a value is always the absolute value of the distance between the points. So you can use that when we are trying to solve or evaluate a function.
![<p>This is a function in which its equation is the y = The absolute value of x, therefore it is a piecewise function as:</p><ol><li><p>For nonnegative x values the absolute value would be directly to x (so all positive values) (So the range would be all positive values)</p></li><li><p>For negative x the absolute value would be equal to that x value but positive (so all positive values) (so the range again would be all positive values)</p></li></ol><p>Therefore this would be a piecewise function in which the equation would demonstrate the y = x (for x>= 0) and y = -x (for x<0)</p><p>The domain would therefore be all real number and the range would be all real number greater than or equal to zero.</p><ol><li><p>However remember that no matter what for an absolute value function the domain is alway all real numbers </p></li><li><p>However the range changes when the graph is shifted upward, downward, or reflected</p><ol><li><p>For the parent function of a piecewise function the range would be [0, infinity )</p></li><li><p>If it is shifted up by 3 units the range would be [3, infinity)</p></li><li><p>If it is was shifted down by 5 units it would be [-5, infinity)</p></li><li><p>If it was flipped downward it would be (-infinity, 0]</p></li><li><p>If it was flipped and shift up 4 units it would be (-infinity, 4]</p></li></ol></li><li><p>However the shift in horiziontal impacts its domain for each function</p><ol><li><p>How you would find this would get the equation (such as 2x - 7)</p></li><li><p>Set it equal to 0 (2x - 7 = 0)</p></li><li><p>Solve for x (x = 3.5)</p></li><li><p>Then you know that based of that for any values greater or equal to that x-value it would be positive domain with the positive function (x >= 3.5 equation 2x - 7)</p></li><li><p>Then you would know that for any values less than that x-value it would be the negative part of the domain that is squared. (x < 3.5 the equation would be -2x + 7)</p></li><li><p>If the function was flipped leave (it was negative) leave both the domain discover but for their equations multiply both the orignal output expression by -1</p></li><li><p>Remember that the absolute value of x subtract a value is always the absolute value of the distance between the points. So you can use that when we are trying to solve or evaluate a function.</p></li></ol></li></ol><p></p>](https://assets.knowt.com/user-attachments/52f83b84-1422-4350-b501-06e364f2d9e9.png)
Vertical shifts
Y = g( x - h) ± K
This of a graph is a transformation that moves a function straight up or down along the y-axis by specific units (of the output) without changing its size, shape, or orientation.
It is the k demonstrated in this equation for transformations:
y = g(x) + K (upward shift by k units) y = g(x) - k (downward shift by k units)
How to write an new equation based on the vertical shifts:
First to get the new points you would keep the fixed x-values and just add and subtract the shift value from the y-valus (X, Y) (X, Y + k / Y - K)
For the equation to show relationship
New Function (p(t)) = Old Function (q(t)) + K/-K
This shift would simply be called a translation because it does not change the shape of the graph, but simply translates it to another position in the plane. (therefore shifts/translations are examples of transformations of a function)

Horizontal Shifts
Y = g( x - h) ± K
This is a transformation of a graph that moves a graph left or right along the x-axis without change its shape, size, or orientation. it happens when you add or subtract a constant directly from the input variable (x) inside a function.
It is the h demonstrated in this equation for transformations
y = g( x + h) (this means a left ward shift so -) y = g(x - h) (this means a right ward shift +)
How to write a new equation based on the vertical shifts:
First to get the new points you would keep the fixed y-values and just add and subtract the shift values from the x-values (X + h, Y / X - h, Y)
For the equation to show the relationship it would be
New function (p(t)) = old function plus or minus the shift (f(x-h/x+h)
This shift would be a translation because it does not change the shape of the graph, but simply translates it to another position in the plane. (therefore shifts/translations are examples of transformations of a function)

Composte functions
These are two connected functions in which the output of one is the input of the other, therefore this would be a new function created by putting one function inside another function. (Look at example inside the photo)
How do we create composite functions:
The input of the outer function (the ones who’s input is another functions output) would be the output of the inner function (the function that goes inside the parentheses because it’s output is an input) (For example the output of of the inner function g(x), because the input for the outer functions f(x), Turing the composite function into f(g(x)).
The Outer function (Is the function which input you are trying to find)
The inner function (is the function which output is another functions input)
Therefore for two functions f(t) and g(t), the function f(g(t)) is said to be the composition of f with g. The function f(g(t)) is defined by using the output of function g as the input to f.
You can evaluate and solve composite functions by analyzing both graphs and and tables with the method of substitutions (so first you work with the inner function and find its y value than plug that y-value as a -x value for another function than evaluate it. Work viser verse to solve the equation)

The domain and range of composite functions
In Composte functions the domains for the composite function would be the linked to the x-values in the domain of the inner function that yield a y-value (output) that is within the values of the domain for the outer function.
So to find the domain of a composte function f(g(x)), the input x must first belong to the domain of the inner function g(x), and the resulting output g(x) must land inside the domain of the outer function f(x)
Therefore the domain would be all x-values (the outputs for the inner function) that reside within the domain of the outer function.
Refer to example in the photo

Inverse Functions
These are functions that completely reverse or “undo” the mapping of an input-to-output relationship (for example if a standard function f(x) takes an input x and maps it to an output, its inverses—denoted as f^-1(x)—-takes that y values and maps it straight back to the original x value)
So there’s are functions one function would give an y-output for a given x input, while the other function would give that same y-output (taken as its input) for the same x-value (taken as its output)
How we write in Inverse Function Notation:
If we want to emphasize that the function g is an inverses of f we call it f^-1 (read as f-inverse)
For example to express the fact that the population of birds, is a function of time, t we write : P = f(t)
To express the inverse it would write P = f^-1(t) which is otherwise know as t = f^-1(p)
To find the inverse function we would just isolate the variables that we want to solve for and set equal to. For example:
The function T = ¼ * R + 40
T - 40 = ¼ * R
R = 4(T-40)
Thus R = f^-1(T) = 4(T - 40)

The Domain and Range of an inverse Function
The input values of the inverses function f^-1 are the output values of the function f
This the domain of f^-1 is the range of f

What happens when we compose inverse functions
When you compose a function with its inverses function, the orignal input x is returned unchanged (this is because inverse functions undo each other)
So if f(x) and f^-1 are true inverses functions, composing them in either direction yields:
F(F^-1(x)) = X
F^-1(fx)) = x
This happens because an inverses function complete reverses “undoes “ the effect of the original function. if f takes x and transform it into y, then f^-1 takes y and right back to x.
We use this property as an office test. To provide whether two distant functions f(x) and g(x) are inverses of each other, you must test both composition and see if it simplifies to x:
Find f(g(x)) and check if it simplifies to x
Find g(f(x)) and see if simples to x

Concave up Graphs
These are graphs in which their rate of change increases with time, so the slope of the graph increases as t increases, causing the graph to bend upward like a simple (U).
RememberNote than an increasing function that is concave up would be increases function that is increases at an increasing rate
Remember an decreases function that is concave up would be decreasing at a slower rate (because its slope is getting more positive, reaching 0 and sometimes exceeding zero)
How this would look like on a table:
If the function is decreasing its slope would be getting more positive (closer to zero)
if the function was increasing its slope would be getting more positive (higher values)
How this would like on a graph:
The decreasing function would be on the left-handed side of a simile
The increasing function would be on the right-handed side of the simile

Concave down graphs
This is a graph in which its slope is decreasing with time, so the slope of the graph decreases as the x-value increases. This would look like a frown.
Remember that an increasing graph can be concave down in the sense that means that it slope is decreasing as it x-values increases therefore it is increasing at an decreasing rate.
Remember that an decreasing graph can also be conceiver down, and this means that its slope is depress more as it x-values increases, therefore it is decreasing at a increasing rate.
How this would look like on a table:
The decreasing function would just get more negative
The increasing function values would start dropping (potentially to the negatives over time)
How this would look like on a graph:
The increasing function would look like the left-handed side of the frown
The decreasing function would look like the right handed side of the frown.

Quadratic function; Parabola
This is a polynomial function of degree two, meaning the highest power of the variable (x) is 2.
The Standard form of this function would be
y = ax² + bx + c
A and b and C are real number coefficient
A cannot equal zero because if a = o the x² term disappears and the function becomes a linear function (y = bx + c)
Remember the graph of a quadratic function is called a _________.
A parabola being either concave up or concave down