Ecology Exam 2 (Ch. 8-12)
 Call Kai
 Learn
Learn Practice Test
 Spaced Repetition
 Match
Match Flashcards
 Knowt Play
1/119

There's no tags or description
Looks like no tags are added yet.
Name | Mastery | Learn | Test | Matching | Spaced | Call with Kai | Chat |
|---|
No analytics yet
Send a link to your students to track their progress
120 Terms
Sexual monomorphism
From human’s eyes, can’t tell males & females in species apart → look identical

Sexual dimorphism
From human’s eyes, can tell difference between both sexes in species

Sexual selection vs. Natural selection
Sexual selection: nonrandom mating b/c of intrasexual competition & intersexual mate choice
Natural selection: process where organisms that are better adapted to their environment tend to survive & produce more offspring
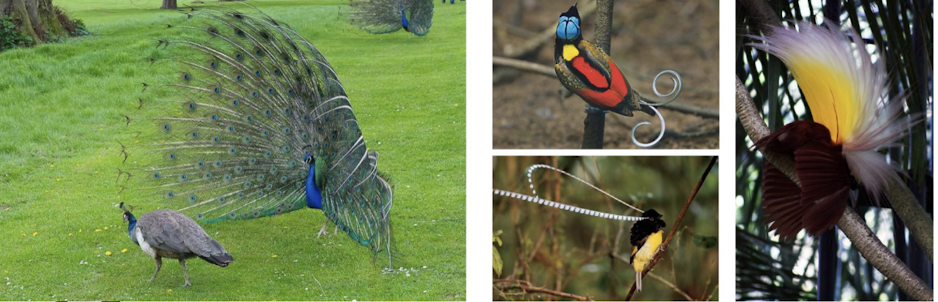
They can both conflict sometimes (better survival vs. more attractive males) → i.e. peacocks
Similarities between sexual selection and natural selection
Both have opposing evolutionary forces occurring simultaneously
Sexual selection violates which assumption of HWE?
Random mating: Every individual has an equal chance of mating w/ any other individual of opposite sex, regardless of their genotype or physical traits
Nonrandom mating or preferential mating can change genotype frequencies
Sexual selection = another means for evolution to occur
Intrasexual selection
Individuals of one sex competes among themselves for mates
Selection is result of contests within one sex

Intersexual selection
Members of one sex consistently choose mates from among members of the opposite sex on the basis of some particular trait
Favors elaboration of trait
Why do females choose males that practice resource partitioning?
Females gain direct benefits that improve their survival or reproductive success
Why might there sometimes be conflict between sexual selection and natural selection?
Elaborative traits make animal more vulnerable to predation/visual predators
Trait elaboration will ultimately be balanced by natural selection
Sexual selection favors traits that increase reproductive success
Eventually, traits become so elaborate that they decrease reproductive success
Sociality
Cooperative breeding, feeding, defense, maintenance, but restricted mating opportunities
More social living → individuals are grouped together → mating may be limited to certain members of the group → restricted mating opportunities
We would expect more extreme versions of sociality when …
There’s high relatedness among helpers and low cost to helpers
What are reasons why sociality may have evolved in different animal systems?
Need for group defensive of high-quality territories
Defense of mates and young
What benefits might sociality provide to current-day societies/helpers?
Inclusive fitness
Safety or increased resources
Experience
Potential to inherit territory
Potential to recruit helpers
Inclusive fitness
The survival and reproduction of an individual, plus the survival and reproduction of genetic relatives of the individuals
= kin selection
Genes are shared, to greater/lesser extent, among related individuals (kin)
Helpers increase their own fitness (proliferation of their genes into subsequent generations) by increasing fitness of their kin
Inclusive fitness > cost = cooporation evolves

Eusociality + 3 Main Components to Define a Eusocial Group/Species
Extreme case of sociality
1) Individuals of more than one generation living together
2) 100% cooperative care of young
3) Division of individuals into non reproductive and reproductive castes
Caste: a group of individuals that are physically distinctive & engage in specialized behavior within a social unit
Diff size variation for diff roles
Queen = reproducing individual
What is Hamilton’s Rule and Its Relation to Inclusive Fitness or Eusociality?
Cooperation can evolve when the overall genetic payoff of helping is greater than the reproductive cost of helping
Relation to Inclusive Fitness: Hamilton’s rule explains when helping relatives is favored
Relation to Eusociality: Hamilton’s rule explains genetic payoff from that help

How have humans caused apparent conflict between sexual selection and artificial selection in some mammal species?
Human predation
Antlers/horns for intrasexual competition → hunters look for bigger ornaments as trophies (but big ornaments = good for intrasexual selection)
Horn/antler size decrease in time
Humans = artificial selection
What factors contribute to a species’ geographic distribution?
Abiotic conditions (temp, precipitation, pH, salinity)
Biotic conditions (competition, predation, disease)
Ability to disperse
Historical/geological factors
Niche
The environmental factors that influence the growth, survival, & reproduction of a species (the place where organisms can survive)
All factors necessary for species existence:
When, where, how the species survives
Both biotic and abiotic factors involved
Ecologists Defining Niche: Joseph Grinnell
Early ideas of niche focused on physical environment
Rainfall, humidity, soil moisture, barometric pressure, temperature, light intensity, cloudiness
1877-1939
Ecologists Defining Niche: Charles Elton
Incorporated ideas of biological interactions
Mostly considered niche to be product of interactions w/ other organisms & food resources
1900-1991
Ecologists Defining Niche: G. Evelyn Hutchinson
n-dimensional hypervolume
n = # of environmental factors important to the survival & reproduction of a species
Fundamental niche
Realized niche
Fundamental niche
The physical conditions under which a species might live in the absence of interactions w/ other species
Just abiotic conditions
n-dimensional hypervolume
Realized niche
The actual niche of a species whose distribution is limited by biotic interactions such as competition, predation, disease, parasitism
Is usually smaller than fundamental niche b/c of biotic factor limits
BAM Diagram: “A”
Abiotic Interactions aka fundamental niche
Environmental areas where population can survive
Factors: climate may indirectly affect food production, water supply, habitat
Shifted by evolution of species itself, physiological tolerance
i.e. evolution of a species’ frost tolerance

BAM Diagram: “M”
Mobility aka historical accessibility/ability to get to a place
Shifted by external forces (NOT change in abiotic or biotic factors)
Natural disaster, species being kidnapped by a human & put on another continent, climate change, continental change
Shift in “M” = shift in realized niche

Potential realized niche
Areas where a population could survive (includes biotic & abiotic interactions)
Only way to shift this: any factors that change fundamental niche (abiotic conditions) or factors that change biotic conditions

Actual realized niche
Areas of potential realized niche that organism has had access to
was able to move or migrate throughout history to get there
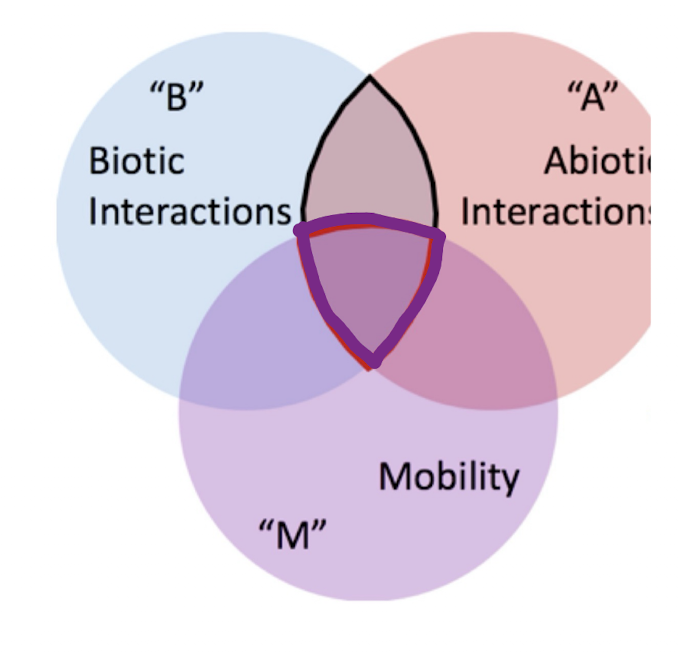
A change in physiological tolerance could change what following aspects of the BAM diagram?
Fundamental niche
Potential realized niche
Realized niche
Small-scale distribution patterns
No general trends
Patterns: Random, Regular, Clumped
Random Distribution
Caused by neutral interactions …
Among individuals
Between individuals and environment
Individuals are scattered unpredictably b/c individuals don’t strongly attract or repel each other, and resources are fairly uniform

Regular Distribution
Caused by:
Antagonistic interactions among individuals
Local depletion of resources
Individuals are evenly spaced b/c individuals compete or repel each other, so they maintain distance

Clumped Distribution
Caused by attraction among individuals OR to a common source
Individuals occur in groups/patches b/c resources are patchy, or individuals benefit from being together

Large-scale distribution patterns
Have a trend → clumped
don’t have all of random, regular patterns
How does organism size relate to population density?
Increase in size = decreased density in an area b/c they need more resources
How has mammal body size changed through the past thousands of years? What factors have caused these shifts?
a) Dinosaurs go extinct ~65 million years ago → mammals became bigger to a general size limit
Extinction events got rid of super large mammals that were occupying large-body-size niches on land = ecological opportunities opened
b) Recently, mammal size declining
Climate change + human hunting
What factors directly cause a population to increase or decrease in size?
Factors that lead to increase
Number of births
Number of immigrants
Factors that lead to decrease
Number of deaths
Number of emigrants
Dispersal
When an individual is born in one place and then moves from another
Individual leaves from where they were born
Passive vs. Active Dispersal
Passive: organism doesn’t choose where it’s going/dispersing
i.e. seeds being dispersed by wind
Active: organism makes choice to where it’s going/dispersing (could be a bad or good choice)
Dispersal Kernal
How far individuals in a population are likely to move from their starting location
The probability distribution of dispersal distance

Functional response
When more food is available, an individual eats more
Numerical response
When more food is available, the environment can support more individuals → populations get bigger
Downstream effects
a species may increase in number, which can indirectly affect other species that reproduce more slowly through increased competition for resources
Population
A group of individuals of a single species inhabiting a specific area
One group
Subpopulation
A portion of a larger population that lives in one particular patch and is connected to the rest of the larger population it’s part of through immigration and emigration
Separate local groups
Frogs in each pond
Metapopulations
A group of separate subpopulations/populations of the same species that live in different habitat patches but are connected by dispersal (individuals moving between patches)
Each patch has their own local population, but individuals can move between them
Individuals can sometimes disperse between them
All the connected local groups together
All the frog subpopulations together
Source-sink dynamics
Habitat quality varies among patches
Sources: High-quality habitats that produce more individuals
Some individuals disperse to other patches
Sinks: Poor quality habitat
Only maintained by immigration/immigrants coming from source populations (w/out it, population would eventually disappear/go extinct)
Cohort Life Table
Record all births, observe until they die
For animals of short generation times/use for individuals that are short-lived
Static Life Table
A snapshot in time
Record age of death and then depending on frequency of age groups, estimate life span by looking at differences in proportion of individuals in successive age classes
Use for individuals that live very long
Survivorship Curve: Type 1
High survival when young → most die when old
Most individuals survive through early and middle life
Death rate increases as get old
Examples: humans, elephants, many large mammals
Survivorship Curve: Type 2
Die at equal rates regardless of age
Examples: many birds, squirrels, some rodents
Survivorship Curve: Type 3
Most individuals don’t make it past birth
Those who make it past birth will live for a very long time
i.e. Pecan tree, many plants, fish, insects, oysters
Net reproductive rate (R0)
The average number of offspring produced by an individual
lxmx = reproductive rate at age x

lx
Proportion surviving to age x
Survival
mx
Average number of offspring produced by an individual at age x
Reproductive output
Fecundity/reproduction at age x
x
Age
If R0 < 1 …
Population is declining
If R0 = 1 …
Population is stable
If R0 > 1 …
Population is increasing
Geometric rate of increase (λ)
The change in population size in organisms w/ pulsed reproduction
Nt + 1 = population size in future
Nt = previous population size

Pulsed reproduction
All individuals of one generation die before next generation reproduces
i..e annual plants, annual insects
When to use geometric rate of increase?
Use when generations do not overlap
Generation time (T)
The average age of reproduction in a population w/ overlapping generations

Per capita rate of increase (r )
Difference between per capita birth rate and death rate

When to use per capita growth rate / rate of increase?
Use for population that’s growing continuously w/ overlapping generations
If r < 0 …
Population is declining
If r = 0 …
Population is stable
If r > 0 …
Population is increasing
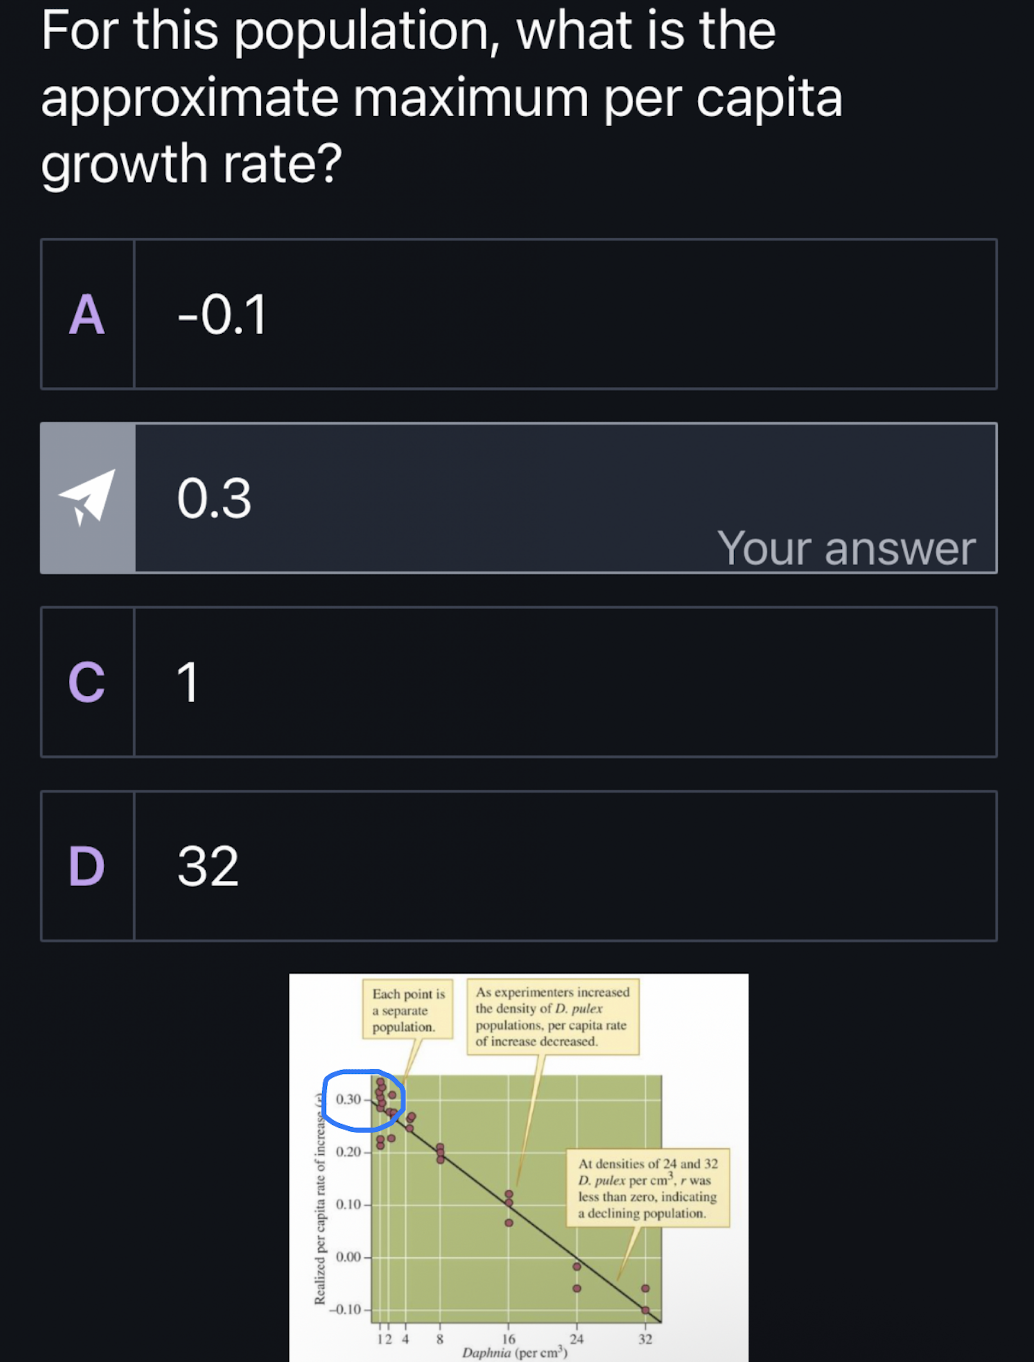
Realized r
Actual growth rate under real environmental conditions
Rmax
Maximum potential population growth under ideal conditions
The value of realized r is generally …
Lower than the intrinsic rate of increase (rmax) due to environmental limitations
Fecundity schedule
Age-related variation in fecundity
Fecundity: how many offspring an individual produces
affected by number of females produced
Life table
Age-related variation in morality
Fecundity schedule + life table = …
Population growth rate
What are the three types of population growth discussed in class?
Geometric growth, exponential growth, logistic growth
When would it be appropriate to use geometric growth to model a population?
Use when reproduction happens in separate pulses and generations do not overlap
One generation reproduces
That generation dies before the next generation reproduces
Population growth therefore occurs in distinct steps rather than continuously
Graph is J-shaped

Geometric Growth Equation
Nt = population at time, t
N0 = starting population
λ = geometric rate of increase
t = number of time intervals/generations

When would it be appropriate to use exponential growth to model a population?
Use when generations overlap and population growth is continuous
Parents can still be alive and reproducing while their offspring are also reproducing
The model assumes:
an unlimited environment
a constant per-capita rate of increase ( r)
abundant resources
As population gets bigger, more individuals are reproducing, so population adds more individuals per unit of time
Graph is J-shaped

Exponential Growth Equation

When would it be appropriate to use logistical growth to model a population?
When environment limits population growth
A population may initially grow almost exponentially when it is small and resources are abundant
As pop size increases, environmental limitations become stronger, causing growth to slow as pop approaches its carrying capacity (K)
This produces characteristic S-shaped (sigmoidal) curve/graph

What factors might limit geometric or exponential growth?
Geometric and exponential growth assume abundant resources, including:
food
space
nutrients
water
Natural populations cannot maintain unlimited growth for many generations because resources and energy are limited
So these types of growth can eventually be limited by things such as food, space, disease, parasitism, predation, or environmental disturbances
When is logistic growth likely?
When environment limits population growth
Pop may start with rapid/exponential growth when (N) is small, but as pop becomes larger, environmental limitations increase and growth slows
Eventually pop approaches carrying capacity (K)
What is carrying capacity and why does it matter w/ logistic growth?
Carrying capacity (K): the theoretical maximum population of a species that a particular ecosystem can sustain
It matters b/c it determines where population growth begins to level off
As N → K, population growth slows
When N = K, population growth is 0 in logistic model
What happens if the carrying capacity is overshot by a population?
If N > K, the pop has a negative growth rate, meaning pop size decreases
Sometimes, pop can crash after dramatically overshooting carrying capacity
Too many individuals for environment → pop declines back toward/below K
Instantaneous population growth rate eqn in logistic growth model
1 - N/K = effect of environmental limitation
rmax = intrinsic rate of increase/maximum per capita rate of increase under ideal environmental conditions
K = carrying capacity
N = current pop size
dN/dt = instantaneous rate of pop change

Population has a positive growth rate if …
N < K
population increases
Population has a negative growth rate if …
N > K
population decreases
Population has a stable growth rate if …
N = K
Growth rate is 0
When is population growth (dN/dt) at its maximum in logistic growth?
When N = K/2
aka when its at half of its carrying capacity, K
When is the maximum per capita growth rate, rmax?
At the beginning of the graph, when N is near 0
What are stressors or factors limiting growth in a population?
Abiotic and Biotic factors can alter birth & death rates, which changes pop growth and pop size
Abiotic (nonliving factors): flood/drought, extreme temps, fire, volcanic eruption, landslide
Biotic (living factors): disease, predation, food availability
Density dependent factors
Stressors that become stronger as population density increases
i.e. West Nile virus
Density independent factors
Stressors that affect populations regardless of how dense the pop is
i.e. a blizzard
Are there general trends in whether abiotic vs. biotic factors are density dependent or independent?
Yes
Abiotic factors usually → density independent
Biotic factors usually → density dependent
But there are exceptions:
Abiotic factor can become density dependent if a storm occurs but there are only a limited number of sheltered roosts
Biotic factor can act density independently if a particularly severe disease kills individuals regardless of population density
How does population age distribution reflect potential future growth, maintenance, or decline?
A population's age distribution reflects its history of survival and reproduction and can indicate its potential for future growth

Pyramid-shaped age distribution
Rapidly growing population
Many young individuals
Fewer old individuals
Large # of young individuals will eventually enter reproductive ages
High potential for future population growth

Constant age distribution
Stable/slow-growing population
Similar proportions across many age classes
Indicates slow growth or population maintenance

Few young individuals
Declining population
Relatively fewer young individuals than old individuals
Less replacement potential
Negative future growth/decline
Why is the relationship between number of seeds and size of seeds negative?
Plants have a limited amount of energy/resources available for reproduction
More seeds → smaller seeds
Many seeds means that less energy can be invested, so result in smaller seeds
Larger seeds → fewer seeds
It takes more investment of energy to make large seeds, so can’t make too many of them
Reproductive effort
The amount/proportion of an organism's available resources or energy that it allocates toward reproduction
Trade-offs to reproductive effort
1) More energy invested in reproduction means less energy available for maintaining the parent's body
2) Reproduce early → potentially affect survival/growth; Reproduce later → risk dying before reproducing