Data Analysis Test 1 UARK Pullen
 Call Kai
 Learn
 Practice Test
 Spaced Repetition
 Match
 Flashcards
 Knowt Play
1/61

There's no tags or description
Looks like no tags are added yet.
62 Terms
Statistics
The science of collecting, organizing, analyzing, interpreting and presenting data
Descriptive Statistics
The collection, organization, presentation and summary of data
ex) mean, median, mode
Inferential Statistics
Generalizing from a sample to a population and making decisions
ex) 200 students = sample
entire student body = population
Data Set
Collection of data values as a whole (what goes into excel)
Observation
Each data value (goes into data sets)
ex) genders
Subject (or individual)
An item for study
ex) an employee in your company
Variable
A characteristic about the subject
ex) an employee's income or gender
Data Type: Categorical/Nominal/Qualitative
Values are described by words rather than numbers
ex) gender, ethnicity
Data Type: Numerical/Quantitative
Measuring a value
Type of Numerical/Quantitative = Discrete
Countable number of values (integers or whole numbers)
Type of Numerical/Quantitative = Continuous
Variable that can have any value in an interval value
Ratio Data
Strongest type of data, has a definite zero and starting point (quantitative)
--> can add, subtract, multiple, divide, mean + STD
ex) GPA, money
Interval Data
Second strongest type of data, a ranking with number associated/anything without a definite zero
--> can mean, STD but cannot add, subtract, multiple, divide
ex) 1-5 rating, temperature
Ordinal Data
Third type of data, a ranking system without numbers associated with data
--> can do frequency counts or %
ex) year in school, excellent fair poor
Nominal Data
Weakest type of data, straight words with no meaning behind the answers (qualitative)
--> can do frequency counts or %
ex) favorite food, gender, ethnicity
Type of Data Set = time series data
each observation in the sample represents a different equally spaced point in time
Type of Data Set = Cross sectional data
each observation represents a different individual unit (person) at the same point in time
Univariate
one variable
(histograms, descriptive statistics)
Bivariate
two variables
(scatter plots, 2 sample hypothesis, simple regression)
Multivariate
more than two variables
(anova, multiple regression)
Control group
the group that does not receive the experimental treatment
Experiment group
exposed to manipulation of independent variable
4 steps to construct a histogram
1) Find the min and max value
2) Define the # of bins/classes
3) Define the bin/class width
4) Define the upper limit
How to find the min and max value
In excel: =min(data)
=max(data)
How to define the # of bins/classes
its based on the # of observations (n)
How to define the bin/class width
(max - min) / # of bins
How to define the upper limit
It must be larger than the maximum value!
ex) max value = 676.42 width = 80
Make upper limit 680 then decrease by increments of 80
How to find relative frequency
frequency # / total #
how to find cumulative frequency
add each sum of preceding frequencies / total
skewed left
mean < median < mode
negative #

skewed right
mode < median < mean
positive #

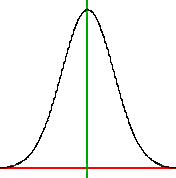
symmetric
mean = median = mode
skewness is close to zero
Modal class
class with the highest frequency
Unimodal
one mode

Bimodal
two modes

Multimodal
more than two modes

Mean
average
excel: =average(data)
Median
Middle number
excel: =median(data)
Mode
The value that occurs most frequently in a given data set
excel: =mode(data)
Sample
statistic
portion of people
x-bar
Population
parameter
whole number
mu
Frequencies
number based off classes/bins
Skew excel function
=skew(data)
--> < 0 = negative skewed
--> > 0 = positive skewed
--> = 0 = normal distribution
Kurtosis
measures the peak/height of the curve of the distribution
Leptokurtic
positive kurtosis
sharper rising peak; > 0

Platykurtic
negative kurtosis
slower rising peak; < 0

Mesokurtic
normal distribution
= 0

Kurtosis excel function
=kurt(data)
Range equation
max - min
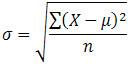
Population variance equation

Population standard deviation equation
the square root of the population variance
Sample variance equation

sample standard deviation equation
the square root of the sample variance

Population variance excel equation
=var.P(data)
Sample variance excel equation
=var(data)
Population standard deviation excel equation
=stdev.P(data)
Sample standard deviation excel equation
=stdev(data)
Trimmed mean
the mean of the data values left after "trimming" a specified percentage of the smallest and largest data values from the data set
--> 10% take off the lowest and highest values
--> 20% take off the lowest 2 and highest 2 values
KEEP WHOLE NUMBERS NOT % (like dont change 2% to .02 bc its wrong)
growth rate equation
=(present / initial) ^1/(n-1) - 1
Sharpe Ratio equation
(mean return - risk-free rate) / standard deviation return
(mean Xi - Rf) / std dev Si
--> you want the higher number

Sharpe Ratio
When looking at returns, look Xi values
When looking at risks, look at Si values
--> you want the higher number
Empirical Rule
Total area = 1 or 100%
Only use when normal distribution!!!
