310 stats
 Call Kai
 Learn
 Practice Test
 Spaced Repetition
 Match
 Flashcards
 Knowt Play
1/59

Earn XP
Description and Tags
midterm prep
Name | Mastery | Learn | Test | Matching | Spaced | Call with Kai | Chat |
|---|
No analytics yet
Send a link to your students to track their progress
60 Terms
descriptive statistics
Summarize and describe the important characteristics of a set of measurements in a clear way
inferrential statistics
make inferences about population characteristics from a sample
experimental unit
the individual or object on which a variable is measured
probability
the numerical measure of the likelihood that an event will occur
measurement/data value
when a variable is actually measured on an experimental unit
data
a set of measurements from observations, counts, measurements, or responses
sample
a subset or sub collection of measurements selected from the population
population
the set of all measurements of interest in the investigator
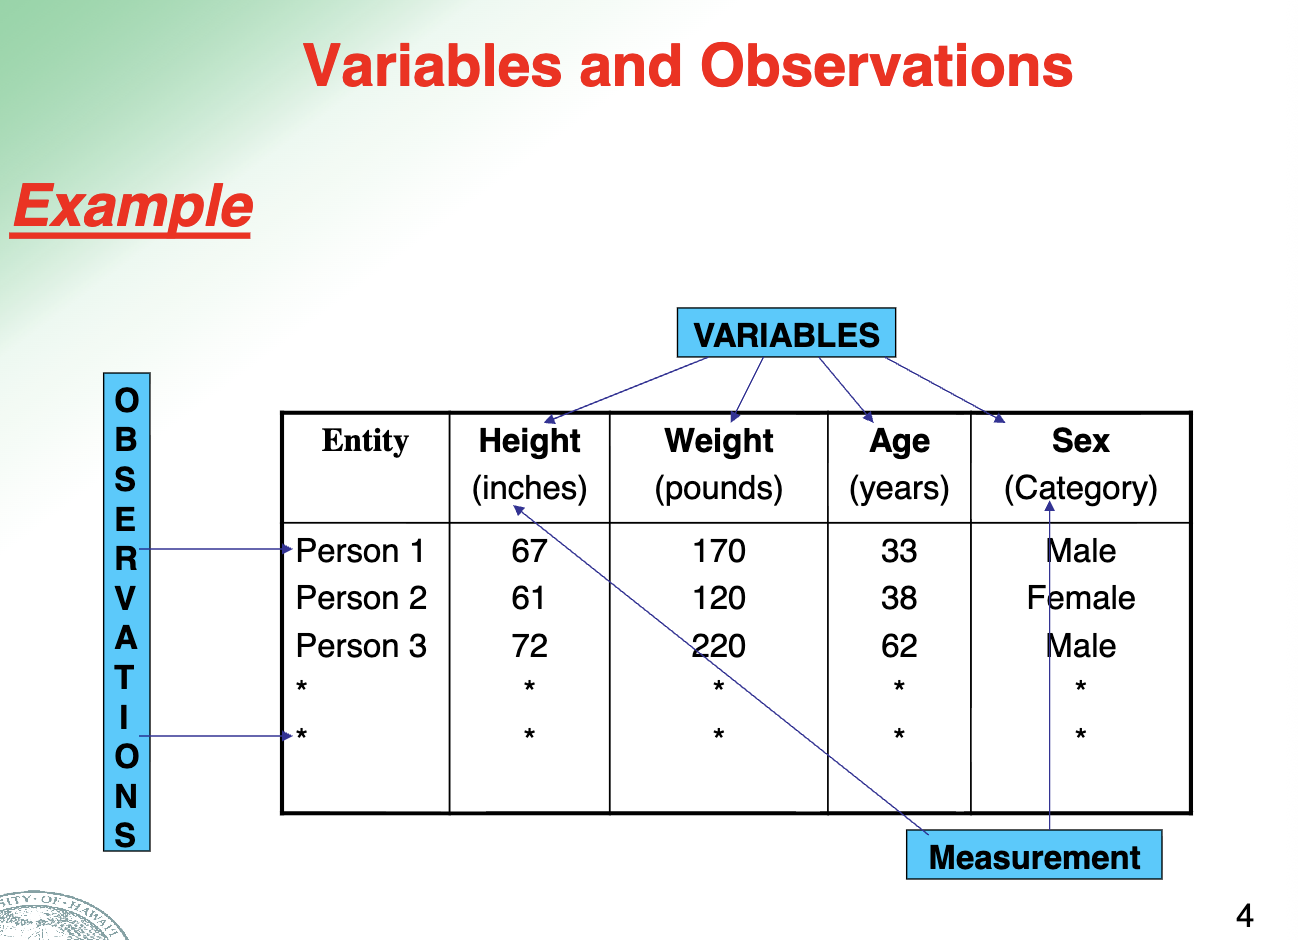
variables
a characteristics that changes or varies over time and/or for different individuals or objects under consideration

observations
values of characteristics that have been measured
dataset
a collection of observations on a group (sample) of entities
univariate data
one variable is measured on a single experimental unit
bivariate data
two variables are measured on a single experimental unit
multivariate data
more than two variables are measured on a single experimental unit
What are the types of data (variables)
Qualitative (categorical)
Quantitative (numerical)
discrete
continuous
Qualitative (categotical) variables
measures a quality or characteristic on each experimental unit which cannot be measured numerically: Ex. hair color
Quantitative (numerical) variables
measure a numerical quantity on each experimental unit
Discrete
Can be counted + can take on only particular value
Continuous
can be measured, can take on any value in an interval, could have any number of decimals
relative frequency histogram
a bar graph in which the heigh of the bar shows how often a measurement falls in a particular class or subinterval
What are numerical measures used for
populations and samples
what does a parameter measure
a numerical descriptive measure calculated for a population
what does a statistic measure
A numerical descriptive measure calculated for a sample
measure of center
A measure along the horizontal axis of the data distribution that locates the center of the distribution
how do you find the mean?
Take the average (sum of the measurements divided by the total number of measurements taken)
median
midpoint of ranked values
mode
the most frequently observed value
What is the position of the median?
.5(n+1) after measurements have been ordered (not affected by extreme outliers)
what does n represent
sample size
variance
the measure of variability of all points and measurements - based on deviations of points and measurements from their mean
the variance of a population
the average of the squared deviations of the measurements about their mean μ.
the variance of a sample
the sum of the squared deviations of the measurements about their mean, divided by (n-1)
standard deviation
The positive square root of the variance
measures of variability provide what
information on the spread or variability of the data values
Simple event
the outcome that is observed on a single repetition of the experiment
Sample space (S)
The set of all simple events of an experiment / aka the population
event
a collection of one or more simple events
Theoretical probability
Calculations based on theory where all possibilities are equally as likely
Empiricle probability
based on observation
permutation
an arrangement of items in a particular order
combination
a collection of data in which order does not matter
union
of A and B, is the event that either A or B or both occur when the experiment is performed
How is data generated
experimental units, variables, measurements
samples and populations
univariate, bivariate, and multivariate data
what type of chart do you use when at least one variable is qualitative
bar chart or comparative pie chart
what is 𝑆𝑥𝑦
covariance
what is sx
standard deviation of x
what is sy
standard deviation of y
y is the blank variable
dependent
x is the blank variable
independent
what is the regression line
the line you draw through data points to show the relationship between two variables
what is p(a)
probability of event a
how do you find p(a)
add together all probabilities of simple events in the space of a
theoretical probability
based on theory w/ outcomes that are equally likely
empirical probability
based on observations
what is the mn rule and what is it used for
If an experiment is performed in two stages, with m ways to accomplish the first stage and n ways to accomplish the second stage, then there are mn ways to accomplish the experiment - it is used to fidn the total number of simple events
describe permutations for ordering
the number of ways you can arrange n distinct objects, taking them r at a time
are there more combinations or permutations
permutations
what is Ac and what does it mean
the compliment of event a - all outcomes in an experiment that do not result in event a
what is a mutually exclusive event
when one event occurs, the other cannot
what does a z-score tell you
how many standard deviations you are away from the mean