Spatial Info Systems
 Call Kai
 Learn
Learn Practice Test
 Spaced Repetition
 Match
Match Flashcards
 Knowt Play
1/132

There's no tags or description
Looks like no tags are added yet.
Name | Mastery | Learn | Test | Matching | Spaced | Call with Kai | Chat |
|---|
No analytics yet
Send a link to your students to track their progress
133 Terms







DCEL Space Complexity
6e + f + n
Symmetric Structure Space Complexity
8e
Simplified Symmetric Structure Space Complexity
4e + 3t + n
Watson’s Algorithm Time Complexity
Worst case - O(n²)
Average - linear to the number of input points
Brute Force Algorithm for Intersections Time Complexity
O(n²)
Bentley Ottman Algorithm
O((n + k) log n)
Spatial Data
Data with an associated spatial location, with respect to a given reference frame
Geographic data / geo-spatial data
Data whose underlying reference frame is the Earth’s surface
SDBMS
A DBMS for storing and manipulating spatial data
Geographic Information Systems
Main technology in developing spatially enabled systems. Provide convenient mechanisms for analysing and visualising geographic data
Spatial Queries
Proximity Query
Containment Query
Adjacency Query
Intersection/Overlap Query
Object-Based Model
Individual objects represented explicitly using their geometric counterpart
Point object
Marks location of geographic entity by pair of XY coords
Line object
Shows location and linear extent of geographic entity by series of XY coords
Polygon object
Shows location and 2D extend of geographic area by series of XY coords
Field-based model
Space is partitioned into cells that cover it entirely
Raster
Fixed grid
Vector Format
Sets of spatial entities and spatial relations
Raster format
Sets of pixels
Problem with early GIS
No data independence, data security, or concurrency
How does relational DBMS work?
Each relation/table represents a theme, geographic objects are tuples/rows of such relations, and each column is an attribute. Attributes have alphanumeric types. Uses SQL based querying.
Relational DBMS Pros and Cons
Pros:
Use of standard DBMS and languages
Cons:
No data independence, knowledge of structure required
Inefficient, large amount of tuples required
Need to manipulate typically very large tables of points
Difficult to perform spatial computations
Spatial queries not directly supported
Loosely Coupled Approach
There’s a separation between spatial and non-spatial data. Used by majority of traditional GIS vendors. Two systems coexist, DBMS (usually relational) for descriptive alphanumeric data, and a specific module for spatial data management.
Loosely Coupled Approach Pros and Cons
Pros:
Proper geo-spatial data management
Spatial queries directly supported
Cons:
Difficulty in modelling
Partial loss of basic DBMS functionality
Need to learn complex SW packages
Integrated Approach: SDBMS
Ability to add new types and operations to existing relational DBMS. Allows manipulation of spatial data as well as descriptive data. Adaptation of usual DBMS functions to handle spatial data efficiently.
Spatial Relations
Topological: containment, overlappping
Metric: distance
Direction: north of, south of etc.
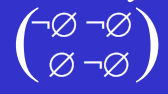
4-Intersection Matrix Pros and Cons
Pros:
Simple model
Well accepted
Cons:
Does not distinguish between conceptually different situations
Planar Graph
Graph that can be drawn in the Euclidean plane in such a way that its edges do not intersect each other, except at their endpoints
Straight-line plane graph
A connected plane graph where every edge is a straight-line segment
Plane subdivision
A partition of the plane into a collection of simply connected polygonal regions called faces.
Property of plane subdivisions
Euler’s formula: n - e + f =1
Where n = # vertices, e = # edges, f = # faces
Space complexity for plane subdivisions
O(n)
Because of Euler’s formula, and because e and f are both linear in the number of n vertices.
Triangulations
Plane subdivisions with triangular faces, commonly used as a basis for digital terrain models.
Delauney Triangulations
Given a set of V points, among all the triangulations that can be generated with the points of V, the Delauney triangulation is the one in which all triangles are as much equiangular as possible.
Empty Circle Property
Let T1 be a triangulation of a set of points V. A triangle t of T1 is said to satisfy the empty circle property if the circle circumscribing t does not contain any points of V in its interior. t is called a Delaunay triangle.
Voronoi Diagrams
Given a set V of points in the plane, the Voronoi Diagram for V is the partition of the plane into polygons such that each polygon contains one point p of V and is composed of all points in the plane that are closer to p than to any other point of V
Property of Voronoi Diagrams
The straight-line dual of the Voronoi diagram of V is a Delauney triangulation of V
Straight-Line Dual
Dual: Obtained by connected each point within a polygon to the points in the adjacent polygons. Replaces each polygon with a point and each point with a polygon.
In other words, for a graph G, choose a point for each face of G and connect any two such points by a straight edge, if the corresponding faces share an edge of G.
Which problems are Voronoi diagrams good for solving?
Proximity problems, such as nearest neighbor and k-nearest neighbor queries
Spaghetti Data Structure
Represents sets of points, lines, and polygons. Can be used for both generic sets of entities and overlayed sets. The geometry of any spatial entitiy is described independently of other entities. No topology/connectivity information is recorded.
Spaghetti Data Structure Pros and Cons
Pros:
Simplicity
Easy insertions of new entities
Cons
Inefficient for topological queries
Redundancies
Possible inconsistencies
Explain topological data structures for plane subdivisions
We incorporate connectivity among spatial objects by storing explicitly a subset of the relations seen before. We have two types of points, one for vertices and another for defining the geometry of lines. For polygons, we record adjacency information. Storing connectivity information explicitly allows for more efficient spatial queries.
DCEL
Doubly-Connected Edge List Structure
Stores 3 sets of entities (V, E, F), 3 edge-based relations (EV, EE, EF), and 2 partial relations (FE*, VE*).
Symmetric Data Structure
Stores 3 sets of entities (V, E, F), EV and inverse VE, FE and inverse EF.
Examples of data structures for Spatial Data
Arc-node structure: stores EV and EF
Winged-edge structure: extends DCEL, stores 4 edges instead of 2 in EE
Simplified Symmetric Structure
Stores 3 sets of entities (V, E, T), TE and ET, EV and VE*
Triangle based Data Structure
Stores 2 entities (V, T), and TV, TT
Triangle based Data Structure Space complexity
6t + 2n
What are Shapefiles?
ESRI Arcview format, based on non-topological representation. Topological/connectivity relations are calculated on the fly. Map composed of different layers.
List the GIS proprietary formats
Shapefile
Coverages
DXF
TIGER
SDTS
GML
What are TIGER files
Based on topological representaion. All objects are in one single layer. All intersections stored explicitly. Entities include points, chains, and polygons. Relations include VE, FE, EV, EF.
Half-Plane Representation
Polygons defined as intersection of a number of half planes. The points that belong to the interior of the polygon satisfy the constraints:

Raster Data
Arrays of cells
What is run-length encoding, and when is it useful?
Groups cells of the same value row by row. Useful when there are a few attribute values, inefficient when there’s high degree of spatial variability.
Explain quadtrees
Hierarchical data structure, based on recursive decomposition of space. A grid is subdivided into 4 equal quadrants, and each quadrant is further subdivided if not homogenous. The process repeats recursively.
Effective for spatial autocorrelation. Inefficient for high variability.
What do scan-order methods do?
Embed a 2-dimensional space into a 1-dimensional space by assigning numbers to all cells in a 2D grid in the order they are visited. Proximity is preserved.
Row Method
Scans one row at a time
Row-Prime method
Scans one row at a time, but reverses every second row
Morton Scan
Creates quadrants while traversing the grid, SW → SE → NW → NE
Z-buffering
Morton Scan in reverse: NW → NE → SW → SE
Peano-Hilbert Curve
U-like shape that repeats at all levels
Vector vs. Raster Data
Vector:
Focus on spatial objects
Objects explicitly stored
Topology explicit for data structures
Raster:
Focus on underlying space
Objects must be extracted
Topology implicit for data structures
Intra-format conversion
Raster-to-raster
Vector-to-vector
Inter-format conversion
raster-to-vector
vector-to-raster
Raster-to-Vector
Pixels can be connected using 4-connected or 8-connected neighborhoods.
Vector-to-Raster
Involves overlaying the vector to a raster array and identifying the pixels that the vector intersects
Antialiasing
Grey scale pixels according to coverage measures of the pixel by the vector
Types of Spatial Queries
Containment
Region
Enclosure
Clipping
Line intersection
Adjacency
Metric: Distance, Nearest neigbor, Range
Spatial Join
Map Overlay
Merge/Aggregation
Terrain Data
3D configuration of the surface of the Earth
Map Data
Data located on the surface of the Earth (2D)
Digital Terrain Model
Model providing representation of a terrain relief on the basis of a finite set of sampled data.
Global Terrain Models
Defined by means of a single function interpolating all data
Local Terrain Models
Piecewise defined on a partition of the domain into patches/regions
Polyhedral Terrain Models
Partition of the domain D into polygonal regions having their vertices at points in V. A function f that is linear over each region.
Can be used for any type of sampled pointset, can adapt to the irregularity of terrains, represent continuous surfaces
Triangulated Irregular Networks
Most commonly used PTMs, where each polygon of the domain partition is a triangle.
Guarantee the existence of a planar patch for each region of the domain subdivision.
Gridded Models
Domain partition into regular polygons
Regular Square Grids
Most commonly used GEMs, where each polygon in the domain partition is a square.
Digital Contour Maps
Given a sequence of real values, a digital contour map of a mathematical terrain model is an approximation of the set of contour lines.
Easily drawn on paper, intuitive for humans, not suitable for complex automated terrain analysis.
DTM accuracy
1+E1 where E is the error associated with the model
Explain Watson’s algorithm
For a set of V points, create a fictitious triangle T containing all points of V. Add a single point P1 from V into the triangle T and connect it to the vertices. Add a second point P2. Define the influence polygon Rp2, which is the union of all triangles in T whose circumscribing circle contains P2. Update the current triangulation by deleting all edges within Rp2, and connecting the points of P2 to the vertices of Rp2. Continue the process until all points from V have been inserted, then delete the triangle T.
Brute Force Algorithm Intersection Tests
2N(N−1)
Explain the Bentley Ottman Algorithm
A straight line sweeps the plane from left to right, stopping at certain events. When the line is stopped, the plane is partitioned into left and right halves. Intersections are recorded and added as events.
True or False:
According to the object-based modelling approach, spatial objects are represented explicitly using their geometric counterparts.
True
True or False:
A triangulation is a plane subdivision in which all internal faces are triangles.
True
True or False:
Run-length encoding is efficient when compressing raster data with low spatial autocorrelation.
False
True or False:
According to the loosely-coupled approach for spatial data management, spatial and nonspatial data are managed by two separate, co-existing systems.
True
True or False:
The efficiency of a scan order method for raster data can be evaluated by how well the method can preserve spatial proximity.
True
Conversion from one raster format to another raster format (i.e., raster-to-raster) involves re-organising topological relations.
False
True or False:
The symmetric data structure is less efficient than the DCEL data structure in supporting the query: "What are the edges that are associated with a given edge?".
True
True or False:
In an overlayed set, an entity can share its interior with other entities.
False
True or False:
Voronoi diagrams can be used to support nearest-neighbour queries.
True
True or False:
The straight-light dual of a Voronoi diagram of a set of vertices, V, is a Delaunay triangulation of V.
True