2-Summarizing data
 Call Kai
 Learn
Learn Practice Test
 Spaced Repetition
 Match
Match Flashcards
 Knowt Play
1/29

There's no tags or description
Looks like no tags are added yet.
Name | Mastery | Learn | Test | Matching | Spaced | Call with Kai | Chat |
|---|
No analytics yet
Send a link to your students to track their progress
30 Terms
Tables to organize qualitative data
frequency tables
contingency table
frequency table
organizes and displays frequencies for categories
contingency table
used to display the relationship between 2 categorical variables
Qualitative data organization methods
bar chart
mosiac plot
pie chart
mean
**average
sum of all numbers divided by the amount of numbers
sample mean
a statistic
population mean
a parameter
weighted mean
**weighted average
used when different values contribute unequally to overall total
ex: grades
weighted mean formula
( number * corresponding percent as decimal) + …..
total percents as decimals
Median
**in order from smallest to largest
odd numbered data sets: median is middle value
even numbered data sets: median is average of two middle values
finding median number position
(n+1)/2
Quartiles
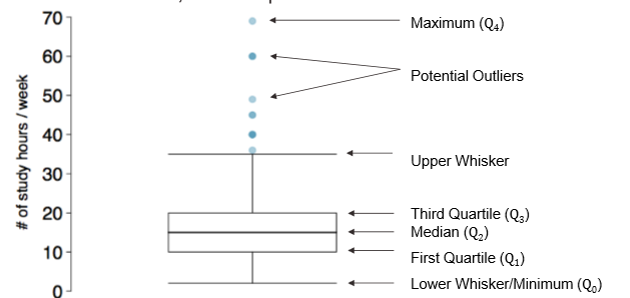
0th percentile (Q0) - minimum
25th percentile (Q1)
50th percentile (Q2) - median
75th percentile (Q3)
100th percentile (Q4) - maximum
Finding Q1 and Q3
order data from smallest to biggest
find median
Q1 is median of 1st half
Q3 is median of 2nd half
Mode
number that occurs most frequently
** there can be multiple, one or none
Range
difference between max and min
(max)-(min)
**not resistant-may not accurately reflect overall variability in the dataset
Variance
measure of variability
-can be less intuitive to interpret, so standard deviation is better
simple variance
**statistic
sample variance=(data number- sample mean)² / sample size
Population variance
**parameter
population variance= (data value-population mean)² / population size
Standard deviation (s)
measures the spread of data
always >=0
larger #s=greater variability in data
MOST APPROPRIATE FOR SYMMETRIC DISTRIBUTIONS
not resistant to outliers: one extreme value can drastically increase (s)
Simple standard deviation
**statistic
=square root( (data value-sample mean)² / sample size )
Population standard deviation
**parameter
=square root( (data value-population mean)² / population size )
Interquartile Range (IQR)
measures spread of middle 50% of dataset
**distance from Q1 to Q3
IRQ=Q3-Q1
IQR and outliers
Upper whisker (upper cutoff/ upper fence) = Q3+(1.5*IQR)
Lower whisker (lower cutoff/ lower fence) = Q1-(1.5*IQR)
any data above upper and below lower are considered outliers.
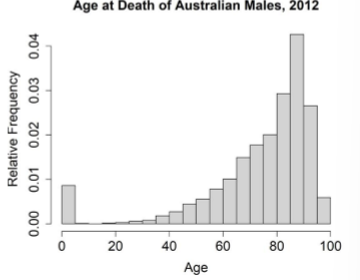
Histogram
Box Plot

box plot- vertical 5 number summary
Distribution of graphs
shape: mode symmetry, skewness
center: center of mass or midpoint
spread: range of values taken by variables
unusual observations: outliers
shape based on mode
1 mode= unimodial
2 modes=bimodial
3 or more = multimodial

shape based on symmetry
symmetry: mirrored
skew: leaning to left or right

histograp to box plot
