Data and Measurement
 Call Kai
 Learn
 Practice Test
 Spaced Repetition
 Match
 Flashcards
 Knowt Play
1/16

There's no tags or description
Looks like no tags are added yet.
17 Terms
Histogram
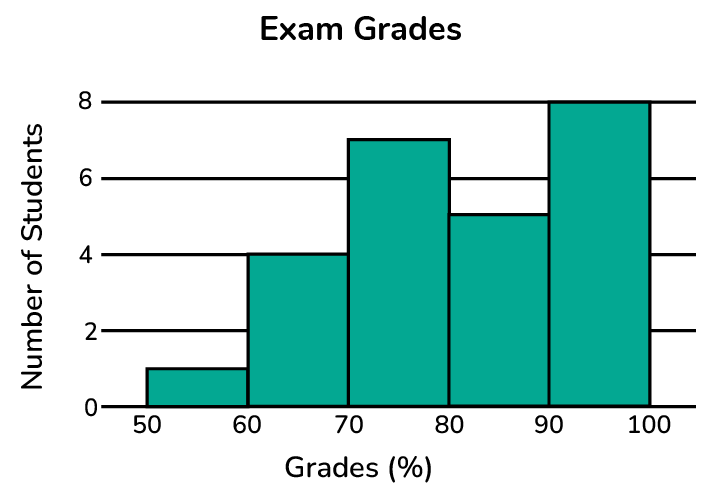
a visual representation of data which compares frequencies of different numeral intervals
Boxplot
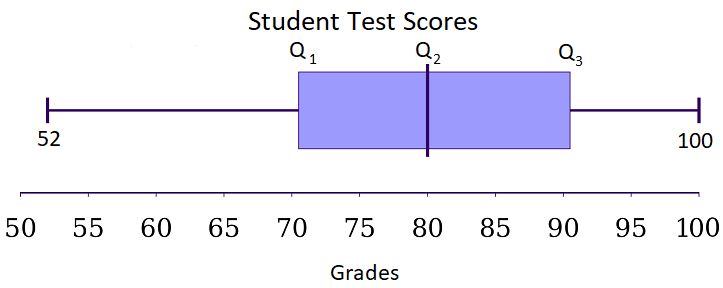
splits the data set into quartiles, where the middle 50% of the data forms the box and the lower 25% and upper 25% form the whiskers.
Used with larger sets of data.
You can easily identify the median, the shape or skewness of the graph, and the range.
Interquartile Range (IQR)
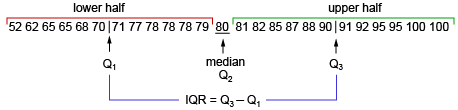
The difference between Q3 (median of the top half of the data) and Q1 (median of the bottom half of the data).
Binomial Distribution
The probability distribution of a binomial random variable.
Quartiles
divide a set of data into four equal parts, using 3 divisions
Stemplot
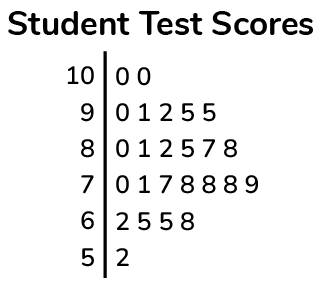
a plot that splits each data value into a "leaf" (usually the last digit) and a "stem" (the other digits).
Used for smaller sets of quantitative data.
You can easily identify outliers, data clusters, or gaps.
1st quartile (Q1)
median of the lower half of the data set.
Geometric Distribution
A specific case of binomial distribution that explores the number of trials required to obtain the first success.
Categorical Data
data recorded as categories/groups
Example.
color
2nd quartile (Q2)
the middle number of the data when the data are written in order.
Dot Plot
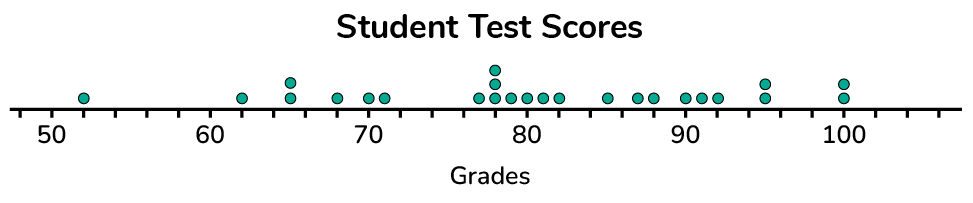
a graph that uses dots to show the frequency counts of a group of data.
Used for small sets of quantitative data.
You can easily identify the mode, the shape or skew of the graph, and potential outliers.
Normal Distribution
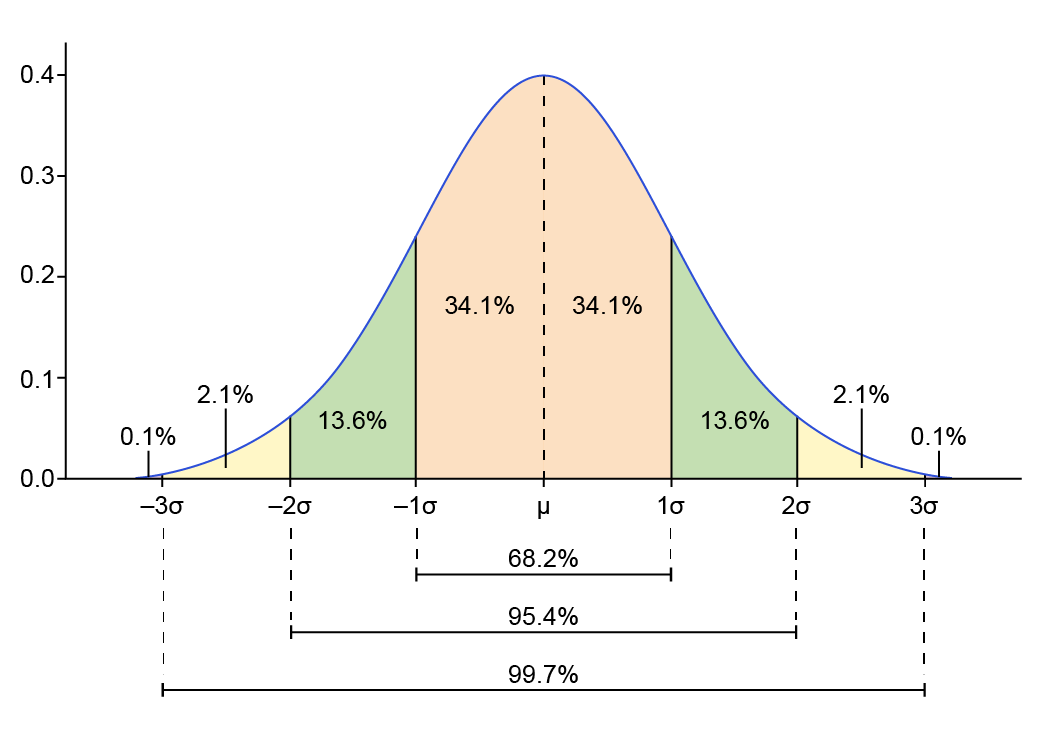
graph with a bell-shaped curve, where the graph is symmetric and has no skew
Quantitative Data
data which is measured and usually expressed numerically
Example.
distance, time, temperature, test scores
3rd quartile (Q3)
median of the upper half of the data set.
Exponential Distribution
Describes the time between events in a situation where events occur continuously and at a constant rate.
Example.
The expected time of failure of a mechanical device.
Standard Deviation
An average of how far each data point is away from the mean.
higher _____ indicates higher variability in the data (the data are more spread out).
The Greek symbol sigma (σσ) is used to represent it
Range (stats)
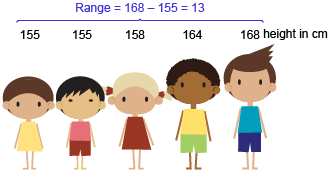
The width of the data set.