Speech/Hearing Sciences Exam 1
 Call Kai
 Learn
Learn Practice Test
 Spaced Repetition
 Match
Match Flashcards
 Knowt Play
1/30

There's no tags or description
Looks like no tags are added yet.
Name | Mastery | Learn | Test | Matching | Spaced | Call with Kai | Chat |
|---|
No analytics yet
Send a link to your students to track their progress
31 Terms
Speech
audible, meaningful, has physical reality, has a physiological reality
Acoustic Phonetics
Branch of speech sciences that focuses on characteristics of speech sounds and their measurement
Physiological/articulatory phonetics
Branch of speech sciences that focuses on how the human body operates during speech production
Biofeedback
articulatory feedback, spectrograph feedback, pitch, loudness display feedback, delayed auditory feedback, ultrasound imaging
Parts of the tongue
tip, blade, dorsum, and root

(tongue) tip
(B)


(tongue) blade
(C)


(tongue) dorsum
(D)
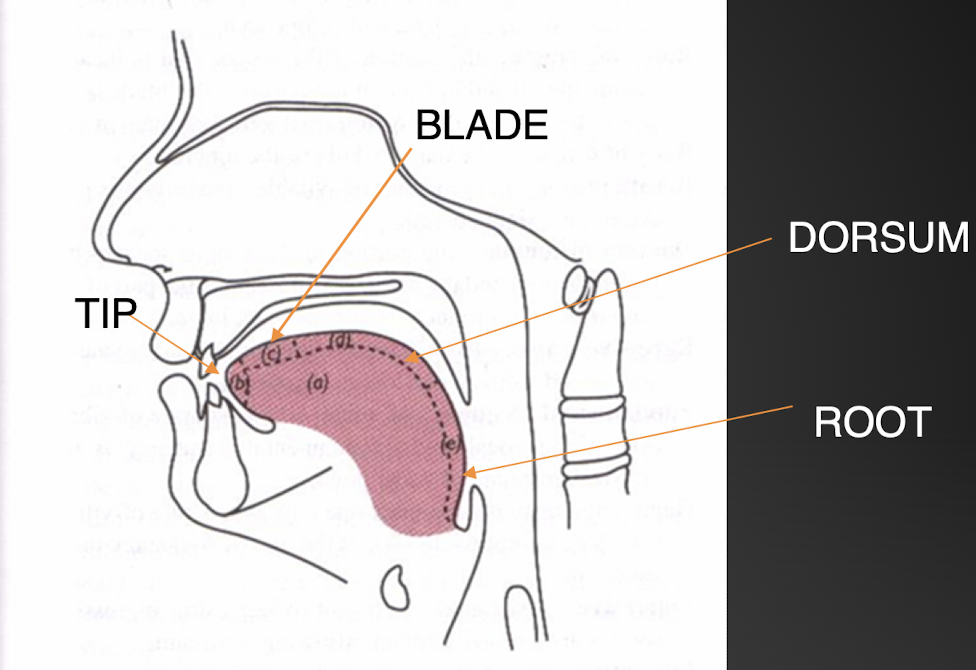

(tongue) root
(E)

Sine Waves
Describe simple harmonic motion
Properties of sime waves
Oscillatory, periodic, constant, has energy at only 1 fq
Amplitude
Size of motion (how far it moves from resting pt in ea. direction) reflection of loudness or intensity
Frequency
Number of complete cycles of movement (from object resting pos. to furthest point in ea. direction & back again) in a unit of time
Period (T)
Time required to complete 1 cycle
Wavelength
Distance of segment of the wave that keeps repeating itself
Distance from one peak or low point to the next
Length measurement
Velocity (V)
How fast does the wave travel?
Phase
In Phase: cycles of 2 waves in unison
Out of Phase: motions of 2 waves NOT in unison
Opposite Phase: one wave at min point & other at max point
Harmonics
Property of how VF works
Vibration as a whole, halves, thirds, fourths & fifths
Ea. are called Harmonics adding addtional complexity
Waves are at different frequencies
Creates complex wave
Source =
VF vibration
FF and Harmonics
Filter =
VT configuration
Formants
Resonant frequencies of the VT that help shape the sounds we hear (especially vowels)
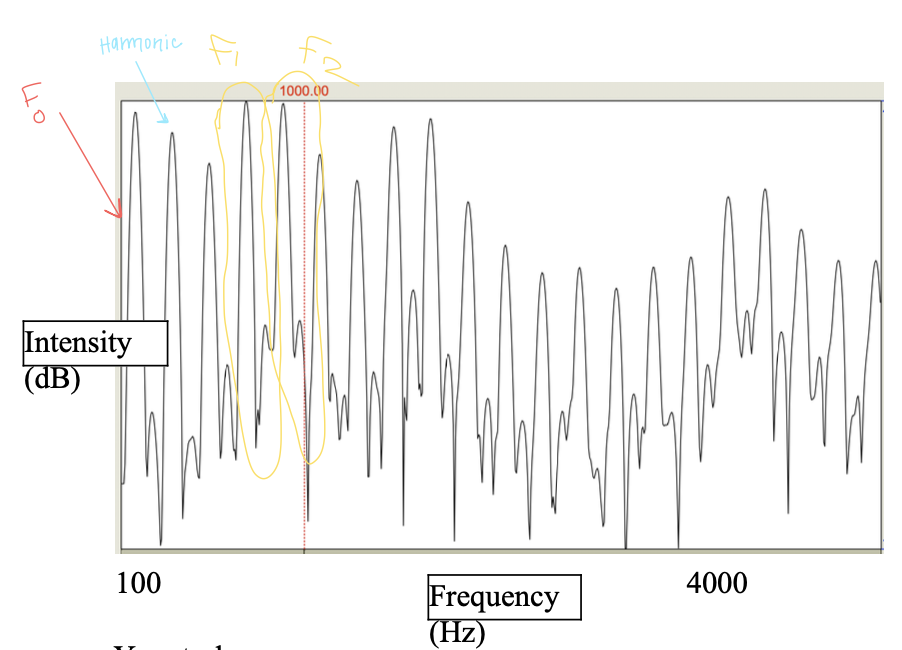
Formant on a spectrum graph

Formants on a spectrogram
X-axis (Spectrogram)
Time
Y-axis (Spectrograph)
Intensity/Amplitude
X-axis (Spectrum graph)
Frequency (Hz)
Y-axis (spectrum graph)
Intensity/Amplitude
F1 tells us…
high/low vowel
F2 tells us…
front/back vowel
F1 _____ as tongue lowers
increases
F2 ______ with front constriction
increases