IMED2004 - Sequencing SDL
 Call Kai
 Learn
Learn Practice Test
 Spaced Repetition
 Match
Match Flashcards
 Knowt Play
1/86

There's no tags or description
Looks like no tags are added yet.
Name | Mastery | Learn | Test | Matching | Spaced | Call with Kai | Chat |
|---|
No analytics yet
Send a link to your students to track their progress
87 Terms
What are the four learning objectives covering the clinical tests and first-generation sequencing in Sequencing Technologies I and II?
1. Understand the types of genetic tests used in the clinic.
2. Understand the basic principles of first-generation sequencing technologies and provide examples.
3. Describe the key features and technological innovations that underpin automated Sanger sequencing.
4. Understand the basic principles of next-generation sequencing technologies.
What are the three learning objectives covering Illumina sequencing and microarrays in Sequencing Technologies I and II?
5. Describe the key features of Illumina sequencing by synthesis as an example of a next-generation sequencing technology.
6. Understand the key technological innovations that underpin Illumina next-generation sequencing by synthesis.
7. Understand the basic principles of DNA microarray technology and the types of genetic lesions that are detectable.

What are the three major sequencing/genetic-testing technologies used in the clinic, and what is each mainly used for?
First-generation / Sanger sequencing:
- Still used clinically.
- Commonly confirms a known pathogenic variant or a well-established disease-causing mutation.
.
Next-generation sequencing (NGS):
- Detects pathogenic variants across panels of genes or broader genomic regions.
- Useful for diagnosing rare genetic disorders.
- Commonly used in oncology to identify genetic indications for therapy and/or drug-targetable somatic mutations.
- Whole-genome sequencing is not yet routine in all clinical settings.
- The slide notes that genomic data from >60 million patients was expected to be generated globally in healthcare over the following five years.
.
Microarray:
- Detects chromosomal abnormalities in congenital disorders.
- Example: 15-20% of pathogenic CNVs in congenital heart defects can be detected with microarray.
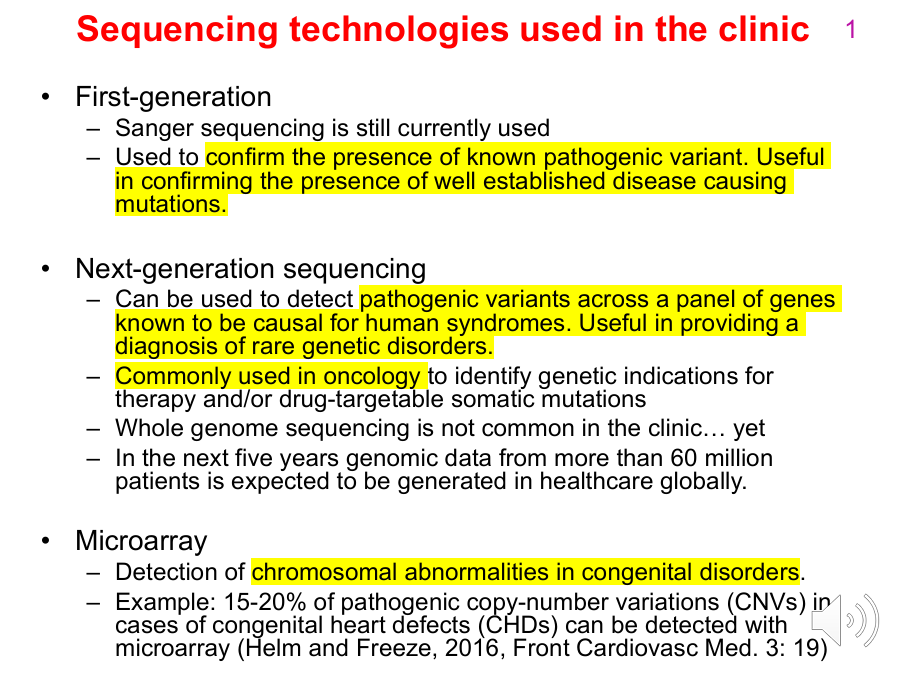

How did the lecturer illustrate an oncology use of next-generation sequencing?
NGS can identify mutations that influence treatment choice or reveal drug-targetable somatic mutations.
Lecturer example:
- Melanoma can harbour BRAF mutations.
- Such mutations can indicate sensitivity to a particular kinase-targeted therapy.
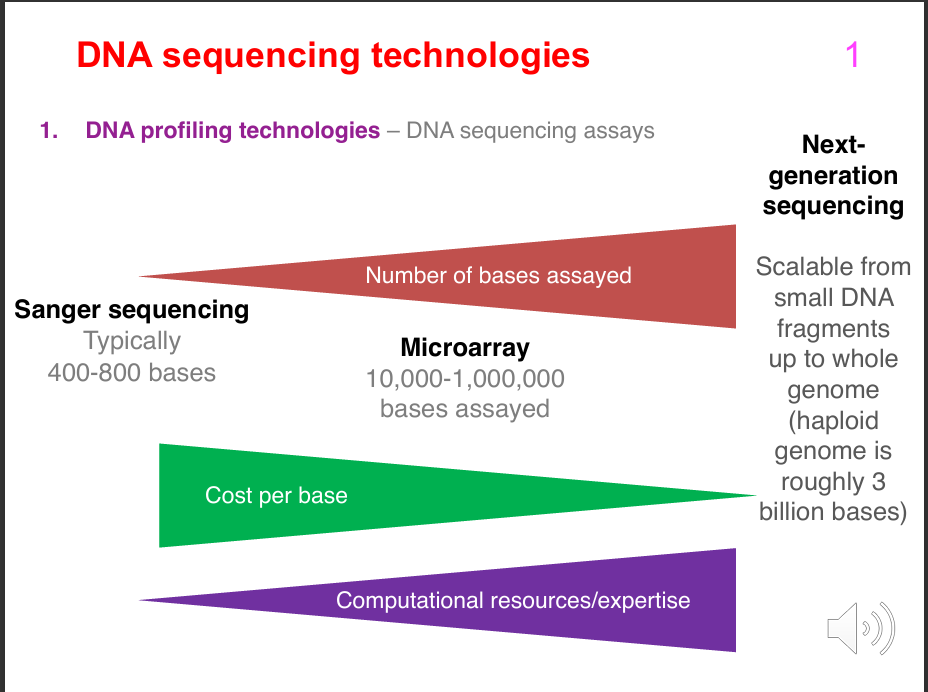

How do Sanger sequencing, microarrays and NGS differ in the amount of DNA they can assay?
Sanger sequencing:
- Typically ~400-800 bases.
.
Microarray:
- Roughly 10,000-1,000,000 bases/sites assayed, depending on the array.
.
Next-generation sequencing:
- Scalable from small DNA fragments up to the whole genome.
- Haploid human genome ≈ 3 billion bases.
.
Lecturer explanation:
Sanger is suitable for a small, targeted region; NGS can scale to very large genomic regions or the whole genome.
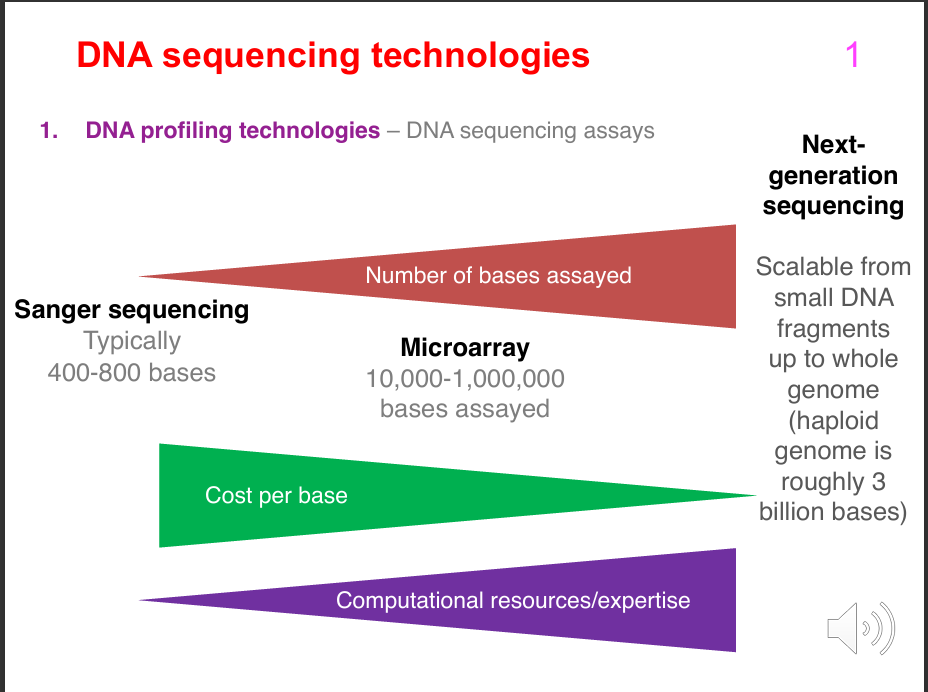
How do Sanger sequencing, microarrays and NGS differ in cost and computational requirements?
Sanger:
- Relatively expensive per base.
- Simple if only a small region is required.
- Limited infrastructure compared with NGS.
.
NGS:
- Much lower cost per base.
- Requires substantial computational resources, infrastructure and expertise.
.
Microarray:
- Also requires specialist analysis and computational expertise, but generally less than NGS.
.
Lecturer emphasis:
For NGS, the major bottleneck is often not sequencing cost per base but the infrastructure and expertise required to analyse the data.

How are Sanger sequencing, microarray and gene-panel sequencing used to investigate suspected genetic disease?
Sanger sequencing:
- Confirms a likely disease-causing mutation in a strongly suspected gene.
.
Microarray:
- Detects large-scale chromosomal aberrations such as copy-number variations.
.
Gene-panel sequencing:
- Sequences multiple known disease-causing genes.
- Useful when many genes could cause the disorder.
- Slide example: ~400 genes in a neuromuscular-disorders panel.
.
NGS:
- Can also detect large-scale chromosomal abnormalities such as CNVs.

What range of gene-panel sizes did the lecturer describe?
Gene panels can range from:
- Around 40 genes
to
- Hundreds of genes
and in some cases
- Thousands of genes
Lecturer example:
A local neuromuscular-disorders panel contained about 400 genes.

What clinical genetic-testing services were illustrated by the PathWest example?
The PathWest slide illustrates that local clinical laboratories can offer:
- Microarray testing
- Multi-gene panel testing
- Other diagnostic genomic services

What is the role of Victorian Clinical Genetics Services (VCGS) in clinical genomic sequencing?
VCGS:
- Is a specialist prenatal, childhood and adult genetics service.
- Is part of the Murdoch Children's Research Institute (MCRI).
- Uses clinical genomic sequencing to investigate complex health and developmental problems with a suspected genetic cause.
- Uses genomic sequencing to identify rare syndromes and cardiac, neurological and mitochondrial disorders.
How can genomic sequencing be used for SARS-CoV-2 surveillance? (NOT ASSESSABLE)
Genomic sequencing can:
- Classify a virus as a particular variant.
- Determine viral lineage.
- Support public-health genomic surveillance.
.
USA:
- CDC genomic surveillance was used during the COVID-19 pandemic.
.
Australia:
- Communicable Diseases Genomics Network coordinated protocols and processes for interstate, multi-jurisdictional and national pathogen genomics and surveillance.
.
Lecturer explanation:
The lecturer explicitly said this material was an aside and did not need to be memorised.
What outbreak information was inferred from SARS-CoV-2 sequencing in the Victorian genomic epidemiology example? (NOT ASSESSABLE)
The study inferred:
- Growth rate
- Doubling time
- Number of days from the first local infection to collection of the first sequenced genome for the dominant local cluster
The estimates were compared with a similar growth phase of lineage B.1.1.7 (Alpha variant) in the UK.
Lecturer explanation:
The lecturer explicitly said this material did not need to be memorised.
What does the SARS-CoV-2 phylogenetic-tree figure illustrate? (NOT ASSESSABLE)
The figure shows maximum-likelihood phylogenetic trees of Australian SARS-CoV-2 samples.
It illustrates how sequence data can be used to infer relationships between viral samples and outbreak clusters.
DIAGRAM ON SLIDE 10
Lecturer explanation:
The lecturer explicitly said this material did not need to be memorised.

What historical discovery preceded the development of DNA sequencing technologies?
The helical structure of DNA was proposed in 1953 based on X-ray diffraction patterns.
Key works shown:
- Watson & Crick: Molecular Structure of Nucleic Acids: A Structure for Deoxyribose Nucleic Acid.
- Franklin & Gosling: Molecular Configuration in Sodium Thymonucleate.

What is the key principle of first-generation DNA sequencing?
First-generation sequencing determines sequence by:
- Generating DNA fragments of different lengths from a longer target fragment.
- Separating/detecting those fragments by size.
- Using the fragment pattern to deduce the sequence of the original target.
How does next-generation sequencing differ fundamentally from first-generation sequencing?
NGS provides:
- Massively parallel analysis
- Extremely high throughput
- Analysis of many fragments and multiple samples simultaneously
- Much lower cost per base
.
Lecturer explanation:
Instead of analysing one sequencing reaction at a time, millions of reactions can be performed in parallel.
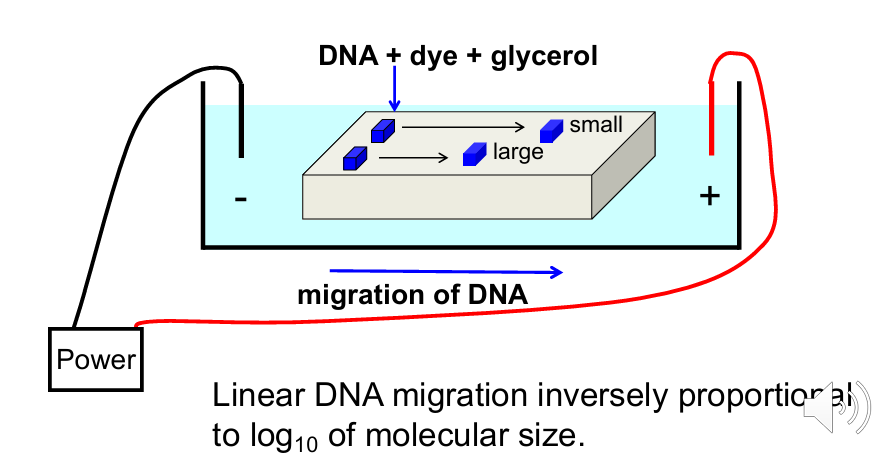
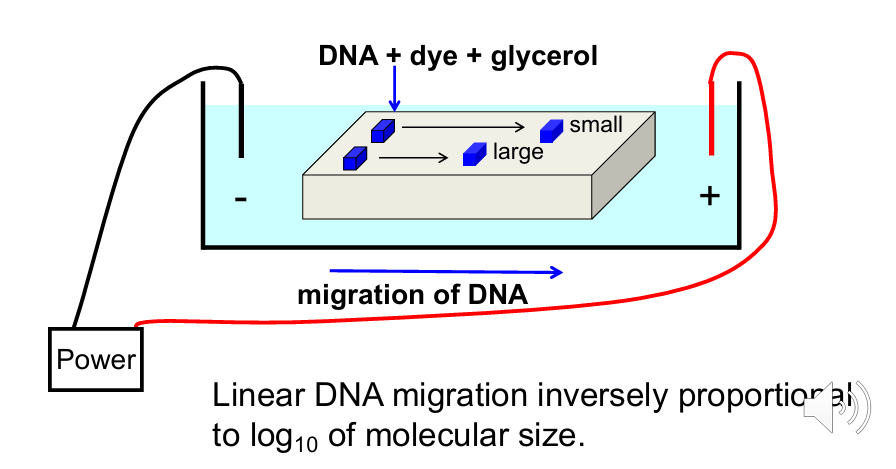
What factors determine how quickly DNA migrates through an agarose gel?
DNA migration depends on:
- Strength of the electrical field
- Buffer
- Percentage of agarose in the gel
- DNA fragment size
.
Small DNA fragments move faster than large fragments.
DNA is negatively charged, so it migrates toward the positive electrode.
Linear DNA migration is inversely proportional to log10 of molecular size.

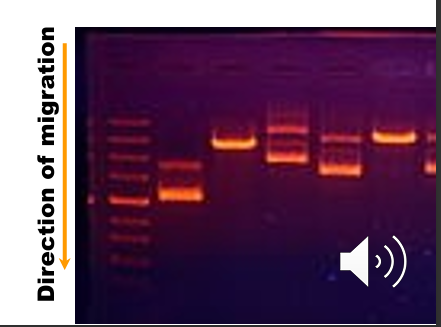
How does agarose gel electrophoresis allow DNA fragment size to be estimated?
- Molecular-size standards (DNA ladder) are separated on the same gel.
- Unknown fragments are compared with the standards.
- Smaller DNA molecules migrate further.
- Nucleic-acid-binding fluorescent dyes allow visualisation under UV light.
- Examples: ethidium bromide and GelRed.
- Standard migration can be graphed to estimate fragment size.

How can DNA sequence be inferred from a set of differently sized fragments?
If DNA fragments are generated so that each fragment terminates at a particular base:
- Fragments ending in A occur at every A position.
- Fragments ending in T occur at every T position.
- Equivalent reactions can be generated for all four bases.
Combining the fragment sizes for all bases reconstructs the original target sequence.


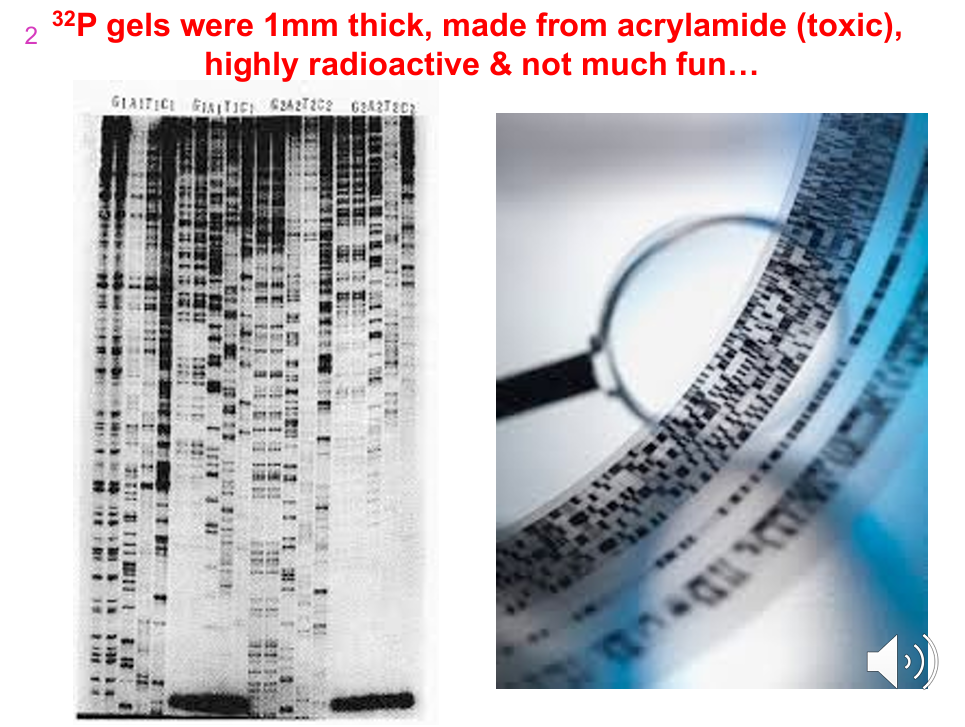
What were the disadvantages of early 32P sequencing gels?
Early 32P sequencing gels were:
- ~1 mm thick
- Made from acrylamide
- Toxic
- Highly radioactive
- Laborious and unpleasant to work with
What were the two major early first-generation sequencing approaches introduced in the lecture?
1. Maxam-Gilbert cleavage sequencing
2. Dideoxy chain-termination / Sanger sequencing
How does Maxam-Gilbert cleavage sequencing work?
Maxam-Gilbert cleavage sequencing:
- Developed in 1977.
- DNA molecules are chemically treated to partially modify specific bases.
- DNA is then cleaved.
- This generates fragments of varying sizes.
- Fragment sizes are resolved by gel electrophoresis to determine sequence.
Lecturer explanation:
The lecturer said the method was important historically but would not be covered in great detail.

What components are used in classical Sanger sequencing?
Classical Sanger sequencing uses:
- Single-stranded DNA template
- One extension primer
- DNA polymerase
- Normal deoxynucleoside triphosphates (dNTPs)
- Modified dideoxynucleoside triphosphates (ddNTPs), which terminate elongation
Sanger sequencing was introduced in 1975.


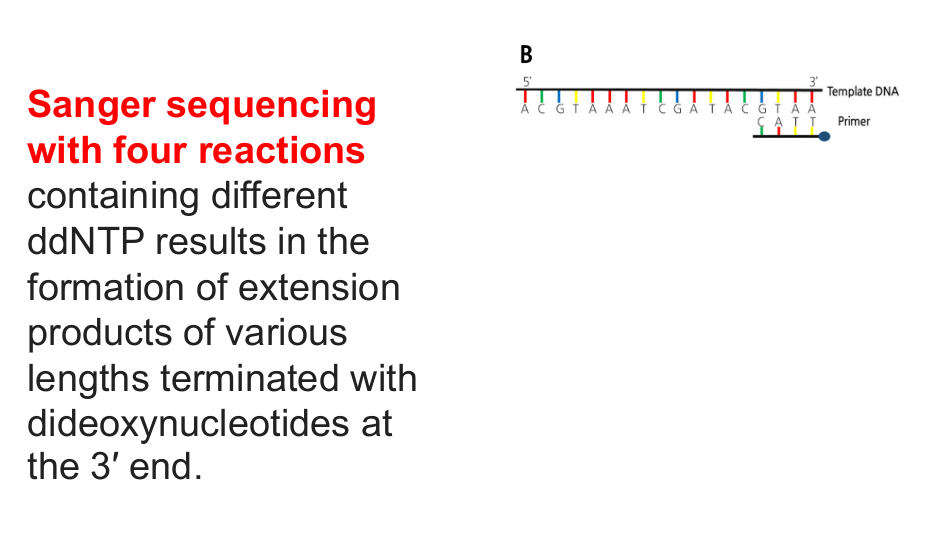
What is the core principle of dideoxy Sanger sequencing?
Four sequencing reactions are performed, each containing a different ddNTP.
Random incorporation of a ddNTP:
- Terminates DNA synthesis.
- Produces extension products of different lengths.
- Leaves the terminating dideoxynucleotide at the 3′ end.
The resulting fragments are separated by size to infer sequence.

Why are four separate reactions used in classical manual Sanger sequencing?
Each reaction contains:
- All four normal dNTPs
- One specific chain-terminating ddNTP
.
The four reactions correspond to:
- ddATP
- ddCTP
- ddGTP
- ddTTP
The lane/reaction in which a fragment appears identifies the terminal base.


What are the main steps of PCR?
1. Add oligonucleotide primers.
2. Heat to separate DNA strands at ~95°C.
3. Cool so primers anneal at ~55-65°C.
4. Heat to ~72°C to allow DNA synthesis.
5. Repeat the denaturation, annealing and extension cycle.


How does PCR produce exponential amplification?
Because both newly synthesised strands become templates in subsequent cycles, target DNA approximately doubles each cycle.
Examples shown:
- 1 cycle → 2 amplicons
- 2 → 4
- 3 → 8
- 6 → 64
- 20 → 1,048,576
- 30 → 1,073,741,824
The slide also notes ~10^6-fold amplification after about 25 cycles.


Why does a Sanger sequencing reaction not exponentially amplify the target like PCR?
Sanger sequencing uses only one primer and a single-stranded template.
Therefore:
- Only one direction of extension occurs.
- Newly formed products do not drive exponential amplification in the same way as two-primer PCR.
Instead, the key products are different-length extension fragments generated by ddNTP termination.


How does product accumulation differ between PCR and Sanger sequencing?
PCR:
- Uses two primers.
- Both strands are copied.
- Product increases exponentially.
.
Sanger sequencing:
- Uses one primer.
- No exponential amplification of the target.
- Produces a ladder of differently sized terminated extension products.


What is the complete manual Sanger sequencing workflow?
1. Start with single-stranded target DNA.
2. Add one sequencing primer.
3. Add all four dNTPs and DNA polymerase.
4. Add one type of ddNTP to each of four separate reactions.
5. DNA is extended from the primer using the template.
6. Incorporation of a ddNTP terminates synthesis because the ddNTP lacks a 3′ OH.
7. Termination occurs at different positions, producing fragments of different lengths.
8. Separate fragments by gel electrophoresis.
9. Read the bands from the bottom of the gel upward.
10. The sequence obtained is complementary to the original template strand.


Why was automated Sanger sequencing developed?
Manual Sanger sequencing was:
- Laborious
- Slow
- Limited in throughput and read length
- Often dependent on radiolabels and toxic gels
Automated Sanger sequencing increased throughput by automating detection and base calling.


What key innovation allowed the four Sanger reactions to be combined into one reaction?
Each ddNTP was tagged with a different fluorescent dye/colour.
Therefore:
- All four ddNTPs could be present in one reaction.
- The terminal base of each fragment could be identified by its fluorescence colour.
- A laser could detect the different fluorescent signals.
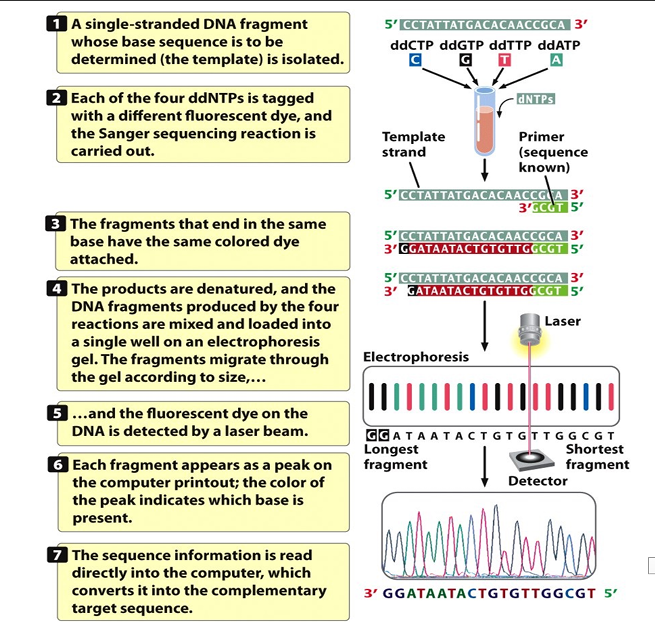
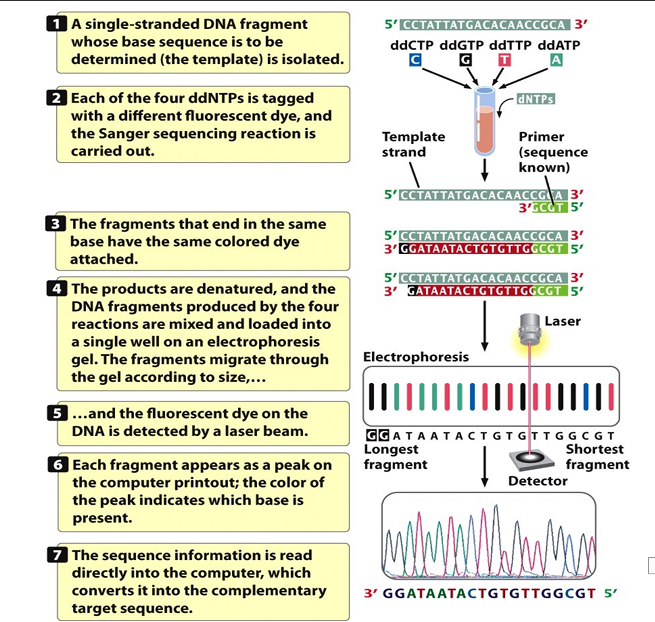
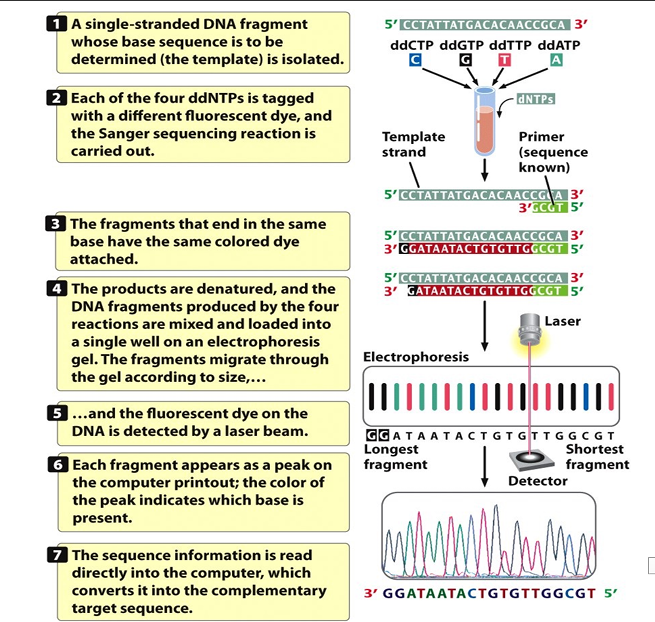
What is the automated Sanger sequencing workflow?
1. Start with a single-stranded DNA template.
2. Add a known primer.
3. Include all four dNTPs and four differently fluorescently labelled ddNTPs.
4. Generate differently sized fluorescently labelled fragments.
5. Denature and separate fragments by electrophoresis according to size.
6. A laser excites the fluorescent dye as fragments pass the detector.
7. The shortest fragments are detected first and longer fragments later.
8. A computer records coloured peaks in a chromatogram.
9. Peak colour identifies the base and sequence is reconstructed.
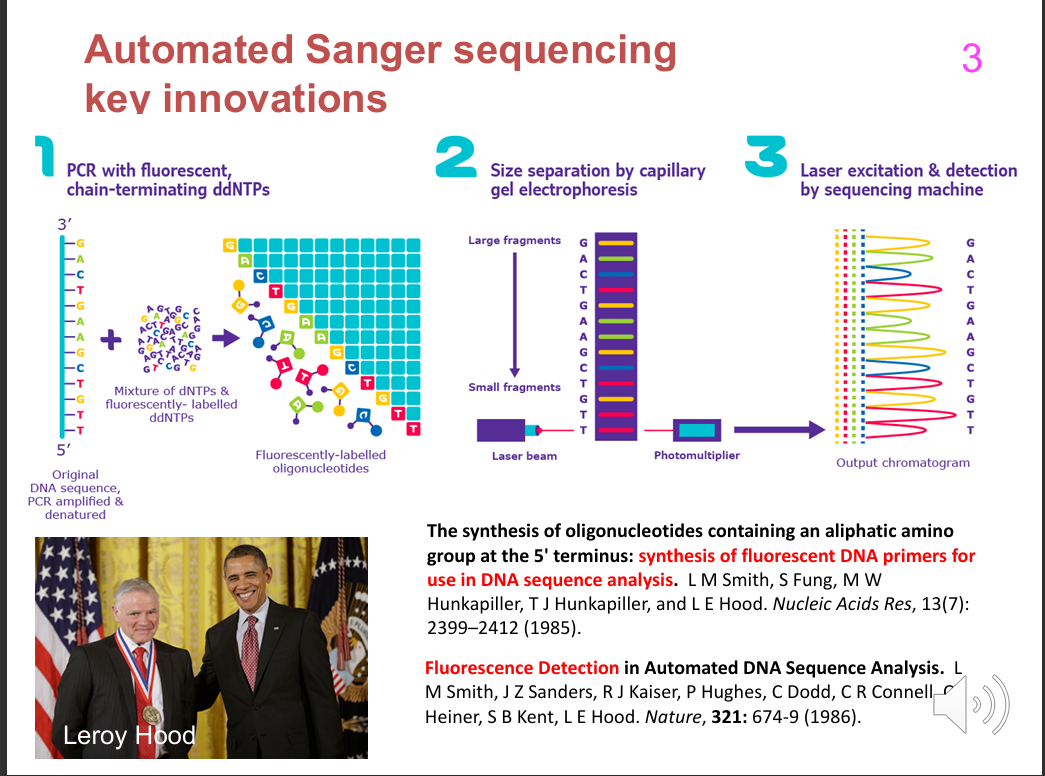
What were the three major technological innovations underpinning automated Sanger sequencing?
1. Fluorescent chain-terminating ddNTPs
2. Size separation by capillary gel electrophoresis
3. Laser excitation and automated optical detection by a sequencing machine
Output:
- Computer-generated chromatogram
Lecturer explanation:
These innovations were strongly associated with Leroy Hood's work and helped enable the draft Human Genome Project.


What is the crucial chemical difference between dNTPs and ddNTPs?
Normal dNTPs:
- dATP, dGTP, dCTP, dTTP
- Possess a 3′ hydroxyl (3′ OH) group.
.
ddNTPs:
- ddATP, ddGTP, ddCTP, ddTTP
- Lack the 3′ OH group.


Why does incorporation of a ddNTP terminate DNA synthesis?
DNA elongation requires the 3′ OH at the end of the growing strand to form the next phosphodiester bond with an incoming nucleotide.
A ddNTP lacks this 3′ OH.
Therefore:
- The next phosphodiester bond cannot form.
- DNA-chain elongation stops.


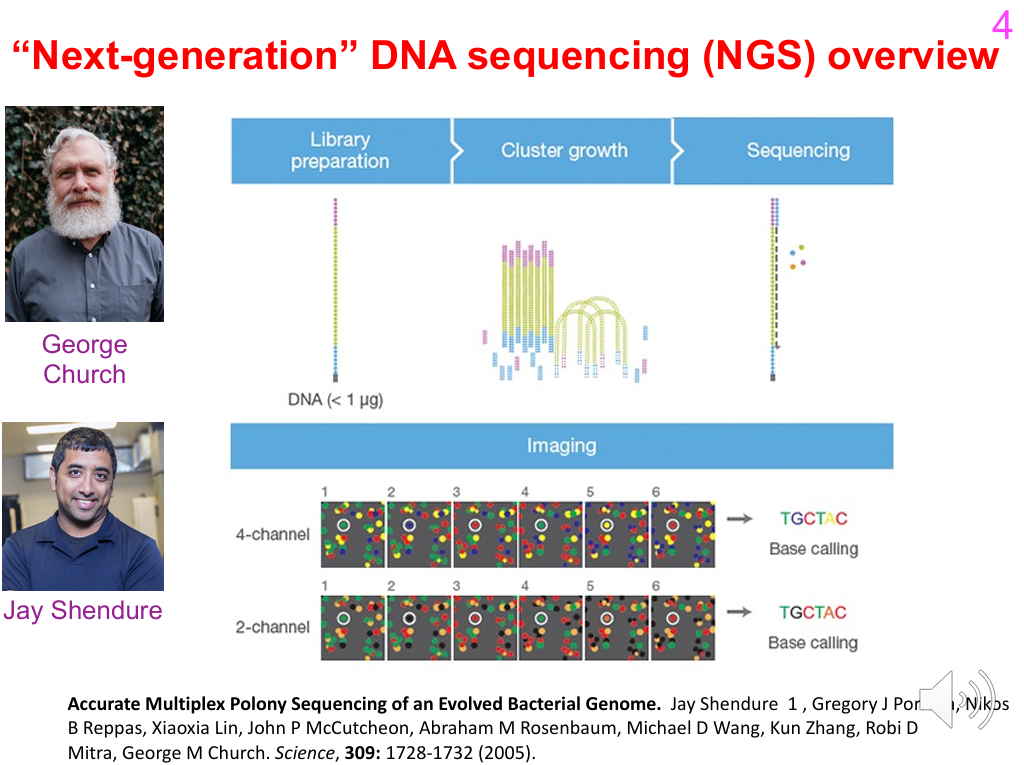
What are the major phases of Illumina next-generation sequencing?
1. Library preparation
2. Cluster growth / cluster generation
3. Sequencing by synthesis
4. Imaging/base calling and downstream analysis
Lecturer explanation:
Illumina adapted sequencing chemistry to a flow-cell surface so millions of molecules could be sequenced in parallel.
What does 'massively parallel' mean in Illumina sequencing?
Millions to hundreds of millions of separate DNA clusters are sequenced simultaneously on a flow cell.
Unlike classical Sanger:
- Reactions are not analysed one tube at a time.
- Sequencing occurs across many spatially separated clusters at once.

What are the four broad stages in generating and analysing NGS data?
1. Sample pre-processing
2. Library preparation
3. Sequencing
4. Bioinformatics


How is a DNA sequencing library prepared for NGS?
For genomic DNA:
- Start with genomic DNA.
- Fragment the DNA or generate amplicons.
- Ligate adapter sequences to fragment ends.
- Produce a sequencing library.
.
For RNA:
- Convert RNA to cDNA, usually by RT-PCR/reverse transcription.
- Add adapters.
- Produce a sequencing library.

Which library-construction details did the lecturer say were not required? (NOT ASSESSABLE)
The lecturer said students did not need to know the detailed names of the individual library-preparation procedures shown.
Required principle:
- DNA is prepared/fragmented.
- Adapter sequences are attached.
- RNA must first be converted to cDNA before sequencing.
Lecturer explanation:
The specific procedural names on the slide were explicitly described as unnecessary to know in detail.
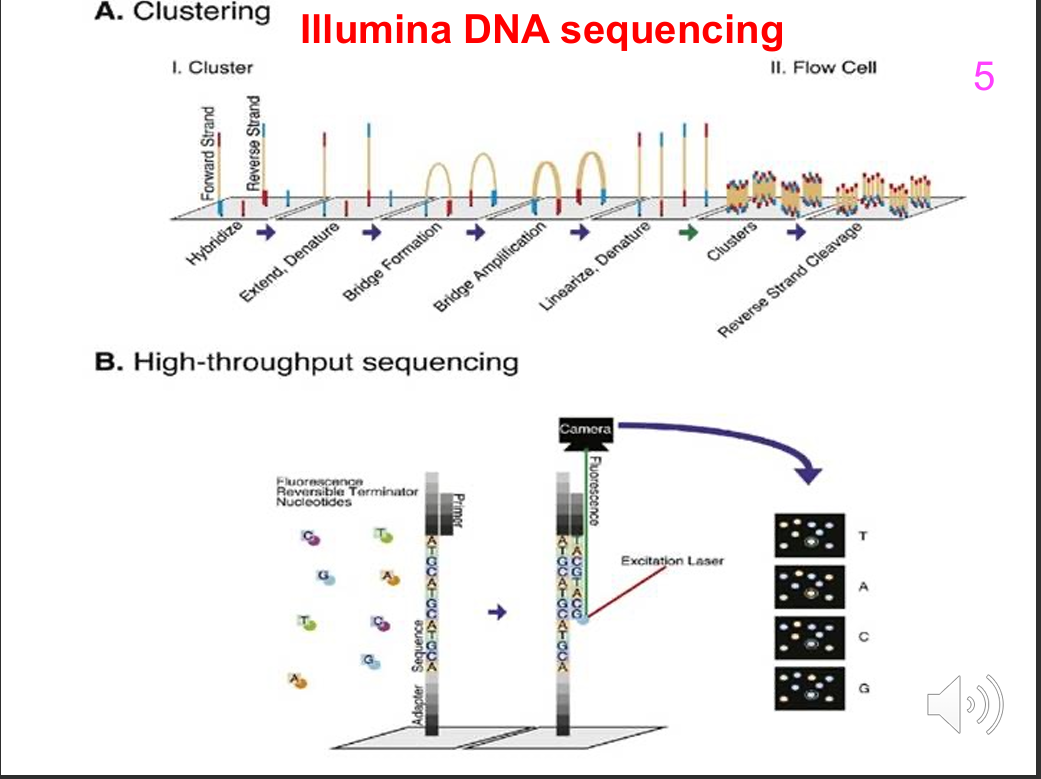
How does Illumina cluster generation occur on the flow cell?
1. Adapter-tagged DNA fragments hybridise to complementary oligonucleotides on the flow-cell surface.
2. DNA polymerase makes a complementary strand.
3. DNA is denatured and the original template can be removed.
4. The tethered strand bends over and hybridises to a second surface oligo, forming a bridge.
5. DNA polymerase extends the bridge.
6. The double-stranded bridge is denatured.
7. Repeated bridge amplification produces a clonal cluster.
8. The reverse strands are cleaved/washed away, leaving strands prepared for sequencing.
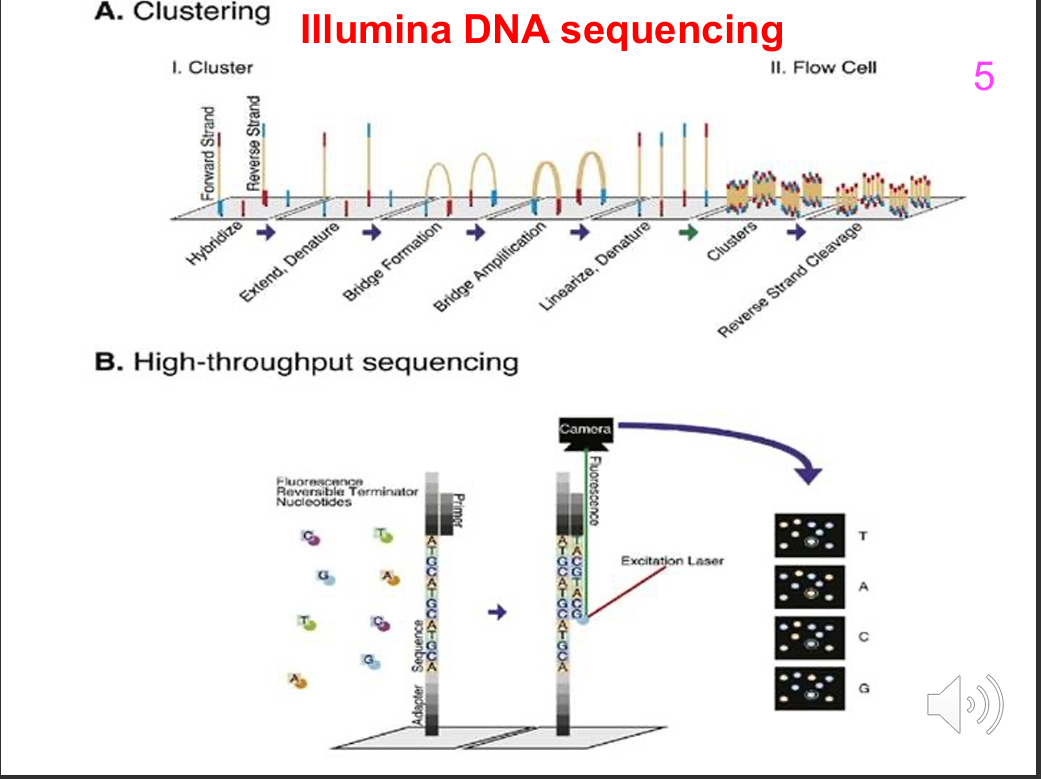
What is the purpose of Illumina cluster amplification?
Each original library molecule is clonally amplified into a spatially localised cluster containing many identical copies.
Purpose:
- Generate enough fluorescent signal at each location for reliable imaging and base calling.
What happens during one cycle of Illumina sequencing by synthesis?
1. The flow cell is flooded with DNA polymerase and fluorescently labelled reversible-terminator nucleotides.
2. Only the nucleotide complementary to the template is incorporated.
3. The terminator ensures only one base is added in that cycle.
4. The flow cell is imaged.
5. The colour at each cluster identifies the incorporated base.
DIAGRAM ON SLIDES 44-45
Why are reversible terminators essential for Illumina sequencing?
They ensure that only one nucleotide is added per sequencing cycle.
After imaging:
- The terminator is removed.
- The fluorescent label is removed.
- The next cycle can proceed.
This prevents the previous fluorescent signal from contaminating the next image.
How is a DNA sequence reconstructed in Illumina sequencing?
After every cycle:
- The incorporated base produces a characteristic fluorescent signal at each cluster.
- An image records the colour.
- The fluorophore and terminator are removed.
- Another nucleotide is added in the next cycle.
Computers track the colour sequence across cycles to reconstruct the DNA sequence at each cluster.
DIAGRAM ON SLIDES 46-49
What determines read length in Illumina sequencing?
Read length is determined by the number of sequencing cycles performed.
Therefore:
- All reads in the illustrated run are the same length.
- More cycles produce longer reads.
How are base calls made from Illumina images?
For each cluster:
- Emission wavelength/colour identifies which base was incorporated.
- Signal intensity contributes to base calling.
- Computers identify the base at each site in each image.
- The sequence across cycles is assembled into a read.
What additional reads can Illumina generate besides Read 1?
The workflow described in the transcript can generate:
- Read 1
- Index 1 read
- Index 2 read
- Read 2
Index reads:
- Identify which pooled sample/library a sequence came from.
Read 2:
- Sequences the opposite end of the library fragment after the template is reoriented on the flow cell.
Why is paired-end Illumina sequencing useful?
Forward and reverse reads from the same DNA fragment can be paired.
This:
- Creates more contiguous sequence information.
- Helps resolve ambiguous alignments when reads are mapped to a reference genome.
What do the Illumina instrument and sequencing-facility images illustrate?
They illustrate the physical scale of modern high-throughput sequencing.
A single instrument can generate very large amounts of sequence data, and facilities may contain many sequencing machines operating in parallel.
DIAGRAM ON SLIDES 50-51
What are the main file types in a typical NGS variant-analysis workflow?
FASTQ:
- Contains sequencing reads.
FASTA:
- Common format for the reference genome.
BAM:
- Contains reads mapped/aligned to the reference genome.
BAI:
- Index file used with BAM.
VCF:
- Contains a list of called genetic variants.
What is the typical bioinformatics workflow from raw NGS reads to a variant list?
1. Sequencing generates FASTQ reads.
2. Reads are mapped/aligned to a reference genome, often stored in FASTA format.
3. Mapped reads are stored in a BAM file.
4. BAM is accompanied by a BAI index.
5. Variant-calling algorithms identify sequence differences.
6. Variants are written to a VCF file.
DIAGRAM ON SLIDES 52-54
What is GATK?
GATK is a commonly used software framework/program for processing sequencing data, including FASTQ-derived data, and supporting workflows that produce genetic-variant calls.
Lecturer explanation:
It was developed by the Broad Institute.
What are major applications of DNA sequencing discussed in the lecture?
- Genome sequencing for mutation detection
- Exome sequencing
- RNA transcript sequencing / RNA-seq
- DNA methylation sequencing
- Microbiome / metagenomics
- Many other genome-assay applications
How did the lecturer compare the cost of the Human Genome Project with modern NGS?
Human Genome Project:
- Relied primarily on automated Sanger sequencing.
- Cost about US$3 billion.
- Took approximately 13 years (1990-2003).
Modern NGS:
- Whole human genome sequencing can cost about US$1,000.
Lecturer addition:
- Exome sequencing can be substantially cheaper, around a few hundred dollars.
How can DNA sequencing be used to study RNA expression?
Earlier approach:
- Sequence cDNA clones using first-generation methods.
Modern approach:
- RNA-seq using NGS.
Purpose:
- Sequence transcripts in a sample.
- Obtain a view of the transcriptome / gene expression.
How can sequencing be used to assess DNA methylation?
Bisulfite treatment:
- Converts unmethylated cytosine to uracil, which is read as thymidine after sequencing.
- Methylated cytosines are protected.
By comparing untreated and bisulfite-converted DNA, methylation status of cytosine residues can be inferred.
What was the key point of the ENCODE sequencing-applications slide? (NOT ASSESSABLE)
Many assays use sequencing to investigate genomic features beyond simple DNA-sequence variation.
Examples include sequencing enriched genomic fractions, such as regions associated with particular chromatin features or long-range contacts.
Lecturer explanation:
The detailed assay names were not required; the important point was that sequencing has broad genomic applications.
What are the three sequencing-coverage terms introduced in the lecture?
1. Average fold coverage
2. Percentage coverage
3. Number of mapped reads / sequencing depth
What is average fold coverage?
Average fold coverage is the average number of sequencing reads covering a reference base.
Lecturer example:
- Typical whole-genome sequencing may use ~30× average coverage.
- This means a reference base is covered by about 30 reads on average.
What is percentage coverage?
Percentage coverage is the percentage of the target region covered by at least a specified number of reads.
Lecturer example:
A whole-genome assay might report that 80% of the genome has >10 reads covering it.
What does number of mapped reads or sequencing depth mean?
It refers to the total number of sequencing reads that map to the target/reference.
Example:
- A dataset might contain 20 million mapped reads.
Lecturer explanation:
The exact formulae were not required; these terms were introduced to support understanding of later material.
How does capture sequencing enrich selected genomic regions?
1. Genomic DNA is fragmented, e.g. by sonication.
2. Biotin-labelled capture oligonucleotides complementary to selected target regions are added.
3. Target fragments hybridise to the capture oligos.
4. Hybridised molecules are purified, often using the biotin label for magnetic separation.
5. Enriched target DNA proceeds to library preparation and sequencing.
DIAGRAM ON SLIDE 58
How do targeted panel, whole-exome and whole-genome sequencing differ?
Targeted panel sequencing:
- Roughly 40-400 genes in the slide example.
- Targets a small gene set.
- High coverage.
Whole-exome sequencing:
- Targets coding genes (~22,000 genes shown on slide).
- Intermediate coverage.
Whole-genome sequencing:
- No targeted selection of specific genomic regions.
- Includes coding and non-coding DNA and can identify events such as translocations.
- Lower coverage per region than focused assays.
DIAGRAM ON SLIDES 59-60, 62
Why can targeted sequencing achieve higher coverage than whole-genome sequencing?
Because sequencing effort is concentrated on a much smaller selected region.
Therefore:
- More reads can be allocated to each targeted base.
- Targeted panels can achieve very high read depth.
Why is the term 'whole-genome sequencing' somewhat misleading? (NOT ASSESSABLE)
Whole-genome sequencing aims to sequence across the entire genome without selecting only particular regions.
However:
- Current/typical clinical methods do not necessarily recover every base.
- Repetitive and technically difficult regions may remain unresolved.
- The slide notes that GRCh38 still contained 151 Mbp of unknown sequence before completion work.
Lecturer explanation:
The historical detail was marked FYI and did not need to be memorised.
How can NGS data be used to detect copy-number variation?
CNV can be inferred from mapped-read density.
Compared with a normal/control region:
- Duplication → increased local number of mapped reads.
- Deletion → reduced or absent local read coverage.
DIAGRAM ON SLIDES 63-64
What read-depth information is required from the CNV-detection-by-coverage slide? (NOT ASSESSABLE)
Required principle:
- Local changes in sequencing read density can reveal copy-number gains or losses.
Not required:
- The detailed mathematical modelling shown on the slide.
Lecturer explanation:
The lecturer explicitly said the mathematical details were not required.
What is a DNA microarray?
A microarray is a slide/chip containing many predefined DNA probe spots.
A fluorescent scanner measures hybridisation signal at each spot.
The pattern and intensity of signals can be used to infer genotype and chromosomal copy-number abnormalities.
DIAGRAM ON SLIDE 65
How are spotted DNA microarrays manufactured?
A printing head/print tip:
- Takes up DNA solution by capillary action.
- Deposits nanolitre-sized drops onto a slide.
- Each droplet dries, leaving a DNA spot.
- Spots are arranged in a rectangular grid.
DIAGRAM ON SLIDES 66-67
What is the core principle of an SNP microarray such as Illumina BeadArray?
Known SNPs are interrogated with allele-specific probes.
For a SNP with two alleles:
- Strong signal from one allele only → homozygous for that allele.
- Signal from both allele-specific probes → heterozygous.
- Signal intensity patterns across many probes can also reveal deletions or copy-number changes.
DIAGRAM ON SLIDE 68
How do SNP-array signal intensities distinguish common genotypes and deletions?
Typical clusters:
- High G / low A → GG
- Signal from both A and G → AG
- High A / low G → AA
Deletion patterns:
- Reduced signal from one remaining allele can indicate a heterozygous deletion.
- Little/no signal can indicate a homozygous deletion.
DIAGRAM ON SLIDE 69
Which details of the specific BeadArray design did the lecturer say were not important? (NOT ASSESSABLE)
The lecturer said students did not need to know the detailed design of that specific microarray platform.
Required principle:
- Allele-specific probe intensity is used to infer genotype and copy-number-related abnormalities.
What two measurements are used to interpret SNP-array copy-number data?
1. Log R ratio
- Reflects total probe-signal intensity / copy number.
2. B-allele frequency
- Reflects relative allele composition/balance.
Together they help distinguish:
- Normal 2N
- Deletion 1N
- Amplification 3N
- Loss of heterozygosity (LOH)
DIAGRAM ON SLIDE 70
What SNP-array pattern indicates a deletion?
Deletion:
- Log R ratio decreases below the normal 2N level.
- Heterozygous signal is lost across the affected region.
- B-allele-frequency pattern becomes consistent with only one copy.
DIAGRAM ON SLIDE 70
What SNP-array pattern indicates a copy-number gain?
Amplification:
- Log R ratio rises above the normal 2N level.
- Additional B-allele-frequency tracks appear.
For 3N, possible genotype states include:
- AAA
- AAB
- ABB
- BBB
DIAGRAM ON SLIDE 70
What SNP-array pattern indicates copy-neutral loss of heterozygosity?
Copy-neutral LOH:
- Log R ratio remains around the normal 2N level.
- B-allele-frequency plot loses the heterozygous track over a region.
- Total copy number is unchanged, but allele balance is abnormal.
DIAGRAM ON SLIDE 70
How can a focal copy-number alteration be identified on a microarray?
A focal alteration can be identified by:
1. Detecting an abnormal region on a genome/chromosome-wide plot.
2. Zooming into the affected region.
3. Observing consistent intensity changes across many neighbouring probes.
4. Localising the abnormality to specific genes.
DIAGRAM ON SLIDE 71
How can tumour and normal microarray profiles distinguish somatic from germline CNVs?
Tumour-specific alteration:
- Present in tumour sample.
- Absent from matched normal.
→ Suggests a somatic event.
Germline CNV:
- Present in both tumour and normal samples.
→ Suggests an inherited/constitutional copy-number variant.
DIAGRAM ON SLIDE 72
What did the FBN1 Marfan-family example demonstrate?
Whole-genome sequencing showed:
- A region of reduced read depth across FBN1.
- This suggested a large deletion.
The deletion was confirmed using an additional method, including Sanger sequencing at the breakpoint.
Lecturer emphasis:
This illustrates Sanger sequencing being used to confirm an abnormality detected by a broader sequencing approach.
DIAGRAM ON SLIDE 73
What is the difference between normal biparental inheritance, heterodisomy and isodisomy?
Normal:
- One homologous chromosome is inherited from each parent.
Heterodisomy:
- Both homologous chromosomes come from the same parent.
Isodisomy:
- Two copies of the same chromosome homolog come from one parent.
Both heterodisomy and isodisomy are forms of uniparental disomy.
DIAGRAM ON SLIDE 74
What mechanisms can produce uniparental disomy? (NOT ASSESSABLE)
Mechanisms shown:
- Trisomy rescue
- Monosomy rescue
- Mitotic crossing-over
- Segmental uniparental disomy
- Maternal heterodisomy
- Paternal isodisomy
Lecturer explanation:
The lecturer explicitly said students would not be tested on these detailed mechanism terms.
How can SNP-array data detect uniparental disomy?
UPD can occur without a change in total copy number.
Therefore:
- Log R ratio may remain normal at 2N.
- B-allele frequency shows a long region with loss of heterozygosity.
This combination can indicate copy-neutral LOH / uniparental disomy.
DIAGRAM ON SLIDE 76
What clinical example of uniparental disomy detection was shown?
The slide showed a chromosome region with:
- Normal total copy number by Log R ratio
- Large-scale loss of heterozygosity by B-allele frequency
The lecturer described this as an example associated with Prader-Willi syndrome and noted it would be revisited in the epigenetics lecture.
DIAGRAM ON SLIDE 76
What are the final take-home uses of Sanger sequencing, microarrays and NGS in the clinic?
Sanger sequencing:
- Often confirms a strongly suspected gene-candidate mutation.
Microarray:
- Detects many clinically relevant chromosomal abnormalities.
NGS:
- Increasingly used in the clinic.
- Supports many applications.
- Can identify many classes of variants, including CNVs.
Ethical consideration:
- Broad sequencing can reveal variants of unknown/uncertain significance.
What is a major ethical issue created by broad next-generation sequencing?
NGS may identify variants of unknown or uncertain significance.
This can create uncertainty about:
- Clinical interpretation
- Whether the variant causes disease
- How findings should be communicated or acted upon
Lecturer emphasis:
This was highlighted as a unique ethical consideration of increasingly broad clinical sequencing.