Project Management Basics in Six Sigma
 Call Kai
 Learn
 Practice Test
 Spaced Repetition
 Match
 Flashcards
 Knowt Play
1/51

Earn XP
Description and Tags
week 6
52 Terms
Project charter
the foundation and roadmap of any six sigma projects; outline project purpose and scope, secure support, define criteria, and focus on measurable improvements
Problem statement
identify problem, use 5 W’s to describe issue, focus on facts without assumptions, avoid including fixes, and stay concise but informative
Project scope
define what is included and excluded
Baseline data
the performance benchmark
Listing team members does what?
improves communication and decision making and clarify roles using RACI ( Responsible for tasks, Accountable for outcomes, & Consulted for input)
How does establishing timelines help?
marks key milestones, outlines start and end dates, communicate to stakeholders, monitor progress, and uses tollgates for reviews
Project goal
clear, specific, achievable, and measurable
Communication Plans
Acts as a roadmap that guides how info flows among project members and stakeholders
why is it important to choose appropriate communication forms?
match communication methods to project context and stakeholder needs, align methods with audience preferences and message natures, and combine approaches to improve engagements
types of communication
Written communication for detailed permanent records, verbal for quick clarification, and digital tools for real updates like dashboards and chat groups
work breakdown structures (WBS)
Breaks large projects into smaller tasks easier to manage and track
WBS steps
Start with main project deliverables, use decomposition to break down deliverables, develop a hierarchical tree of tasks, continue dividing until tasks are assignable, focus on clear actionable items
work packages
smallest units of work; include activities and tasks
WBS can be used for…
scheduling, budgeting, project control, and monitoring

gantt charts
visualizes timelines and dependencies, display task durations and overlays clearly, and identify concurrent and sequential activities
milestones
key check points within a project
slack time
how much a subsequent task can be delayed without impacting subsequent activities; buffer between tasks
how are gantt charts used to track progress?
updated task completion percentages regularly, detect schedule variances early, visualize delays and progress on the chart, facilitate transparent communication among team members, and enable timely corrective actions
activity network diagrams (ANDs)
display tasks that must precede others and those that run concurrently, reveal workflow structure to coordinate team efforts, and detect potential task overlaps and conflicts early
critical path
the sequence of connected activities that takes the longest time
how to determine critical path
Calculate total duration for each task sequence and identify tasks that directly impact project completion time
how are ANDs used for communication?
Enhance team understanding of task flow and relationships, clarify how individual work fits into overall project goals, and facilitate collaboration to resolve scheduling issues
how are ANDs developed?
Identify all tasks needed to complete the project, define dependencies between tasks clearly, arrange tasks in the order they will be performed, analyze the network to find the critical path, and use diagram to spot scheduling risks and manage timelines
how are ANDs used to identify scheduling risks?
they can detect delays that cause cascading effects on dependent tasks and visualize risks that threaten project deadline
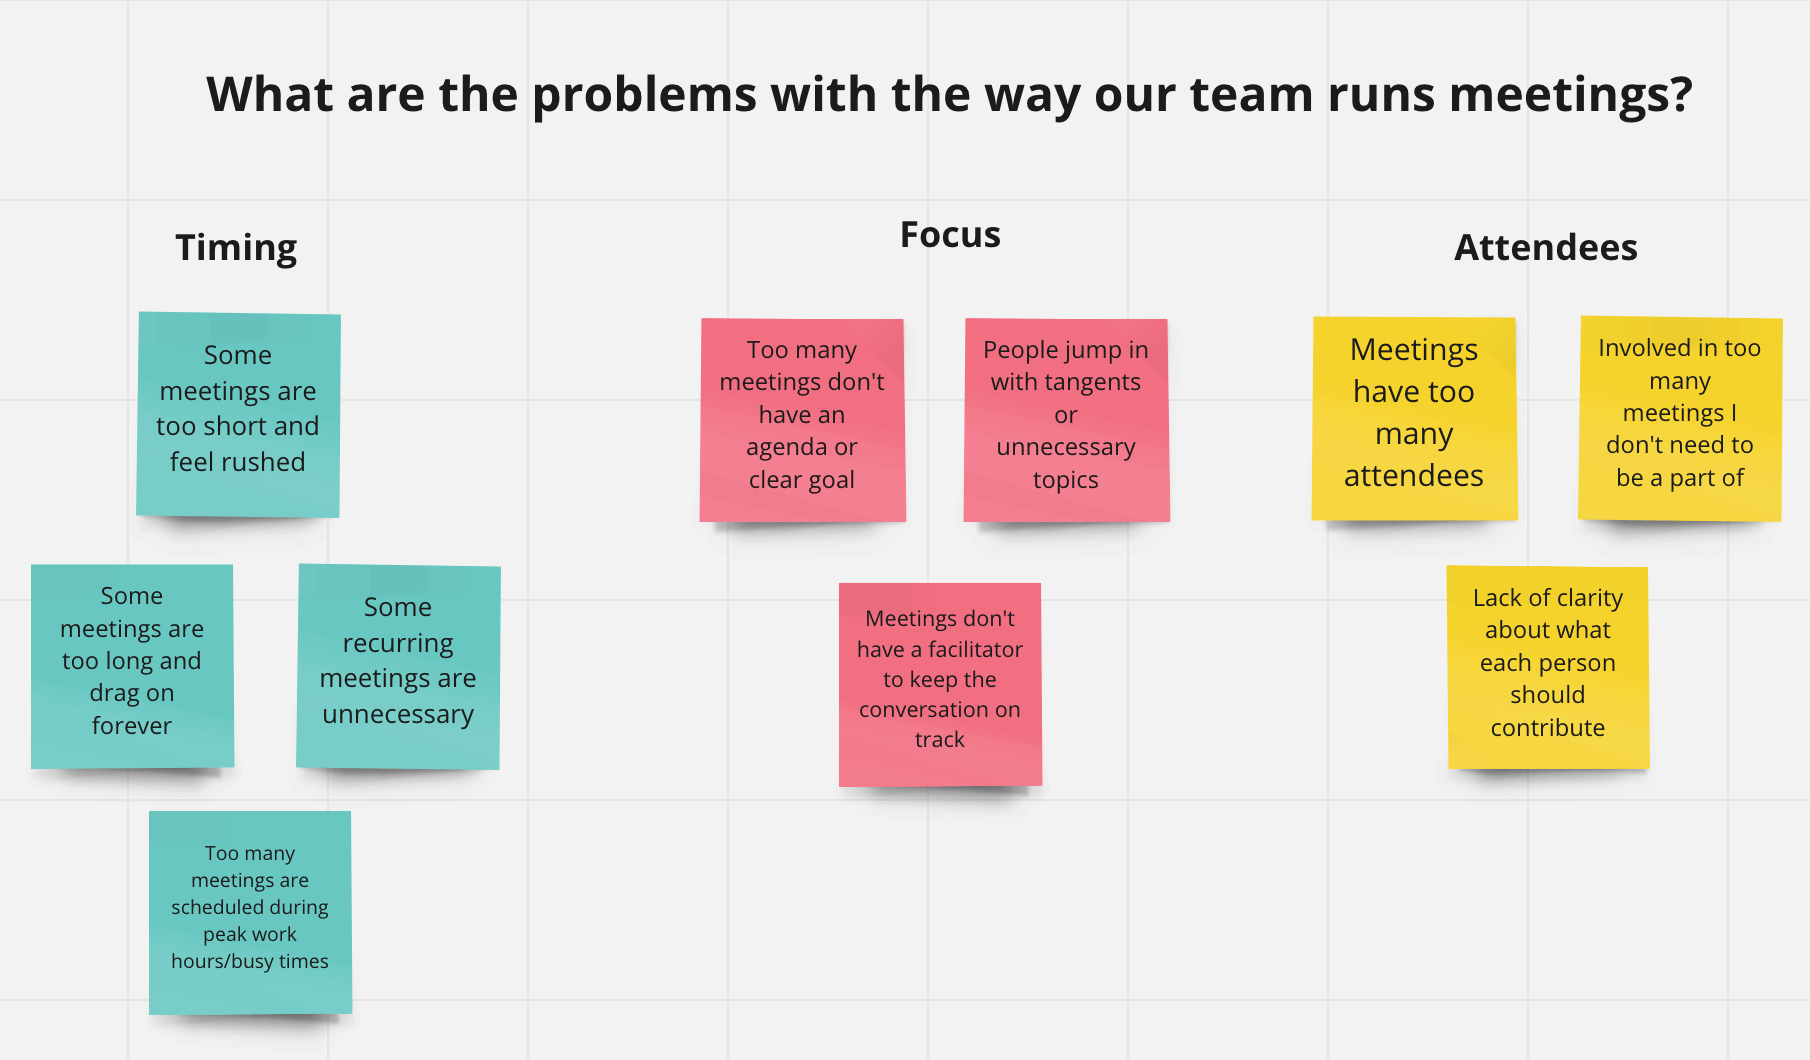
affinity diagrams
Cluster related ideas together to organize brainstorming results
When would affinity diagrams be used?
after idea generation, during define and analyze phases of six sigma, when grouping root causes to identify investigation area, and to organize customer requirements and project goals
affinity diagram sessions include…
visible boards or wall space with sticky notes, encouraged open participation from all team members, no early judgement or premature grouping, discussion to explore idea relationships, and diverse perspectives for deeper insights
how affinity diagrams are created
Write each idea on separate sticky note or card, group similar ideas based on observed relationships, label clusters with descriptive themes or categories, & create visual map highlighting key patterns

matrix diagrams
Help visualize relationships between 2 or more elements, link customer needs with product features in projects, and clarify interdependencies to support prioritization
L shaped matrix
compares 2 element sets (most common)
T shaped matrix
links 3 sets with a common element
Y shape matrix
shows triangular relationships among 3 sets
C shape matrix
arranges 3 sets in a circular pattern
X shaped matrix
compares 4 sets for complex interdependencies
creating a matrix diagram
Identify element sets to compare, choose matrix format based on number of sets, indicate relationship strength with symbols or scores, and use solid and hollow circles to represent connection levels
solid circle
strong relationship
hollow circle
medium relationship
blank space
weak or no relationship

relations charts
Map factors influencing a problem and show how factors relate to each other, display cause and effect connections, and highlight interdependencies among elements
when to use relations charts
during define and analyze phases, when exploring multiple interconnected causes, and to untangle complex problem relationships
how to build relations charts
Identify central problem, list all influencing and influenced factors, connect factors with directional arrows, and collaborate to capture all perspectives

tree diagrams
Organize complex problems into smaller, manageable parts using hierarchical mapping
vertical tree structure
shows clear hierarchies and breakdowns
horizontal tree structure
represent process flows or product sequences
how tree diagrams are structured
Start with a broad goal at the top of the hierarchy, branch into major categories representing key components, and further divide categories into detailed sub-elements
tollgate reviews
Mark formal checkpoints at the end of each DMAIC phase
define phase tollgate review
Verifies problem statement and project charter
measure phase tollgate review
Checks data accuracy and baseline metrics
analyze phase tollgate review
Validates root cause analysis
improve phase tollgate review
Confirms tested solutions
control phase tollgate review
Ensures controls sustain improvements
components of a tollgate review
current project status and milestones, deliverables for quality and requirements, and any risks affecting timeline or outcomes